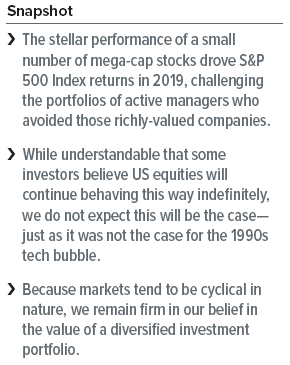
Outsized Outperformance: Opportunity for Active Investors?
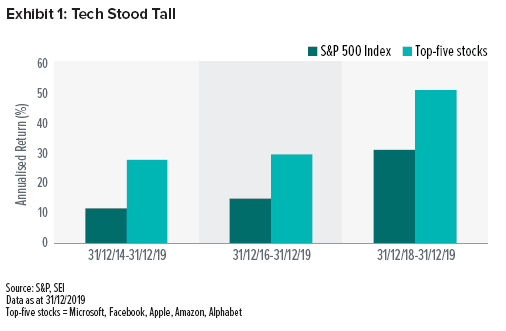
Large-cap technology companies dominated the US stock market in 2019, with sky-high prices becoming almost a residual consideration. As shown in Exhibit 1, the five largest stocks in the S&P 500 Index (Microsoft, Facebook, Apple, Amazon and Google) far outpaced the broader S&P 500 Index for the year—gaining more than 50% versus just 30% for the overall Index. The group’s annualised outperformance over the past three and five years is equally impressive.
We’ve been here before
It’s easy to see historical parallels when comparing the equity market of today with that of the 1990s. Back then, investors became excessively confident in internet-based technology companies that underwent extreme and rapid growth. The resulting tech bubble provided a narrow market (similar to the current environment), with outperformance concentrated in a small number of companies. During that period, active investment managers tended to trail the S&P 500 Index—and, therefore, passively-managed strategies—until the bubble burst in 2000.
A similar story is unfolding today as we look back on more than a decade of passively-managed strategies once again outperforming most active US equity managers. The soaring returns of a small number of stocks—this time, a handful of technology and e-commerce companies—have inflated the market: By the end of December 2019, the technology sector’s weighting in the S&P 500 Index was approaching levels not seen since the 1990s tech bubble.1
Narrow markets provide insight into active management
While we have seen this before, it is still uncommon for the largest companies to outperform as dramatically as they have in recent years. When this kind of phenomenon persists for an extended period, the outperforming companies tend to dominate market performance. Awareness of this dynamic enables us to build a better picture of active management as a whole—most active managers are typically underweight the largest-capitalisation stocks.
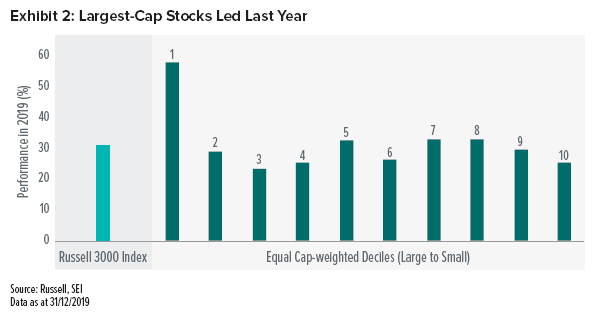
The recent plight of active management becomes clearer when we observe the difference in performance between the largest-capitalisation stocks and their smaller counterparts. Looking at equal-weighted deciles of the Russell 3000 Index (with each decile constituting 10% of the Index market cap), the largest stocks in the US market were in a universe of their own last year. Being so big, and appreciating so much, they rose far beyond the reach of almost all other market segments (Exhibit 2).
Is such behaviour unusual? Not completely. But to us, it appears unsustainable. Just as trees don’t grow to the sky, stock prices don’t rise forever.
So, when will their ascent reach a turning point? We do not think it wise to believe that anyone could predict this with total accuracy—but we can look at history and make causal observations.
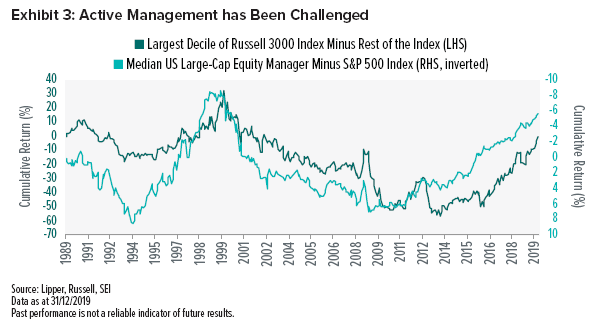
The current state of the market in terms of concentration among mega-cap stocks bears a striking resemblance to the 1990s, as shown in Exhibit 3 (we use the US market data for its length of history and cleanliness of data). Over the past three decades, active large-cap managers have been tested when the largest-cap stocks led the broader market—particularly in the late 1990s as investors piled into an ever-smaller number of mega-cap stocks. These managers fared better during the following decade.
Over the past 30 years, we also saw comparable (but short-lived) behaviour in 2008 and again in the 2011-to-2012 period.
Outlook: It’s not different this time
While it is human nature to look to the current (or most recent) equity environment for insight into future performance, investment professionals often look at a bigger picture that encompasses the cyclical nature of the equity market. We think this broader view weakens the case for passive investing.
Yes, active management has been challenged over the last few years as investors chased an increasingly small number of overvalued mega caps. But such disappointing results for active management created an outsized opportunity for future investing, reminiscent of the opportunity that followed the technology bubble of the late 1990s. Broadly speaking, based on historical precedent, active management as a whole—with its higher-volatility, smaller-cap and fundamental biases—will likely experience a cyclical uptrend when larger-cap growth stocks eventually get recognised for the lack of upside in their valuations. We believe that an actively-managed diversified portfolio is better positioned to weather such eventualities than one concentrated in the largest names.
Passively-managed strategies are, by definition, unable to alter their index-tracking mandates. Actively-managed strategies, on the other hand, can seek greater exposure to high-quality companies as the equity market moves into an environment in which companies are valued based on fundamentals.
When will the market recognise the fundamentals? Nobody can say for sure. But no matter what the future may hold, we are optimistic that our actively-managed equity strategies are well-positioned over the long-term.
Important Information
The opinions and views in this commentary are of SEI only and are subject to change. They should not be construed as investment advice.
Investments in SEI Funds are generally medium- to long-term investments. The value of an investment and any income from it can go down as well as up. Investors may get back less than the original amount invested. Returns may increase or decrease as a result of currency fluctuations. Past performance is not a reliable indicator of future results. Additionally, this investment may not be suitable for everyone. If you should have any doubt whether it is suitable for you, you should obtain expert advice.
The SEI Global Assets Fund Plc, SEI Global Investments Fund Plc, and SEI Global Master Fund Plc (the “SEI Funds”) are structured as open-ended collective investment schemes and are authorised in Ireland by the Central Bank as a UCITS pursuant to the UCITS Regulations. The SEI Funds are managed by SEI Investments, Global Ltd (“SIGL”). SIGL has appointed SEI Investments (Europe) Ltd (“SIEL”), an affiliate of SIGL, (together “SEI”) to provide general distribution services in relation to the SEI Funds either directly or through the appointment of other sub-distributors. The SEI Funds may not be marketed to the general public except in jurisdictions where the funds have been registered by the relevant regulator. The matrix of the SEI fund registrations can be found here seic.com/GlobalFundRegistrations.
No offer of any security is made hereby. Recipients of this information who intend to apply for shares in any SEI Fund are reminded that any such application may be made solely on the basis of the information contained in the Prospectus. This material represents an assessment of the market environment at a specific point in time and is not intended to be a forecast of future events, or a guarantee of future results. This information should not be relied upon by the reader as research or investment advice regarding the funds or any stock in particular, nor should it be construed as a recommendation to purchase or sell a security, including futures contracts.
In addition to the normal risks associated with equity investing, international investments may involve risk of capital loss from unfavourable fluctuation in currency values, from differences in generally accepted accounting principles or from economic or political instability in other nations. Bonds and bond funds are subject to interest rate risk and will decline in value as interest rates rise. High yield bonds involve greater risks of default or downgrade and are more volatile than investment grade securities, due to the speculative nature of their investments. Narrowly focused investments and smaller companies typically exhibit higher volatility. SEI Funds may use derivative instruments such as futures, forwards, options, swaps, contracts for differences, credit derivatives, caps, floors and currency forward contracts. These instruments may be used for hedging purposes and/or investment purposes.
While considerable care has been taken to ensure the information contained within this document is accurate and up-to-date, no warranty is given as to the accuracy or completeness of any information and no liability is accepted for any errors or omissions in such information or any action taken on the basis of this information.
This information is issued by SEI Investments (Europe) Limited, 1st Floor, Alphabeta, 14-18 Finsbury Square, London EC2A 1BR which is authorised and regulated by the Financial Conduct Authority. Please refer to our latest Full Prospectus (which includes information in relation to the use of derivatives and the risks associated with the use of derivative instruments), Key Investor Information Documents and latest Annual or Semi-Annual Reports for more information on our funds. This information can be obtained by contacting your Financial Adviser or using the contact details shown above. SEI sources data directly from FactSet, Lipper, and BlackRock, unless otherwise stated.


