Monthly Market Commentary: Stocks flatline on economic and AI worries.
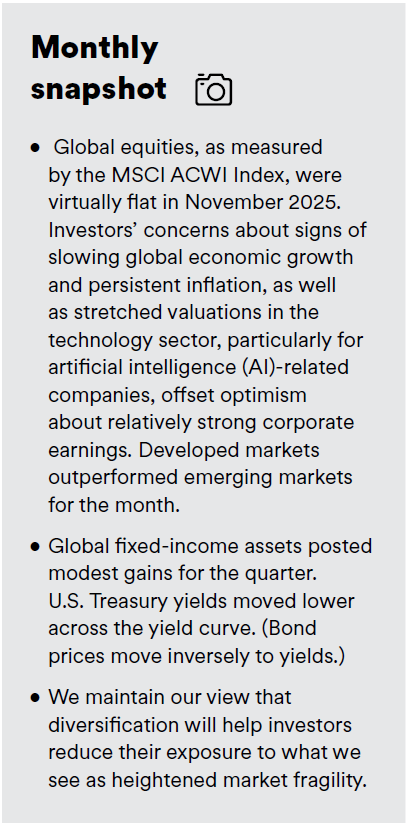
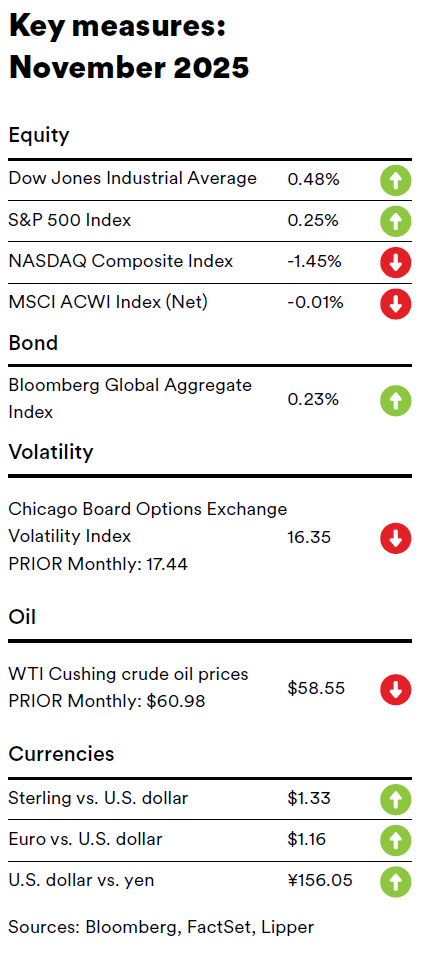
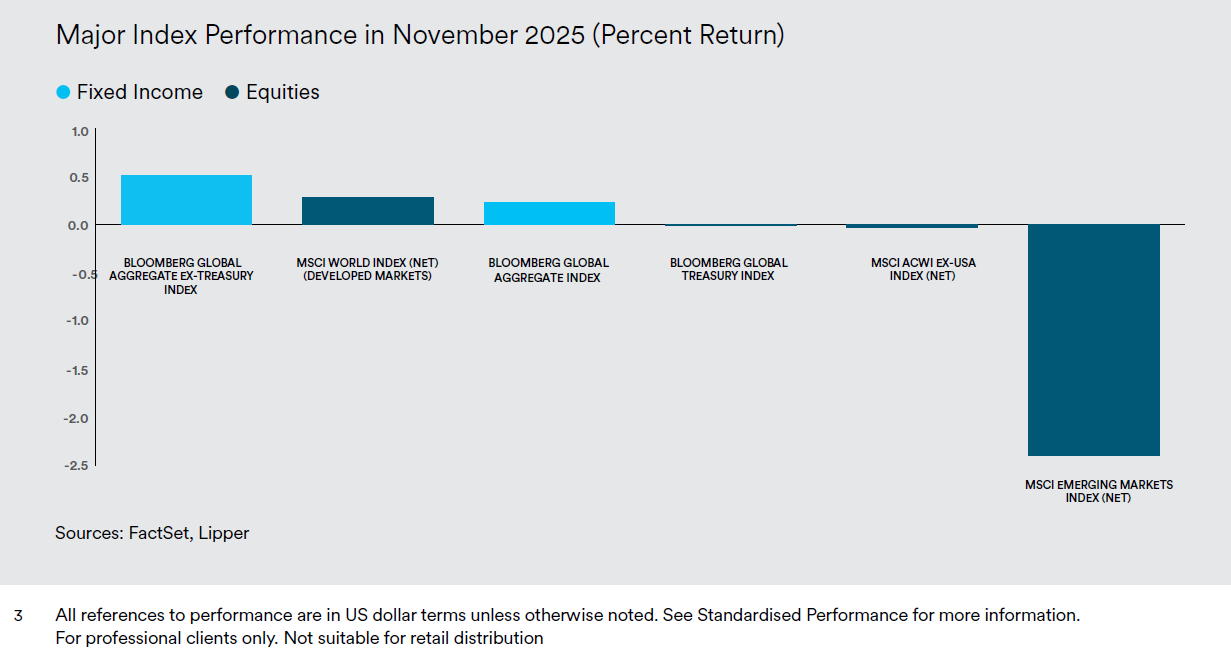
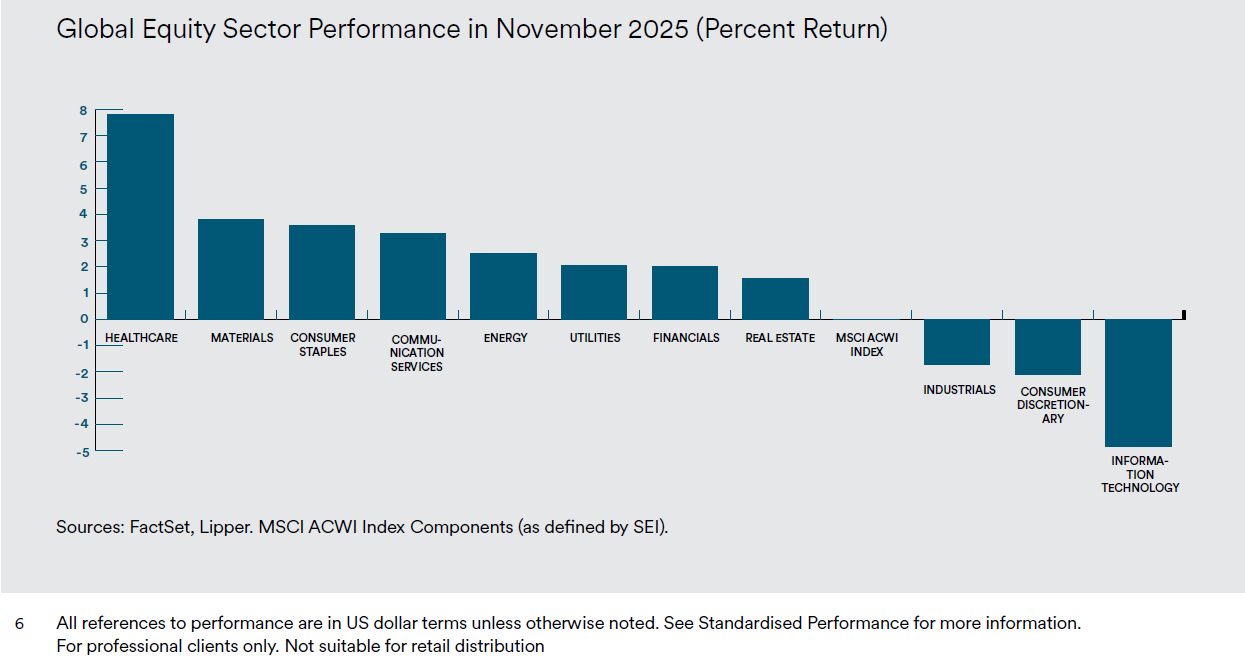
Global equities, as measured by the MSCI ACWI Index, were virtually flat in November 2025. Investors’ concerns about signs of slowing global economic growth and persistent inflation, as well as stretched valuations in the technology sector, particularly for artificial intelligence (AI)-related companies, offset optimism regarding relatively strong corporate earnings. Developed markets outperformed emerging markets for the month.
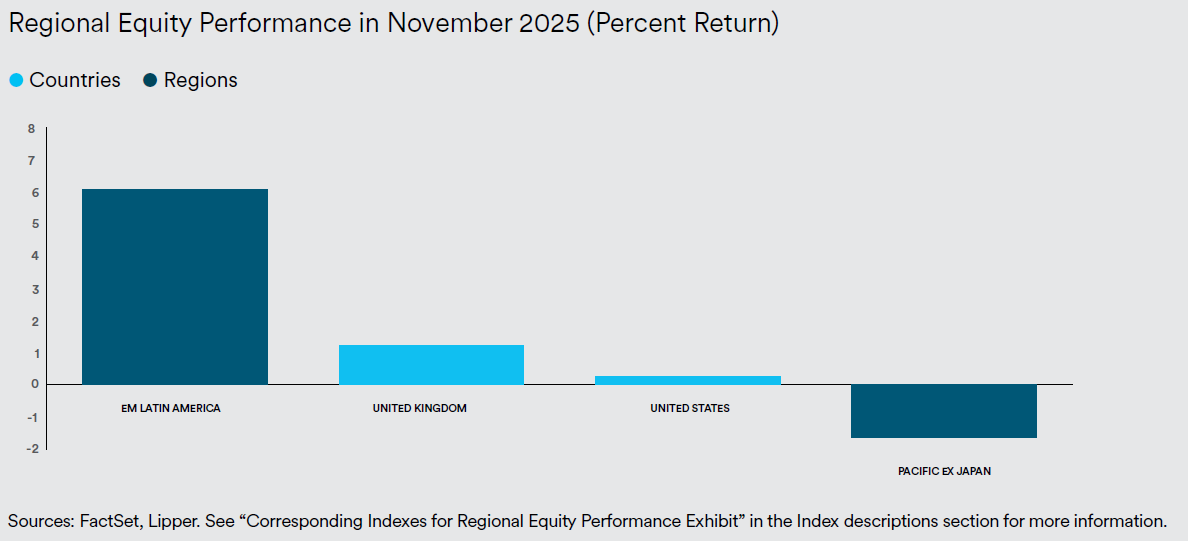
Europe was the strongest-performing region among the developed markets in November, bolstered by strength in Ireland, Belgium, and Switzerland. In contrast, the underperformance of both the Asia-Pacific ex Japan and Pacific regions resulted from a market downturn in Australia. The Far East region also lagged due to weakness in Japan. Latin America led the emerging markets in November due primarily to upturns in Chile, Brazil, and Colombia. Additionally, Europe benefited from strength in Hungary and Greece. The Gulf Cooperation Council (GCC) countries were the most notable laggards for the month, attributable mainly to market slumps in Saudi Arabia and the United Arab Emirates (UAE). The Far East also recorded a negative return for the month due to declines in Korea and Taiwan.1
Global fixed-income assets, as represented by the Bloomberg Global Aggregate Bond Index, edged up 0.2% (in U.S. dollars) in November. Mortgage-backed securities (MBS) led the U.S. fixed-income market, followed by U.S. Treasurys, high-yield bonds, and investment-grade corporate bonds. Treasury yields moved lower across the yield curve. Yields on 2-, 3-, 5-, and 10-year Treasury notes declined by corresponding margins of 0.13%, 0.11%, 0.12%, and 0.09%, ending the month at 3.47%, 3.49%, 3.59%, and 4.02%, respectively. The 10-year to 3-month yield curve narrowed by 8 basis points (0.08%) to +0.14% as of the November 28, the final trading day of the month.2
Global commodity prices, as measured by the Bloomberg Commodity Index, climbed 3.2% in November. The spot prices for West Texas Intermediate (WTI) and Brent crude oil fell 4.0% and 2.8%, respectively, over the month due to a proposed peace plan for the Russia-Ukraine conflict, which could increase exports from Russia, as well as softer demand. The 6.5% rise in the gold price in November resulted from increasing expectations of a Federal Reserve (Fed) interest-rate cut at its December meeting, along with sticky inflation and U.S. dollar weakness. (The gold price typically moves inversely to the U.S. dollar.) The New York Mercantile Exchange (NYMEX) natural gas price surged 11.0% during the month, benefiting from an anticipated increase in demand due to colder weather in the Midwestern and Eastern regions of the U.S., as well as a significant rise in U.S. liquefied natural gas (LNG) exports. The 0.8% upturn in the wheat price in November was attributable to the ongoing disruption of Black Sea wheat exports caused by the Russia-Ukraine war, along with weather-related issues, including heavy rain in China, and dry conditions in Southeast Europe, Australia, and the U.S.
On November 12, President Donald Trump signed a spending package to reopen the federal government after a 43-day shutdown—the longest in U.S. history—after the House of Representatives and Senate passed the legislation by votes of 222-209 and 60-40, respectively. The political dispute centered on the demand of the Democrats, who are the minority party in both houses of Congress, for an extension of the enhanced Affordable Care Act (ACA) health insurance subsidies enacted during the COVID-19 pandemic in 2021, and to restore the cuts to the Medicaid program mandated in the One Big Beautiful Bill Act, which Trump signed into law in July.
The agreement funds the government through January 30, 2026; provides full funding through the end of the fiscal year on September 30 for the Department of Agriculture, the legislative branch, and military construction; and guarantees the rehiring of furloughed workers and back pay for all federal employees. Furthermore, though the bill does not extend the ACA subsidies, the Senate pledged to hold a vote on the issue by mid-December.
There was an unexpected development regarding U.S. trade policy mid-month. The Trump administration reversed several tariffs that were previously imposed on food imports in an effort to cut costs for both consumers and businesses, and ease inflationary pressures in the food sector. The lower tariffs, which were applied retroactively to November 13, include beef, coffee, and more than 100 agricultural and food products. The lower levies apply to imports from all countries—not just those with trade deals. Several U.S.-based businesses have challenged the legality of the tariffs to the U.S. Supreme Court, which could issue a decision on the matter some time in December.
On the geopolitical front, in late November, the Trump administration announced a plan to end the Russia-Ukraine war, which began in February 2022. The plan would provide limited security guarantees for Ukraine, excluding direct military assistance. However, Ukraine would be required to cede the eastern Donbas region to Russia and accept Russia’s control over other contested regions. Additionally, the plan would limit Ukraine’s military forces to 600,000 members and bans Ukraine from joining the North Atlantic Treaty Organization (NATO), which provides security for its member nations.
Under the proposal, the U.S. would recognise Russia’s claims to certain Ukrainian territories; discuss the possibility of Russia rejoining the G8 (an intergovernmental organization comprising the world’s largest developed economies: France, Germany, Italy, Japan, the U.S., the U.K., Canada, and Russia); and the gradual lifting of sanctions that the U.S. and its allies have imposed on Russia.
Several days after the release of the peace plan, about which President Volodymyr Zelenskyy initially expressed significant concerns―particularly the territorial concessions and restrictions on the size of its military―it appeared that the Ukrainian government was amenable to the plan subject to working out certain details. However, the Russian government had not accepted the agreement by the end of November.
Economic data
U.S.
Following a delay due to the ongoing federal government shutdown, the Department of Labor released its inflation report for September. The consumer-price index (CPI) advanced 0.3% for the month, marginally lower than the 0.4% rise in August. Gasoline prices rose 4.1% and comprised the bulk of the upturn in the index for the month. Conversely, costs for utility gas service and electricity declined 1.2% and 0.5%, respectively, in September. The CPI advanced 3.0% year-over-year in September—modestly higher than the 2.9% rise in August but slightly below expectations. Utility gas service and electricity costs increased by corresponding margins of 11.7% and 5.1% over the previous 12-month period, while gasoline prices were down 0.5%. Core inflation, as measured by the CPI for all items less food and energy, rose 3.0% year-over-year in September, slightly lower than the 3.1% upturn in August. Prices for used cars and trucks, medical services, and housing increased 5.1%, 3.9%, and 3.6%, respectively, year-over-year.
The Commerce Department’s preliminary estimate of gross domestic product growth for the third quarter of this year, which was scheduled for release on October 30, was delayed indefinitely because of the government shutdown.
U.K.
According to the Office for National Statistics (ONS), inflation in the U.K., as measured by the CPI, rose 0.4% in October, up from the flat reading in September. The CPI advanced at an annual rate of 3.6% for the month, modestly lower than the 3.8% year over- year upturn in August. Prices for education, clothing and footwear, and housing and household services posted the largest gains in October, while communication and health costs declined. Education, alcohol and tobacco, and housing and household services prices climbed 7.6%, 5.9%, and 5.2%, respectively, over the previous 12-month period. Core inflation, as represented by the CPI excluding energy, food, alcohol, and tobacco, rose 3.4% year-over-year in October, inching down from the 3.5% annual increase in September.3
The ONS also announced that U.K. GDP increased 0.1% for the three-month period ending September 30 (the most recent reporting period), marginally lower than the 0.2% rise for the three-month period ending August 31. Output in the services and construction sectors ticked up 0.2% and 0.1%, respectively, over the most recent three-month period, while the production sector saw a 0.5% decrease.4

Eurozone
Eurostat pegged inflation for the eurozone at 2.1% for the 12-month period ending in October, slightly lower than the 2.2% increase in August. Costs in the services sector rose at an annual rate of 3.4% in October, up from the 3.2% advance in September. Prices for food, alcohol and tobacco increased 2,5% year-over-year in October versus the 3.0% annual upturn for the previous month, while energy prices declined 0.4% over the previous 12-month period. Core inflation, which excludes volatile energy, food, and alcohol and tobacco prices, rose at an annual rate of 2.4% in October, unchanged from the year-over-year increase in September.5
According to Eurostat’s initial estimate, eurozone GDP rose 0.2% in the third quarter—an uptick from the 0.1% growth rate for the second quarter of this year—and increased 1.4% over the previous 12-month period, down slightly from the 1.5% year-over-year increase in the second quarter. The economies of Sweden and Cyprus were the strongest performers for the third quarter, expanding 1.1% and 0.9%, respectively. In contrast, GDP for Lithuania and Romania each dipped by 0.2% during the quarter.6
SEI’s view
The recently ended U.S. government shutdown disrupted the flow of economic data, which has added to investor uncertainty. Economists have had to rely on alternative measures published by private trade groups and the regional Federal Reserve Banks. These surveys show some softening of labour markets and increasing stress among lower-income households. That stress now appears to be extending into the middle class. It’s something to watch carefully, but the overall economy still does not exhibit a recessionary character. The Trump administration is gradually releasing economic data reports that were delayed during the recent shutdown; however, the numbers have been outdated as the government works through a backlog.
The sharp appreciation in equities is bolstering the wealth of more affluent households while the boom in AI-related capital spending is contributing meaningfully to overall gross domestic product (GDP) growth. In SEI’s opinion, current Fed monetary policy is not tight and further rate cuts are on the horizon. It is clear that the central bank policymakers either believe that labour market conditions justify further easing despite elevated inflation or at least are taking a balanced view of the situation.
Canada’s economic growth is supported by consumer spending but hurt by U.S. tariffs. Growth in the U.K. and Europe remains sluggish. Accelerated productivity growth is the key to a more optimistic inflation outlook, but it will take time for new technologies to have a measurable impact.
While U.S. stocks have stumbled from their October highs, big technology names have registered a more substantial decline. U.S.-based chipmaker Nvidia’s blowout third-quarter earnings announcement was not enough to quell doubts around AI. Fortunately, there is no need to pile into the most expensive stocks when other parts of the market appear to be beneficiaries of the continuing economic expansion.
Growth and inflation expectations vary, but long-term fiscal stability is an issue of concern in the U.S., U.K., and Europe, with the possible exception of Germany. Politicians in the U.S. and France have opted to ignore the problem, unwilling to make tough choices on taxes and spending. The U.K. has tried to tax its way out of its fiscal difficulties, but that country seems to be on the wrong side of the “Laffer Curve”—tax revenue increases with higher tax rates, but only to a certain point, after which tax receipts actually decrease. The damage done to government fiscal positions by the global financial crisis of 2008-2009 and by the COVID-19 lockdowns have not been fully repaired.
Despite recent largely positive financial news, concerns over the long-term viability of the AI trade continue to weigh on markets. Heightened fragility, largely arising from concentration in the AI theme, isn’t helping. Diversification within equity markets remains our key call. Diversification by geography, by our preferred factors, by sector, by single names, and by theme, will help investors reduce their exposure to heightened market fragility. Active management also appears attractive here, particularly in U.S. large caps given the acute market concentration.
Glossary of Financial Terms
Yield is the income returned on an investment, such as the interest received from holding a security. The yield is usually expressed as an annual percentage rate based on the investment’s cost, current market value, or face value.
Yield curve represents differences in yields across a range of maturities of bonds of the same issuer or credit rating (which is used to assess the risk of default of companies or countries). A steeper yield curve represents a greater difference between the yields. A flatter curve indicates that short- and long-term yields are closer together.
The breakeven yield is the difference in yield between inflation-protected bonds and nominal debt of the same maturity.
Index definitions
All indexes are quoted in gross performance unless otherwise indicated.
The MSCI ACWI Index is a market capitalization-weighted index that tracks the performance of over 2,000 companies, and is representative of the market structure of 48 developed and emerging-market countries in North and South America, Europe, Africa, and the Pacific Rim. The index is calculated with net dividends reinvested in U.S. dollars.
The Bloomberg Global Aggregate Bond Index is a market capitalization-weighted index that tracks the performance of investment-grade (rated BBB- or higher by S&P Global Ratings/Fitch Ratings or Baa3 or higher by Moody’s Investors Service) fixed-income securities denominated in 13 currencies. The index reflects reinvestment of all distributions and changes in market prices.
The ICE BofA U.S. High Yield Constrained Index is a market value-weighted index of all domestic and Yankee high-yield bonds, including deferred interest bonds and payment-in-kind securities, with maturities of one year or more and a credit rating of BB+ or lower by S&P Global Ratings and Fitch Ratings or Ba1 or lower by Moody’s Investors Service, but are not in default.
The ICE BofA U.S. Corporate Index includes publicly issued, fixed-rate, nonconvertible investment-grade (rated BBB- or higher by S&P Global Ratings and Fitch Ratings or Baa3 or higher by Moody’s Investors Service) dollar-denominated, U.S. Securities and Exchange (SEC)-registered corporate debt having at least one year to maturity.
The S&P US Mortgage Backed Securities Index tracks the performance of U.S. dollardenominated, fixed-rate and adjustable-rate/hybrid mortgage pass-through securities issued by Ginnie Mae (GNMA), Fannie Mae (FNMA), and Freddie Mac (FHLMC).
The ICE BofA U.S. Treasury Index tracks the performance of the direct sovereign debt of the U. S. government.
The Bloomberg Commodity Index tracks the performance of futures contracts on physical commodities. The index comprises 24 of the most traded commodity futures contracts across six sectors.
Consumer-price indexes measure changes in the price level of a weighted-average market basket of consumer goods and services purchased by households. A consumer price index is a statistical estimate constructed using the prices of a sample of representative items whose prices are collected periodically.
IMPORTANT INFORMATION
This material represents an assessment of the market environment at a specific point in time and is not intended to be a forecast of future events or a guarantee of future results. Positioning and holdings are subject to change. All information as of the date indicated.
This information should not be relied upon by the reader as research or investment advice, (unless you have otherwise separately entered into a written agreement with SEI for the provision of investment advice) nor should it be construed as a recommendation to purchase or sell a security. The reader should consult with their financial professional for more information. Statements that are not factual in nature, including opinions, projections and estimates, assume certain economic conditions and industry developments and constitute only current opinions that are subject to change without notice. Nothing herein is intended to be a forecast of future events, or a guarantee of future results.
Certain economic and market information contained herein has been obtained from published sources prepared by other parties, which in certain cases have not been updated through the date hereof. While such sources are believed to be reliable, neither SEI nor its affiliates assumes any responsibility for the accuracy or completeness of such information and such information has not been independently verified by SEI.
There are risks involved with investing, including loss of principal.The value of an investment and any income from it can go down as well as up. Investors may get back less than the original amount invested. Returns may increase or decrease as a result of currency fluctuations. Past performance is not a reliable indicator of future results. Investment may not be suitable for everyone.
This material is not directed to any persons where (by reason of that person's nationality, residence or otherwise) the publication or availability of this material is prohibited. Persons in respect of whom such prohibitions apply must not rely on this information in any respect whatsoever.
The information contained herein is for general and educational information purposes only and is not intended to constitute legal, tax, accounting, securities, research or investment advice regarding the strategies or any security in particular, nor an opinion regarding the appropriateness of any investment. This information should not be construed as a recommendation to purchase or sell a security, derivative or futures contract. You should not act or rely on the information contained herein without obtaining specific legal, tax, accounting and investment advice from an investment professional. While considerable care has been taken to ensure the information contained within this document is accurate and up-to-date, no warranty is given as to the accuracy or completeness of any information and no liability is accepted for any errors or omissions in such information or any action taken on the basis of this information.
Index returns are for illustrative purposes only, and do not represent actual account performance. Index returns do not reflect any management fees, transaction costs or expenses. Indexes are unmanaged and one cannot invest directly in an index. Not all strategies discussed may be available for your investment.
Information issued in the UK by SEI Investments (Europe) Ltd, 1st Floor, Alphabeta, 14-18 Finsbury Square, London EC2A 1BR which is authorised and regulated by the Financial Conduct Authority.
The contents of this document have not been reviewed by any regulatory authority in Hong Kong. You are advised to exercise caution in relation to the offer. If you are in any doubt about any of the contents of this document, you should obtain independent professional advice.
This information is made available in Latin America and the Middle East FOR PROFESSIONAL (non-retail) USE ONLY by SIEL.
Any questions you may have in relation to its contents should solely be directed to your Distributor. If you do not know who your Distributor is, then you cannot rely on any part of this document in any respect whatsoever.
Issued in South Africa by SEI Investment (South Africa) (Pty) Limited FSP No. 13186 which is a financial services provider authorised and regulated by the Financial Sector Conduct Authority (FSCA). Registered office: 3 Melrose Boulevard, 1st Floor, Melrose Arch 2196, Johannesburg, South Africa.
SIEL is not licensed under Israel’s Regulation of Investment Advising, Investment Marketing and Portfolio Management Law, 5755-1995 (the “Advice Law”) and does not carry insurance pursuant to the Advice Law.
This document and any of the SEI Funds mentioned herein have not been approved by the Israeli Securities Authority (the “ISA”). This material is intended for information purposes only and the information in it does not constitute financial advice as contemplated in terms of the Financial Advisory and Intermediary Services Act.
For professional clients only. Not suitable for retail distribution.


