Tech volatility: Software, the Mag 7, and crypto.
The last few weeks have demonstrated that volatility doesn’t always come all at once. Sometimes it comes in waves without a clean narrative to tie it together: software gets hit, then it’s the megacap artificial-intelligence (AI) complex’s turn, and all the while cryptocurrency (crypto) is down sharply. Big moves, sudden reversals, and quickly shifting correlations—this is what a high-volatility environment can look like. In this piece, we examine what’s been happening across software as a service (SaaS) companies, the Magnificent 7, and crypto, and why the volatility is likely to continue.
Software: It’s the business model, not the quarter
One reason the recent drawdown in software shares has felt unusually severe is because it wasn’t a reaction to near-term earnings misses. The launches of Anthropic’s Claude Cowork, open-source OpenClaw, OpenAI’s Codex, and agentic plugins were a potential catalyst, reigniting a debate over whether AI agents could reduce the need for traditional per-seat software licenses. If workflows that used to require teams of people can be automated, it naturally raises concerns about the existing business model; fewer people translates to fewer seats, putting pressure on profitability. Similar to their historical move from license-based pricing to seat-based pricing, software companies will need to shift from seat-based pricing to outcome- or usage-based (consumption) pricing (i.e., charging by the number of AI conversations).
Software companies are making the shift (e.g., Salesforce’s Agentforce), but there are also more structural concerns: if AI agents interact with software more than humans, the interface potentially matters less. Should this occur and well-designed front ends matter less, this could raise the risk of commoditization and make it easier for firms to build certain tools in-house using AI coding. Exhibit 1 highlights how software company valuations have improved and are potentially closer to fair value (though if margins compress, these valuations are likely still too high).
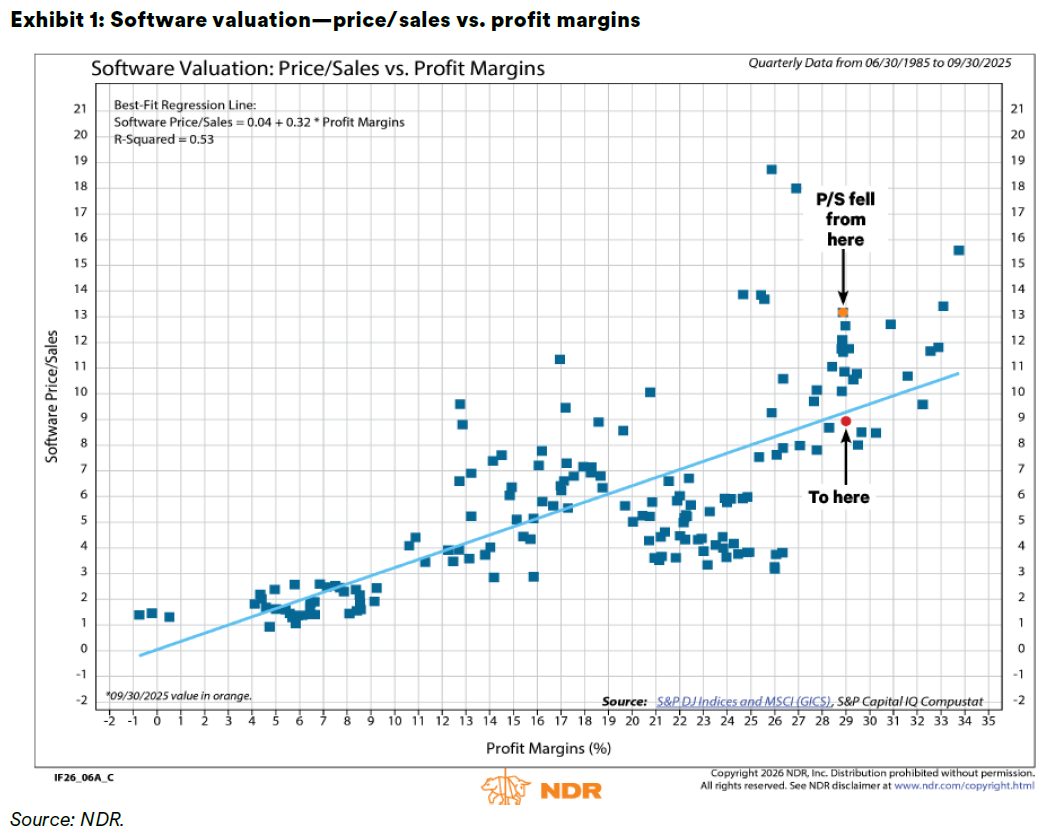
According to Ned Davis Research, “No software stock has escaped the selloff unscathed. As of February 9, 100% of the industry’s constituents were in drawdowns of at least 20% from their 52-week highs. Almost 80% of the industry experienced a drawdown greater than 30%. The reading is the highest on record that has not been associated with an equity cyclical bear market.”1 This level of indiscriminate selling leads to environments where active managers’ ability to distinguish winners from losers can drive meaningful outperformance.
Big tech, AI, and the Mag 7: The market is asking a new question
For the last decade, megacap tech was often viewed as generating massive free cash flow that could fund innovation and still return capital to shareholders. However, as more free cash flow moves toward research and development (R&D) spending and capital expenditures (capex) on chips and data centers, the buyback impulse can weaken, potentially contributing to volatility, as buybacks have historically been a volatility dampener.
The question on investors’ minds regarding AI seems to be turning from “How big can AI get?” to “How efficiently can AI-related spending turn into durable profit?” This transition is one reason megacap leadership can feel less stable these days.
When we look at the Magnificent 7 and the S&P 42 (42 stocks selected by JPMorgan Asset Management driving the bulk of the S&P 500 Index’s AI-related earnings and infrastructure growth), we see that R&D spending as a percentage of total S&P 500 R&D spend is high and increasing, as well as capex. The S&P 42 is expected to represent over 60% of R&D spending by 2027, over 50% of S&P 500 capex, and 33% of all S&P 500 Index free cash flow.
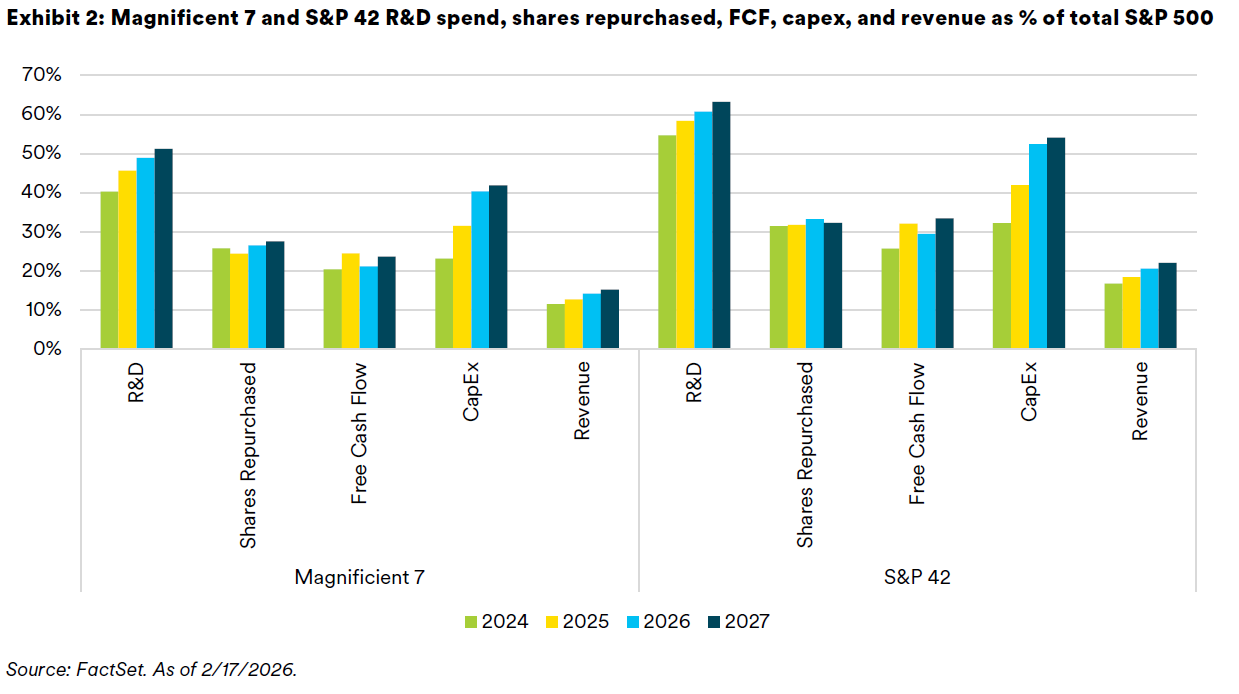
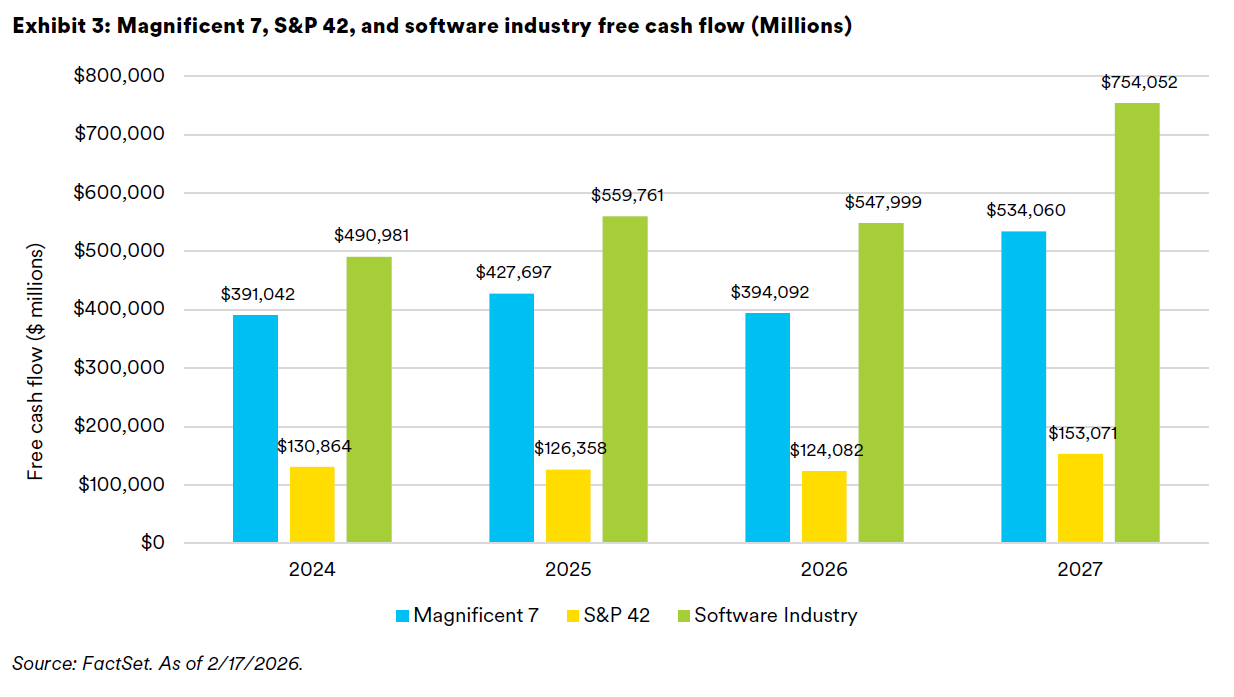
We also see that expected free cash flow is flat-to-decreasing across these different slices of the market in 2026 compared to 2025, implying increased spending on R&D and capex. However, we also see massive jumps in expectations for free cash flow in 2027, likely due to high expectations of profitability of the R&D (and necessary capex) buildouts of 2025 and 2026.
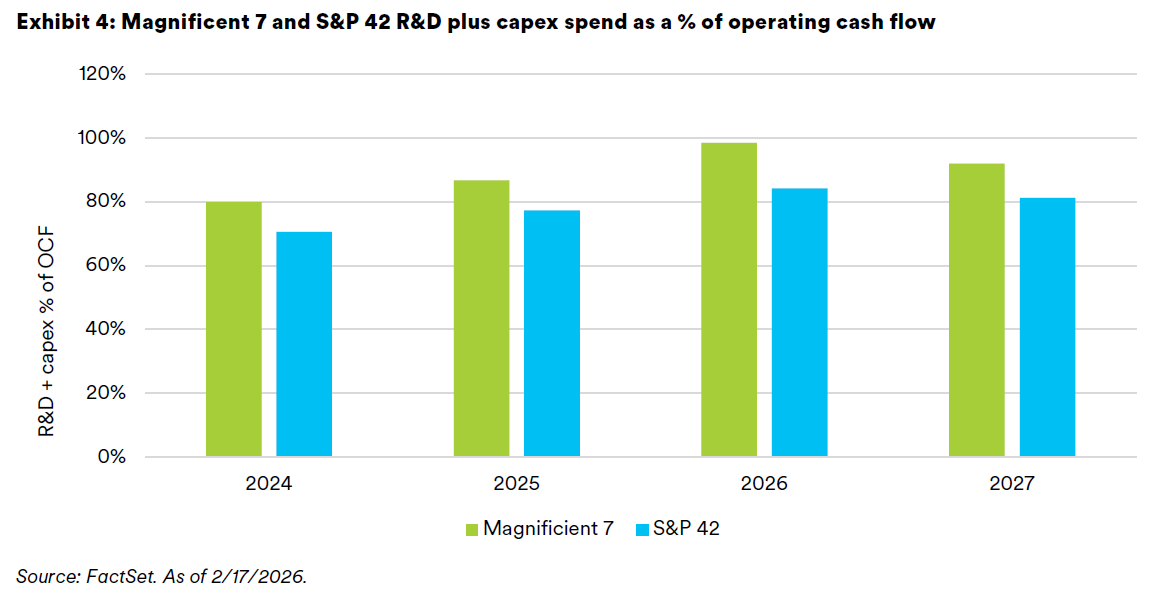
The so-called investment impulse, which effectively measures the degree to which a company reinvests cash from operations into R&D and capex, is increasing and expected to peak in 2026 as demand to build out the necessary research and infrastructure for AI-related investments continues. We see the investment impulse of the Magnificent 7 approaching 100% in 2026.
With the increased demand for R&D and capex from AI-related themes, will companies scale back discretionary stock repurchases or continue to tap debt markets2 and off-balance sheet financing arrangements? Either outcome could lead to higher volatility across markets.
Crypto: Leverage, liquidity, and access
This most recent drawdown in crypto assets has accompanied another deleveraging event, with the first week in February experiencing roughly $3-$4 billion of liquidations. Bitcoin open interest fell over 20% from $61 billion at the end of January 2026 to $49 billion as of February 53. In addition, as bitcoin miners face tightening financial conditions, they face pressure to sell bitcoin to support their balance sheets, usually at times of already high selling pressure and deleveraging. Digital asset treasury (DAT) companies (e.g., Strategy, formerly known as MicroStrategy) find themselves trading at or below mNAV (market to net asset value), meaning they can no longer continue to put buying pressure on crypto by selling their stock above its NAV. Quantum computing also poses a threat to bitcoin, adding another front to the fear narrative.
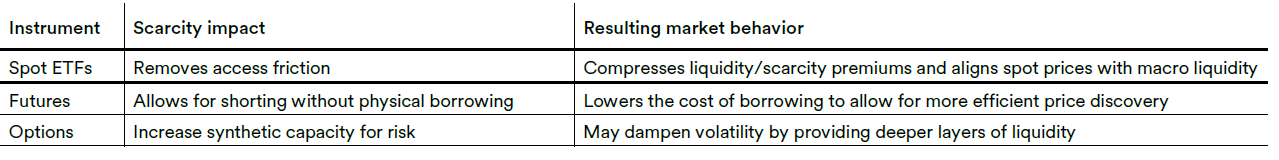
Crypto’s market structure is also changing. As crypto becomes easier to access (and hedge), the asset can lose part of its scarcity premium4 over time―not due to a reduction in scarcity, but because it becomes easier to express exposure through more wrappers (spot products like ETFs, futures, and options). This dynamic can pull crypto prices closer to broader macro liquidity conditions and, in certain periods, make crypto behave more like a high-beta risk asset than a standalone diversifier. As access improves, the scarcity premium can compress and price behavior begins to track broader liquidity conditions more closely. More institutional access doesn’t always translate into less volatility; sometimes it means more ways to buy and sell quickly, with leverage, which can amplify moves in both directions. Access can reduce structural premia while increasing short-horizon flow sensitivity. The table below highlights how different structures can affect market behavior.
2 https://www.seic.com/sites/default/files/2025-12/SEI_big_techs_ai_debt_US_2025.pdf
3 https://www.vaneck.com/us/en/blogs/digital-assets/matthew-sigel-what-triggered-bitcoins-major-selloff-in-february-2026/
4 https://snehalbanerjee.github.io/papers/BanerjeeGraveline2014.pdf
Scarcity impact and resulting market behavior by instrument
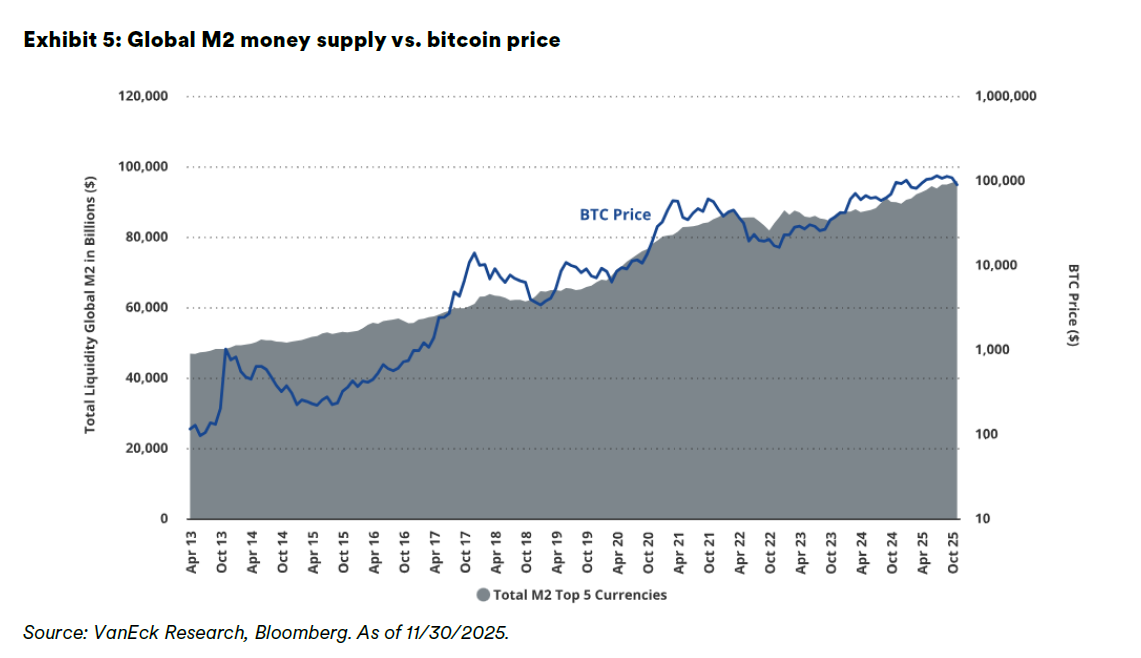
VanEck’s Digital Asset Research team has been focused on bitcoin as a “liquidity sponge,” finding that changes in global M2 money supply explain some of bitcoin’s price variance.5 Easier access and fewer restrictions allow investors to take increasingly risky bets in bitcoin and other crypto assets as liquidity in markets increases.
Markets feel jumpy: Positioning and risk controls
In markets where some participants have elevated leverage and tight risk controls, the marginal seller isn’t always the long-term investor. The price-setter in these markets may be fast-moving professional managers such as multi-manager pod shops with low net exposure, high gross exposure, and strict top-level risk limits. As illustrated in the chart below, gross leverage in the hedge fund industry is near all-time highs, while net leverage has been increasing recently.
https://www.vaneck.com/us/en/blogs/digital-assets/matthew-sigel-vaneck-bitcoin-long-term-capital-market-assumptions/
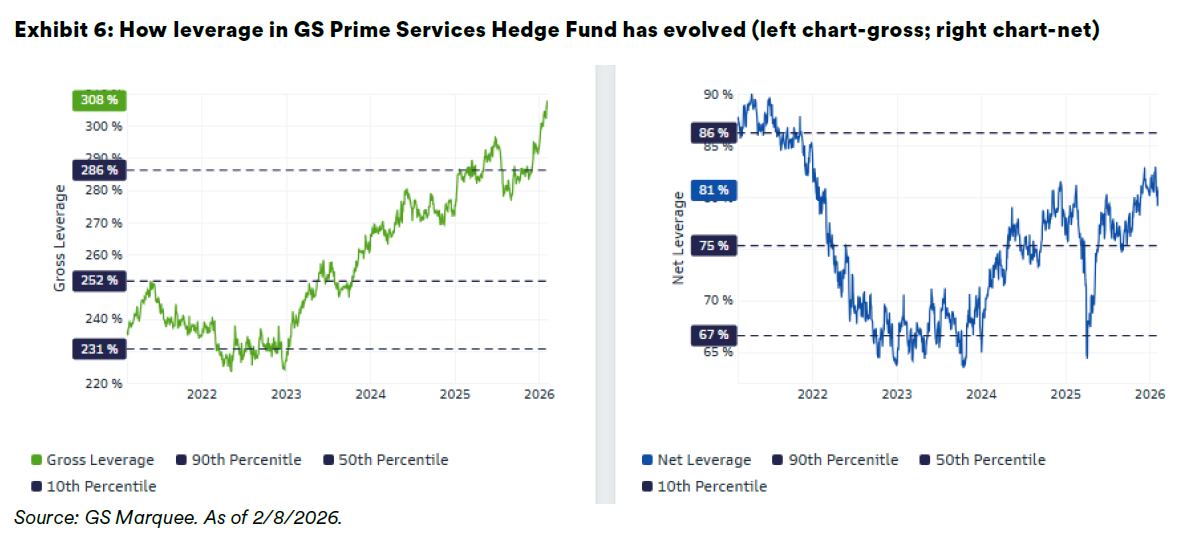
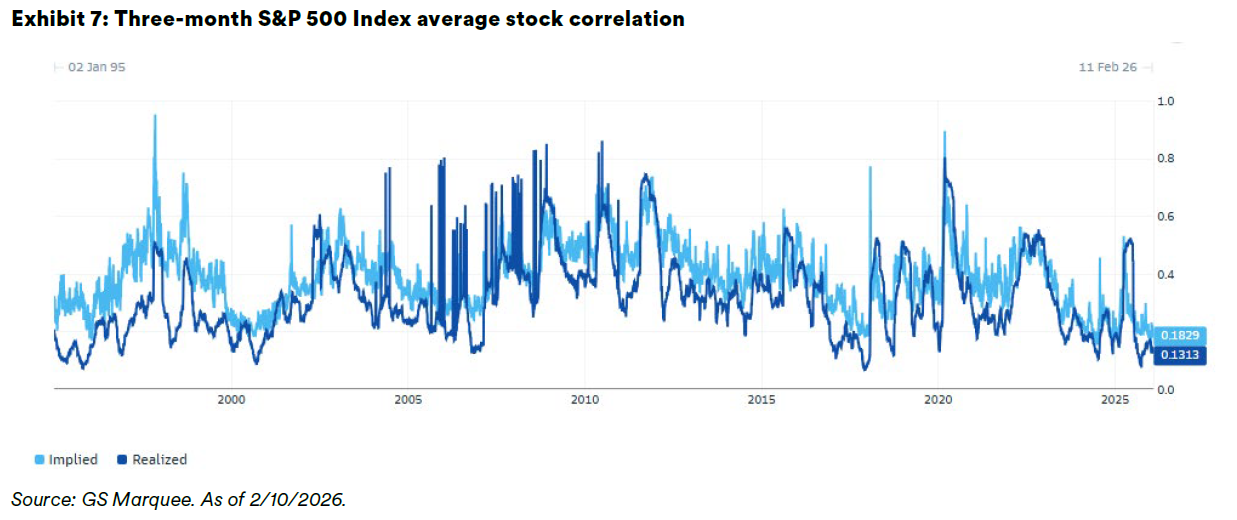
Increased gross exposure means higher degrees of leverage, while increased net exposure means higher degrees of directionally long risk. When volatility rises, triggering risk limits, the alpha trades at these pod shops can unwind quickly. The higher the leverage, the quicker the unwind. The more directionally long the leverage (higher net exposure), the sooner risk limits will be hit when markets start to draw down. Since the alpha trades at these pod shops tend to have low correlation with the general market, even during de-risking, these unwinds can create sharp moves without correlations going to 1 (i.e., perfect positive correlation). Correlations, especially intra-equity correlations (e.g., stock-to-stock in the S&P 500 Index), often spike amid large drawdowns. However, as Exhibit 7 highlights, the most recent selloff did not lead to a spike in correlations (implied or realized).
In this kind of market, flows can move prices faster than fundamentals, and the unwinding of relatively uncorrelated alpha trades can drive these flows.
Bringing it together: What the cross-asset charts are saying
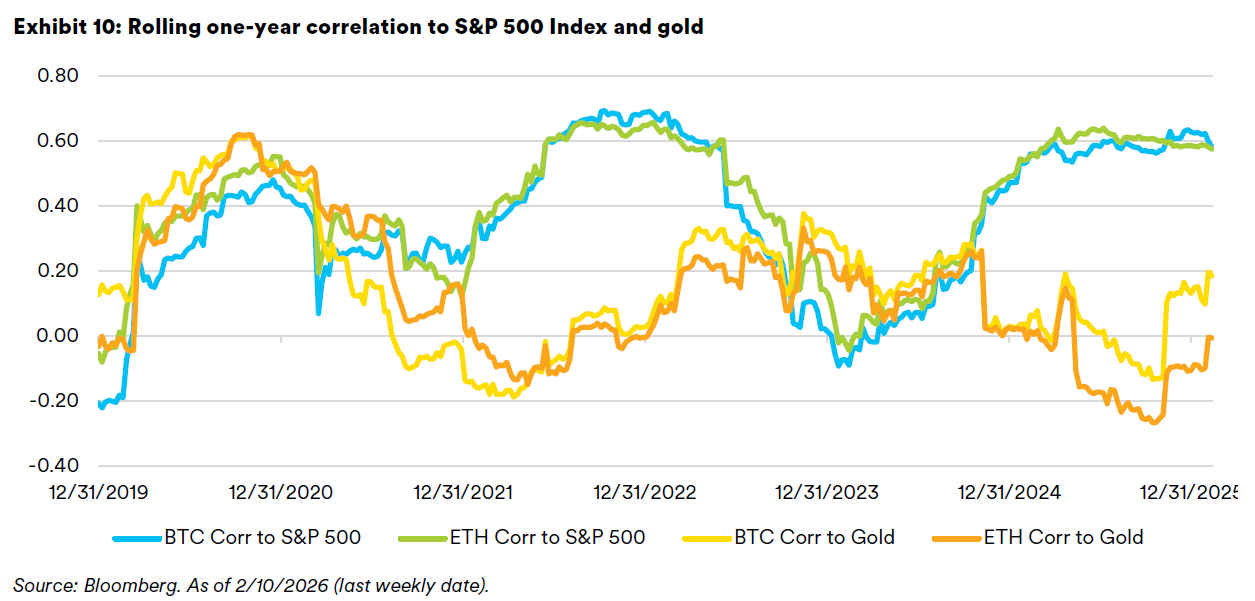
As market participants tend to own more assets, and similar assets at that (e.g., both crypto and equity), cross-asset correlations may increase. This is especially true as cross-margining allows crypto to be used as collateral for traditional asset leverage and vice versa, and professional money managers’ alpha opportunities include more esoteric strategies like crypto.
In periods of market stress, different assets can move in the same direction even when the underlying causes differ. It’s worth noting the severity of the drawdown of the two largest crypto assets by market capitalization relative to public U.S. equities.
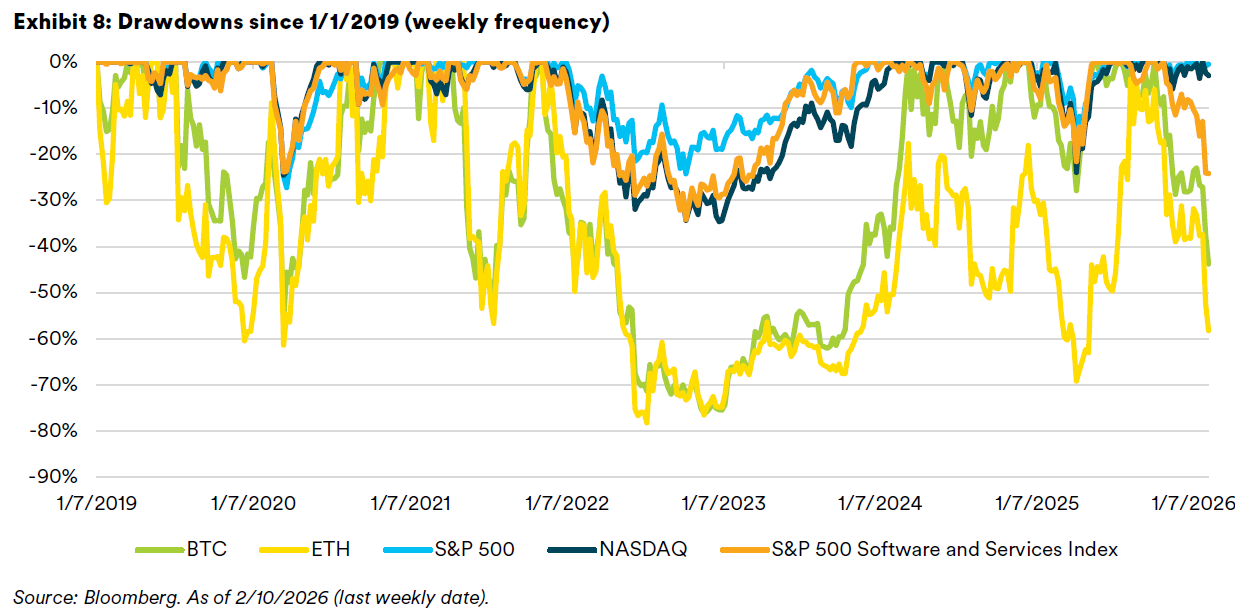
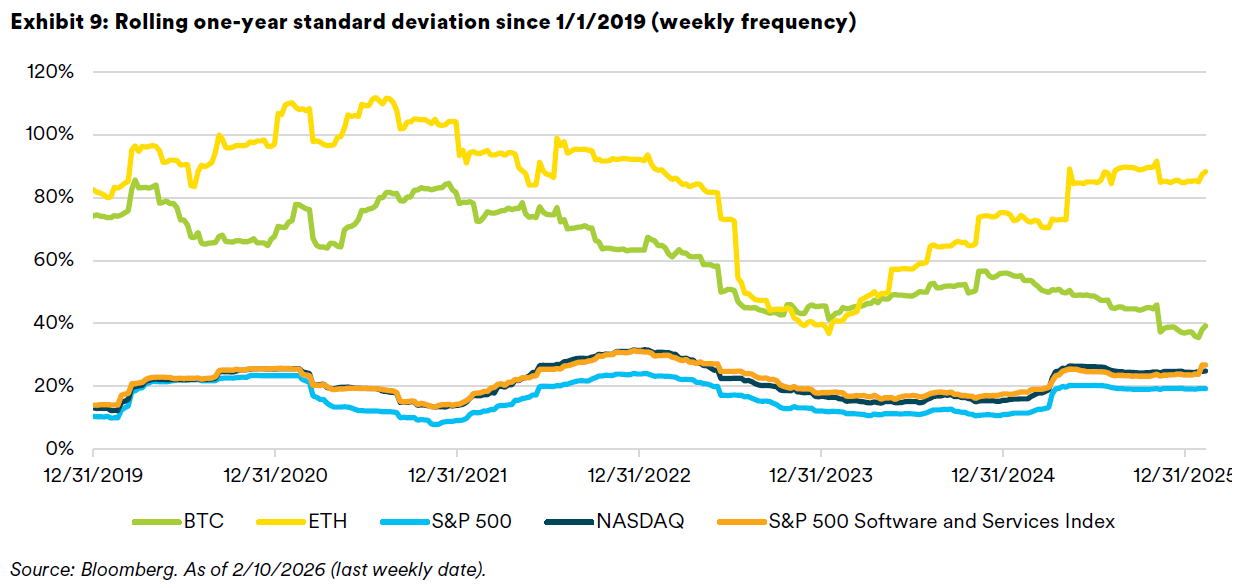
Volatility tends to cluster with big moves, leading to more big moves. Note that the two largest crypto assets have historical standard deviations two to five times those of publicly traded U.S. equities.
Diversification can be conditional. When correlations rise, the expected diversification benefits of less-correlated assets shrink. There are times when crypto assets such as bitcoin and ether are highly correlated to U.S. large-cap equities. Meanwhile, the narrative around bitcoin being digital gold has not held up empirically over the past couple years.
Three things we’re watching
- Software narrative: Margin story vs. adaptation story. Valuations are more reasonable if margins hold, but margin compression could change the math.
- Megacap cash allocation: Buybacks vs. buildout. If more cash shifts to capex/R&D, markets may need to reprice AI-adjacent stocks’ volatility profiles, even if the long-term AI opportunity remains vast.
- Increasing crypto access: Idiosyncratic risk vs. proxy for macro liquidity conditions. Crypto’s returns are likely driven by both. As access/hedging tools expand, crypto can trade more tightly to broader risk appetite and general liquidity dynamics.
This is a market where price action is being driven as much by positioning, risk limits, and fast narrative shifts as fundamentals. That can feel uncomfortable, but when an entire sector like software sells off, it also has the potential to create opportunities for active managers to distinguish between winners and losers. We believe that investors should stay disciplined, diversify thoughtfully, and avoid making decisions based on short-term noise.
IMPORTANT INFORMATION
This material represents an assessment of the market environment at a specific point in time and is not intended to be a forecast of future events or a guarantee of future results. All information as of the date indicated. There are risks involved with investing, including possible loss of principal. This information should not be relied upon by the reader as research or investment advice, (unless you have otherwise separately entered into a written agreement with SEI for the provision of investment advice) nor should it be construed as a recommendation to purchase or sell a security. The reader should consult with their financial professional for more information.
Statements that are not factual in nature, including opinions, projections and estimates, assume certain economic conditions and industry developments and constitute only current opinions that are subject to change without notice. Nothing herein is intended to be a forecast of future events, or a guarantee of future results.
Certain economic and market information contained herein has been obtained from published sources prepared by other parties, which in certain cases have not been updated through the date hereof. While such sources are believed to be reliable, neither SEI nor its affiliates assumes any responsibility for the accuracy or completeness of such information and such information has not been independently verified by SEI.
Index returns are for illustrative purposes only, and do not represent actual performance of an SEI Fund. Index returns do not reflect any management fees, transaction costs or expenses. Indexes are unmanaged and one cannot invest directly in an index. Past performance does not guarantee future results.
There are risks involved with investing, including loss of principal. The value of an investment and any income from it can go down as well as up. Investors may get back less than the original amount invested. Returns may increase or decrease as a result of currency fluctuations. Past performance is not a reliable indicator of future results. Investment may not be suitable for everyone. Diversification may not protect against market risk.
This material is not directed to any persons where (by reason of that person's nationality, residence or otherwise) the publication or availability of this material is prohibited. Persons in respect of whom such prohibitions apply must not rely on this information in any respect whatsoever.
The information contained herein is for general and educational information purposes only and is not intended to constitute legal, tax, accounting, securities, research or investment advice regarding the strategies or any security in particular, nor an opinion regarding the appropriateness of any investment. This information should not be construed as a recommendation to purchase or sell a security, derivative or futures contract. You should not act or rely on the information contained herein without obtaining specific legal, tax, accounting and investment advice from an investment professional.
Information in the U.S. is provided by SEI Investments Management Corporation (SIMC), a wholly owned subsidiary of SEI Investments Company (SEI).
SEI Investments Canada Company, a wholly owned subsidiary of SEI Investments Company, is the investment fund manager and portfolio manager of the SEI Funds in Canada.
Information issued in the UK by SEI Investments (Europe) Limited, 1st Floor, Alphabeta, 14-18 Finsbury Square, London EC2A 1BR which is authorised and regulated by the Financial Conduct Authority. Investments in SEI Funds are generally medium- to long-term investments.
This document has not been registered by the Registrar of Companies in Hong Kong. In addition, this document may not be issued or possessed for the purposes of issue, whether in Hong Kong or elsewhere, and the Shares may not be disposed of to any person unless such person is outside Hong Kong, such person is a “professional investor” as defined in the Ordinance and any rules made under the Ordinance or as otherwise may be permitted by the Ordinance.
The contents of this document have not been reviewed by any regulatory authority in Hong Kong. You are advised to exercise caution in relation to the offer. If you are in any doubt about any of the contents of this document, you should obtain independent professional advice.
This information is made available in Latin America and the Middle East FOR PROFESSIONAL (non-retail) USE ONLY by SIEL.
Any questions you may have in relation to its contents should solely be directed to your Distributor. If you do not know who your Distributor is, then you cannot rely on any part of this document in any respect whatsoever.
Issued in South Africa by SEI Investment (South Africa) (Pty) Limited FSP No. 13186 which is a financial services provider authorised and regulated by the Financial Sector Conduct Authority (FSCA). Registered office: 3 Melrose Boulevard, 1st Floor, Melrose Arch 2196, Johannesburg, South Africa.
SIEL is not licensed under Israel’s Regulation of Investment Advising, Investment Marketing and Portfolio Management Law, 5755-1995 (the “Advice Law”) and does not carry insurance pursuant to the Advice Law. No action has been or will be taken in Israel that would permit a public offering or distribution of the SEI Funds mentioned in this email to the public in Israel. This document and any of the SEI Funds mentioned herein have not been approved by the Israeli Securities Authority (the “ISA”).


