High yield bonds: Resilient in the face of rising interest rates.
The effects of higher yields have rippled through all corners of the bond market as investors face the prospect of additional Federal Reserve (Fed) interest persistent inflation, and rate hikes, ever increasing funding demands for the AI buildout. Since yields and prices move inversely, this yields had a negative impact on fixed shift in income performance in the third quarter of 2026.
However, bond markets aren’t homogen eous, and some areas have fared better than others. Notably, through early October, the high - yield segment (represented by ICE BofA U.S. High Yield Constrained Index ) has been able to offset much of the pressure from rising U.S. Treasury yields.
High yield has benefited from:
• Relatively higher income and shorter maturities , making it less sensitive to interest -rate moves.
• Improved credit quality.
• Strong corporate fundamentals.
Let’s take a deeper look.
High yield has held up despite higher rates
Higher U.S. Treasury yields have lifted yields across the bond market, including the high-yield segment. Meanwhile, high-yield credit spreads (the difference between non-government and government yields for bonds of similar maturities) have remained contained. This suggests that the increase in yield primarily reflects higher risk-free rates rather than a broad deterioration in corporate credit conditions.
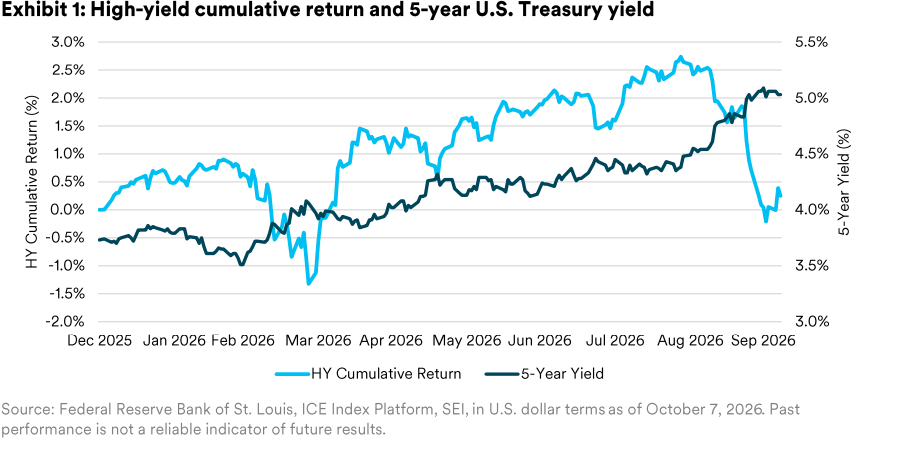
Because of their shorter maturities and higher coupons, high-yield bonds also tend to have less interest-rate sensitivity than investment-grade bonds. Together, these characteristics have helped high yield hold up relatively well as Treasury yields have risen. As seen in Exhibit 1, yields on the 5-year U.S. Treasury note have jumped a whopping 130 basis points (bps), or 1.3% points, in 2026. A move like th is often results in negative returns for bonds. While it’s been a bumpy ride , high yield has held up—with essentially flat returns year-to-date.
Higher- quality high yield
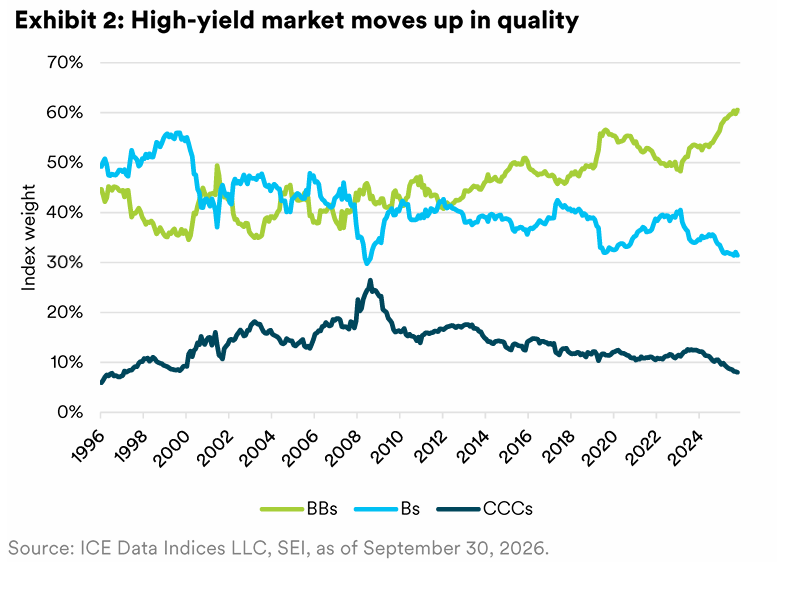
The high -yield market has changed considerably over time. BB rated bonds, the highest -quality segment of high yield, represent an all -time high share of the index. At the same time, CCC rated bonds, which generally carry the greatest default risk, account for their lowest share since December 1997.
This improved quality mix does not eliminate issuer -specific risk, but it could make the broader market more resilient during periods of slower growth or elevated borrowing costs. It also means that today’s high -yield market is different from the lower -quality “junk bond” market many investors may associate with previous credit cycles.
Corporate fundamentals remain supportive
High-yield companies generally entered the current period of elevated rates with healthy balance sheets. Earnings and cash flows have helped issuers manage higher borrowing costs, while many companies used earlier periods of favorable market conditions to refinance debt and extend maturities. This has reduced near-term refinancing pressure and given borrowers more time to adjust should rates remain elevated.
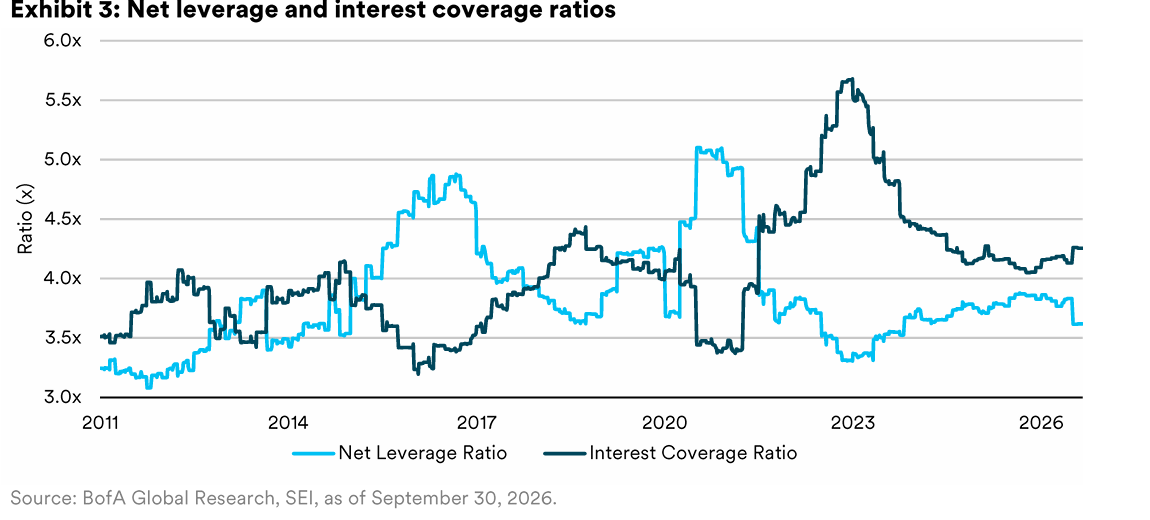
As of September 30, 2026, net leverage had declined by 0.26x from a year earlier to 3.62x, below its long-term average (February 2011 to September 2026) of 3.86x. Interest coverage had improved by 0.17x to 4.26x, modestly above its long-term average of 4.04x . These measures do not indicate broad balance-sheet stress. However, interest coverage has declined from unusually strong post-pandemic levels, making future earnings and cash-flow trends increasingly important .
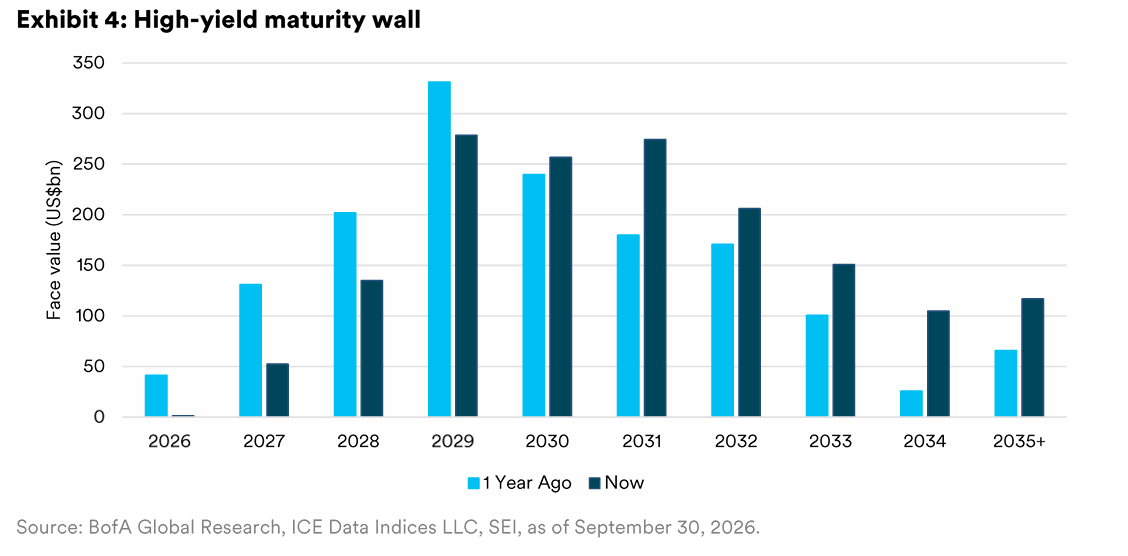
Near-term refinancing risk has declined as high-yield issuers have extended their maturity profiles , highlighted in Exhibit 4 . While this provides issuers with more breathing room today, much of the debt has been extended rather than paid down.
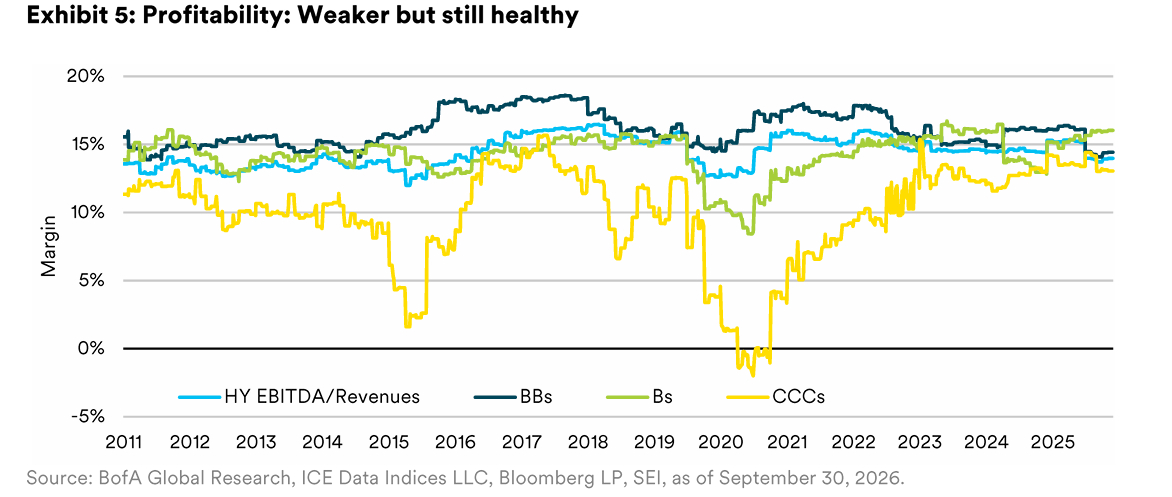
Overall high-yield profitability weakened modestly, with the aggregate EBITDA (earnings before interest, taxes, depreciation, and amortization) margin declining to 14.0% from 14.3% a year earlier. Results varied considerably by rating, however, as margins improved among B rated issuers but declined among BB rated issuers. This divergence reinforces the importance of issuer selection even when broader fundamentals remain healthy .
Defaults remain contained
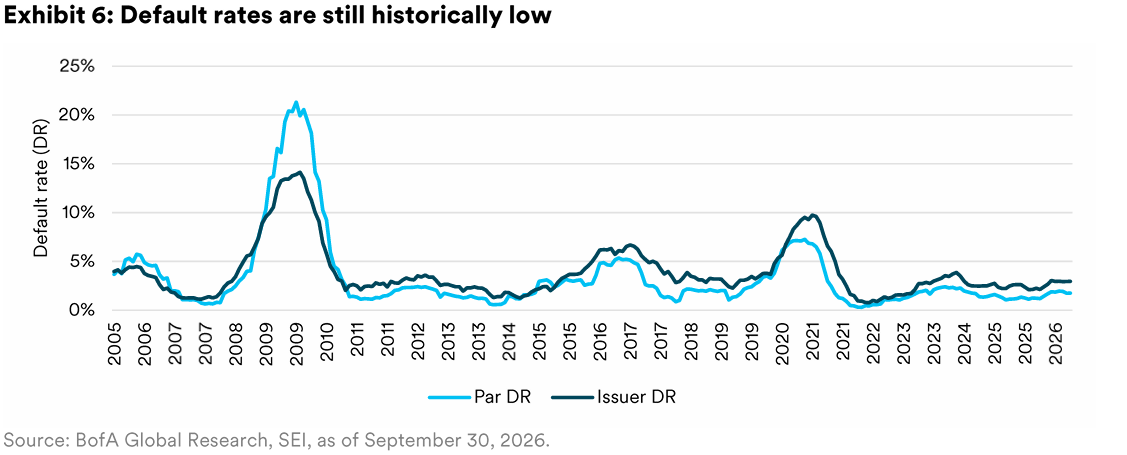
Defaults are a normal feature of the high-yield market, particularly among lower-rated borrowers. The more important question is whether stress remains issuer-specific or spreads across the broader market .
As of September 30, 2026 , the trailing twelve-month default rate increased from 1.25% to 1.75% on a par-weighted basis , and from 2.37% to 2.95% on an issuer-weighted basis. Both remained below their respective long-term averages (November 2005 to September 2026) of 3.38% and 3.87% . Exhibit 6 shows how defaults have edged up from low levels, but their current level and concentration are more consistent with selective issuer stress than a broad default cycle. The market’s improved credit quality mix should also help limit the effect of individual defaults on the overall index.
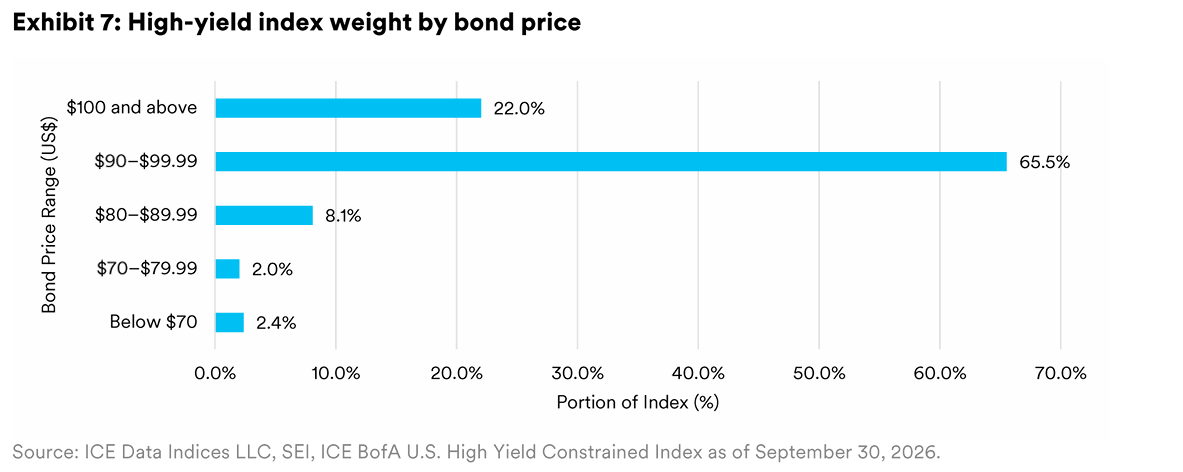
As highlighted in Exhibit 7, t he ICE BofA U.S. High Yield Constrained Index is concentrated near par, with 65.5% of market value priced between US$90 and US$99.99 and another 22.0% priced at US$100 or above. Only 12.5% of the index’s market value trades below US$90, suggesting limited exposure to deeply discounted bonds , which are at greater risk of default.
What are the challenges?
SEI believes the primary risk is that interest rates stay elevated as economic growth and corporate earnings weaken , leaving companies with higher borrowing costs while cash flows come under pressure.
That combination could produce wider spreads, weaker bond prices, and higher defaults — particularly among lower-quality issuers. Refinancing risk would also become more significant as borrowers approach maturity and must replace existing debt at higher rates .
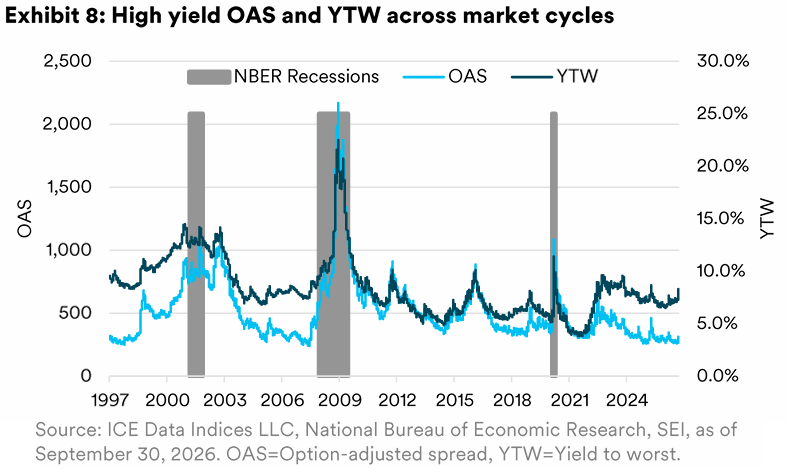
History shows that these risks become more pronounced when tighter financial conditions coincide with economic weakness , as high-yield credit spreads typically widen during periods of economic stress. As shown in Exhibit 8, t he average OAS was approximately 847 bps from March through November 2001, 1,132 bps from December 2007 through June 2009, and 666 bps from February through April 2020, i llustrating how the severity and duration of each downturn affected credit-market risk premiums.
SEI’s view
High yield has remained resilient despite higher Treasury yields, supported by income generation, improved credit quality, and generally healthy corporate fundamentals . Defaults have increased from low levels but remain below their long-term averages and are concentrated among weaker borrowers .
Risks would rise if elevated borrowing costs were accompanied by weaker growth and earnings. For now, the market’s higher starting yield and stronger credit composition provide a meaningful cushion.
SEI continues to seek improved credit quality by reducing our exposure to CCC rated securities. We maintain an allocation to floating-rate bank loans, which provides diversification and further reduces interest-rate sensitivity. With valuations providing less room for error, we remain focused on security selection rather than broadly increasing credit risk, while seeking to maintain a yield advantage relative to the benchmark .
GLOSSARY AND INDEX DEFINITIONS
For financial term and index definitions, please see: https://www.seic.com/ent/imu-communications-financial-glossary
IMPORTANT INFORMATION
This material represents an assessment of the market environment at a specific point in time and is not intended to be a forecast of future events or a guarantee of future results. All information as of the date indicated. There are risks involved with investing, including possible loss of principal. This information should not be relied upon by the reader as research or investment advice, (unless you have otherwise separately entered into a written agreement with SEI for the provision of investment advice) nor should it be construed as a recommendation to purchase or sell a security. The reader should consult with their financial professional for more information. Diversification may not protect against market risk. Bonds and bond funds will decrease in value as interest rates rise. High yield bonds involve greater risks of default or downgrade and are more volatile than investment grade securities, due to the speculative nature of their investments.
Statements that are not factual in nature, including opinions, projections and estimates, assume certain economic conditions and industry developments and constitute only current opinions that are subject to change without notice. Nothing herein is intended to be a forecast of future events, or a guarantee of future results.
Index returns are for illustrative purposes only, and do not represent actual performance of an SEI Fund. Index returns do not reflect any management fees, transaction costs or expenses. Indexes are unmanaged and one cannot invest directly in an index. Pas t performance does not guarantee future results.
Certain economic and market information contained herein has been obtained from published sources prepared by other parties, which in certain cases have not been updated through the date hereof. While such sources are believed to be reliable, neither SEI nor its affiliates assumes any responsibility for the accuracy or completeness of such information and such information has not been independently verified by SEI.
The information contained herein is for general and educational information purposes only and is not intended to constitute legal, tax, accounting, securities, research or investment advice regarding the strategies or any security in particular, nor an opinion regarding the appropriateness of any investment. You should not act or rely on the information contained herein without obtaining specific legal, tax, accounting and investment advice from an investment professional.
The views contained herein are not to be taken as advice or a recommendation to buy or sell any investment in any jurisdiction. Our outlook contains forward-looking statements that are judgments based upon our current assumptions, beliefs, and expectations . If any of the factors underlying our current assumptions, beliefs or expectations change, our statements as to potential future events or outcomes may be incorrect. We undertake no obligation to update our forward-looking statements.
Information in the U.S. is provided by SEI Investments Management Corporation (SIMC), a wholly owned subsidiary of SEI Investments Company (SEI).
Information in Canada is provided by SEI Investments Canada Company, a wholly owned subsidiary of SEI Investments Company (SEI), and the Manager of the SEI Funds in Canada.
Information issued in the UK by SEI Investments (Europe) Limited, 1st Floor, Alphabeta, 14-18 Finsbury Square, London EC2A 1BR which is authorised and regulated by the Financial Conduct Authority. Investments in SEI Funds are generally medium- to long-term investments.
This information is made available in Latin America, the Middle East, the Nordics, and Australia FOR PROFESSIONAL (non-retail) USE ONLY by SIEL.
Any questions you may have in relation to its contents should solely be directed to your Distributor. If you do not know who your Distributor is, then you cannot rely on any part of this document in any respect whatsoever.
Issued in South Africa by SEI Investments (Europe) Ltd, an authorised financial services provider (FSP No. 9796). This material is provided for general information and educational purposes only and does not constitute financial advice as contemplated in th e Financial Advisory and Intermediary Services Act, 2002. It has not been prepared with regard to the investment objectives, financial situation or particular needs of any individual investor. Any reference to portfolio positioning represents SEI's investment views at the date of publication and may differ between portfolios and mandates. Investors should obtain appropriate professional advice before making an investment decision.
This information is provided for general informational purposes only and is intended solely for institutional investors and other persons who may lawfully receive it under applicable Singapore laws and regulations. It is not directed at retail investors. Nothing contained herein constitutes an offer, solicitation, recommendation or invitation to subscribe for, purchase, sell or hold any investment, financial product or service. The availability of any investment strategy, fund or service in Singapore is subject to applicable Singapore laws and regulations.