The year ahead: Soft landing or hard slog? (Long Version)
Investor sentiment is currently enthusiastic over the prospect of a soft economic landing and a return to 2% inflation. Both bonds and stocks appear overbought on a near-term basis, so some kind of price consolidation would not be surprising. The extent of any correction in risk assets will depend on changing perceptions on economic growth, the corporate-profits outlook, the path of inflation and central-bank responses.
At the beginning of 2023, investors were battered and bruised following sharp declines in both bonds and equities. As Exhibit 1 shows, the only asset class that performed well in 2022 was commodities—which typically comprise only a small portion of a diversified portfolio. The past year was kinder to investors—up to a point. U.S. large-cap stocks, as represented by the Russell 1000 Index, gained a stellar 26.5% in 2023. Of course, much of that appreciation was driven by a rather narrow selection of mega-cap technology stocks. Overall, 2023 saw quite the reversal from the previous year.
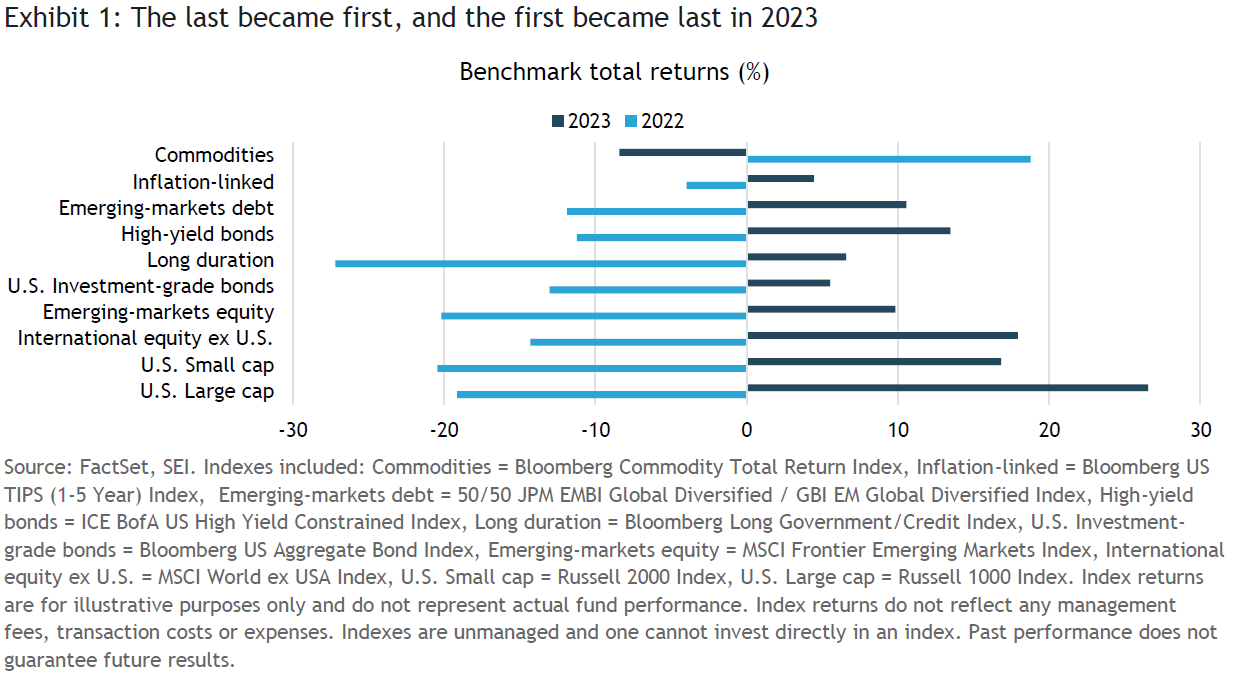
Although they lagged behind U.S. large-cap stocks by a significant amount, international stocks still achieved a respectable performance in 2023, gaining 17.9%, as measured by the MSCI World ex USA Index (total return). U.S. small caps also came on strong in December, ending the year with a total return of 16.8%, as measured by the Russell 2000 Index. Emerging-market equities advanced a solid 9.8% in 2023, clawing back just half the sharp decline in 2022.
Fixed-income markets saw mixed performance in 2023. Long-duration bonds posted a 6.6% total return, as measured by the Bloomberg Long Government/Credit Index, following 2022’s extraordinarily sharp 27.2% loss. U.S. investment-grade corporate bonds, as represented by the Bloomberg US Aggregate Bond Index, gained 5.5%, but high-yield bonds posted a strong 13.5% total return, as measured by the ICE BofA US High Yield Constrained Index.
The worst performing asset class in 2023 in the group we highlight was commodities—down 8.4% after being up nearly 19% in 2022, as measured by the Bloomberg Commodity Total Return Index. The conflict in the Ukraine was not enough to keep energy and grain prices at the lofty levels they attained in the immediate aftermath of the Russian invasion in early 2022. A massive infrastructure program in Germany that enhanced the country’s ability to import and process liquefied natural gas from the U.S., Qatar, and elsewhere took the risk premium out of the energy sector. The stalemate in the Ukraine conflict and a sharp rise in U.S. energy output all helped to deflate prices. China’s surprisingly slow rebound out of COVID also had a negative impact on energy prices and on a broad selection of industrial metals and agricultural products.
The year that was, the year that might be
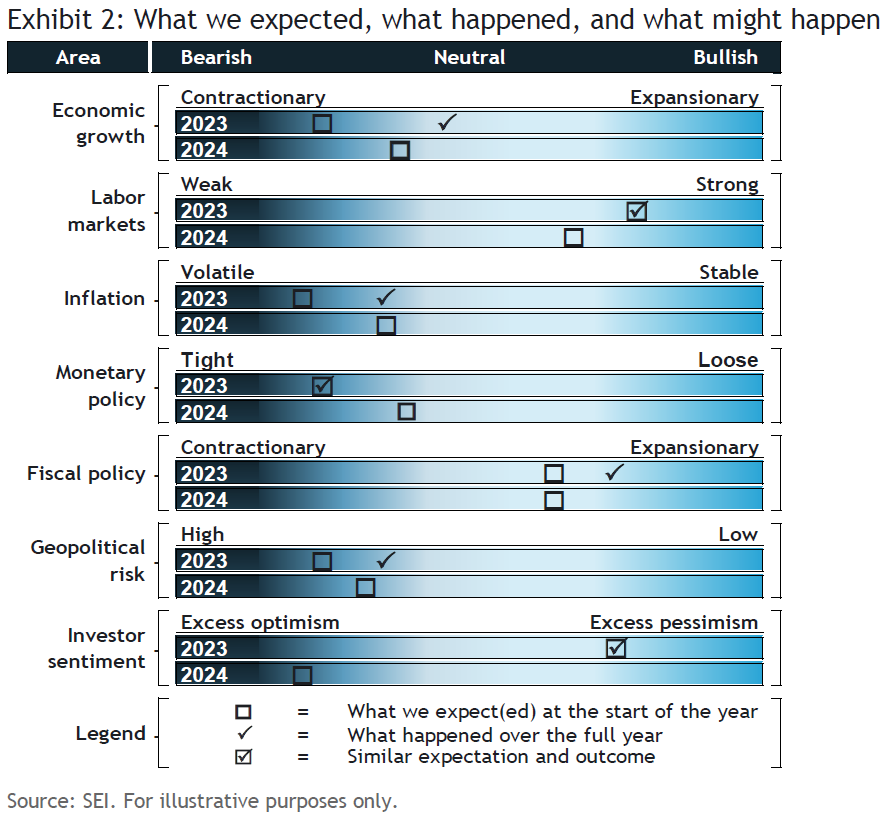
Exhibit 2 provides a stylized depiction of SEI’s 2023 and 2024 views on several key economic data points and policy issues. Our original forecasts for 2023, made at the end of 2022, are represented by the boxes in the top bars for each category; the actual outcomes are represented by checkmarks. To be sure, this is not a quantitative exercise. Rather, it is meant to illustrate the degree to which our expectations for 2023 proved to be accurate.
Looking first at economic growth, we argued at the start of the year that many developed countries would face economic stagnation and recessionary conditions in 2023, but the U.S. would not necessarily be one of them. It appears that we were mostly on the mark with that forecast, as indicated in Exhibit 3. Among the seven largest developed economies, the U.S. was the standout performer. The U.K. and Europe posted minimal gains in overall economic growth in the first three quarters of 2023, while Japan managed to register a notable year-to-date gain in gross domestic product (GDP), despite a contraction during the third quarter. Our more sanguine view on the U.S. contrasted with the consensus of economists, the majority of whom saw a better than 50/50 chance that the U.S. was or would soon be in recession.
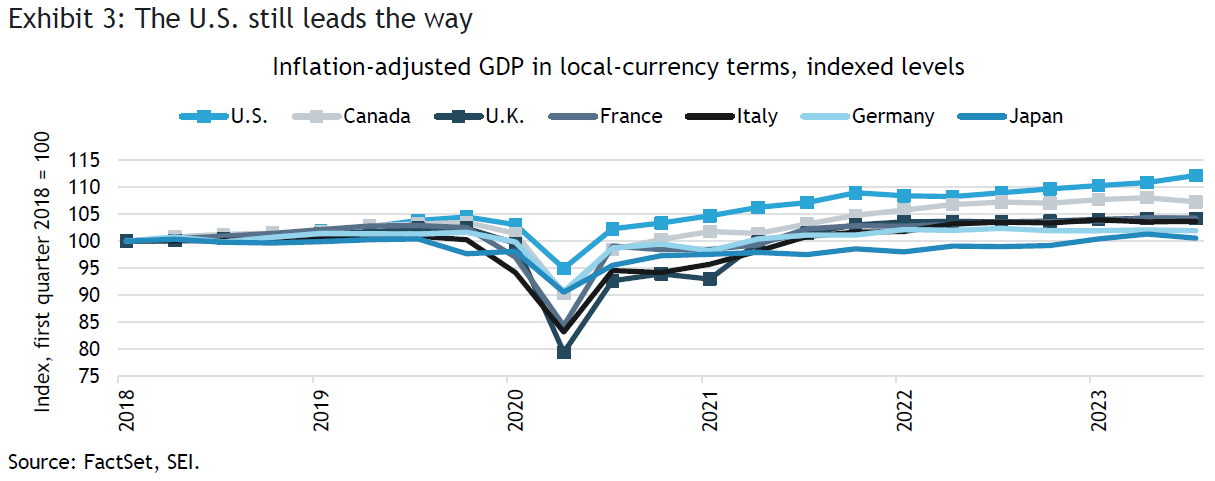
Our relative optimism on the U.S. at the beginning of the year notwithstanding, we did not expect economic activity to be as strong as it turned out to be. Not only did the U.S. avoid recession, gross domestic product (GDP) managed to advance at an above-average pace through the first three quarters of the year, highlighted by a blowout 4.9% annualized rate of gain in the July-September period. This continued a streak of superior performance relative to other major advanced economies. Inflation-adjusted GDP through the third quarter in the U.S. amounts to a cumulative 7.4% increase above the pre-COVID peak registered in the fourth quarter of 2019. By comparison, U.K. GDP was only 1.8% higher (about the same as France). The U.K. also reports GDP on a monthly basis; overall activity apparently declined 0.3% in October from September (not annualized).
Germany was the notable laggard among developed countries for the first three quarters of 2023, posting a cumulative GDP gain of just 0.3% over the period. Although COVID disruptions hit Germany’s overall economic activity less harshly than some other countries, its heavy manufacturing base and its extensive trading relationship with an underperforming China have taken a toll in recent years. Russia’s early-2022 invasion of Ukraine, leading to the elimination of Russian natural gas imports, made a difficult economic situation worse.
Elsewhere, China was a particular disappointment. Although it probably grew about 5% in 2023, its performance should have been far stronger because the country came out of COVID lockdown at the start of the year and faced easy comparisons against activity levels a year earlier. Household spending on restaurants and travel within the country rebounded, but property markets are moribund and, consequently, consumer confidence is low. Business confidence also is at an ebb, as more than a dozen business leaders from industries including technology, finance and real estate have gone missing, faced detention or are subject to corruption probes. This has cast a pall over the business community, as people in high places wonder who is next.
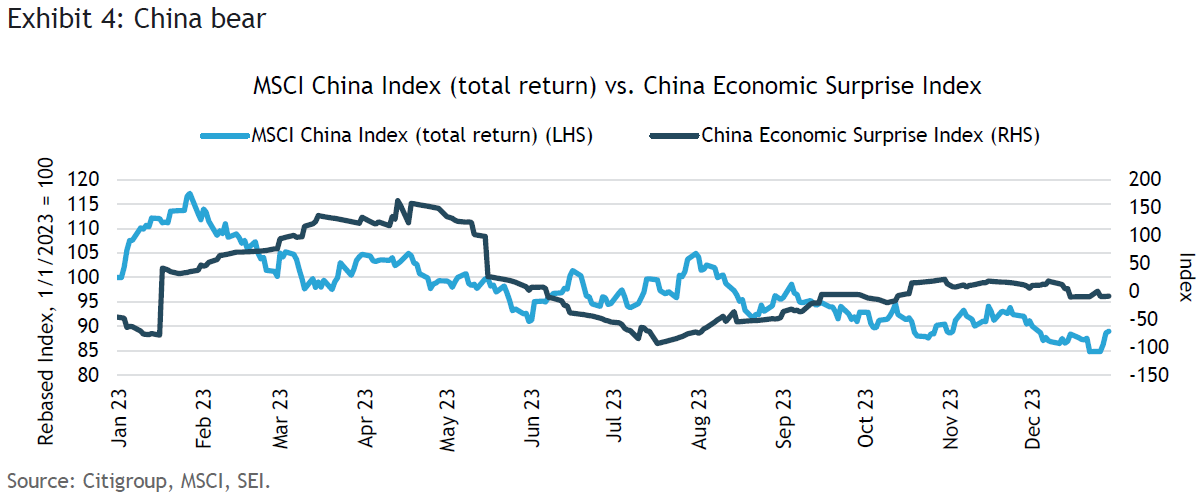
Exhibit 4 shows that China got off to a fast start in 2023. The economy appeared to be moving in the right direction, and investors piled into the country’s stock market with enthusiasm. By late January, the MSCI China Index (total return) was already up 17% on a year-to-date basis. However, the good times didn’t last long. Even though the economic data continued to surprise on the upside, equity prices started sliding again. For 2023 overall, the MSCI China Index (total return) posted an 11% decline and a 24% drop from its peak in January.
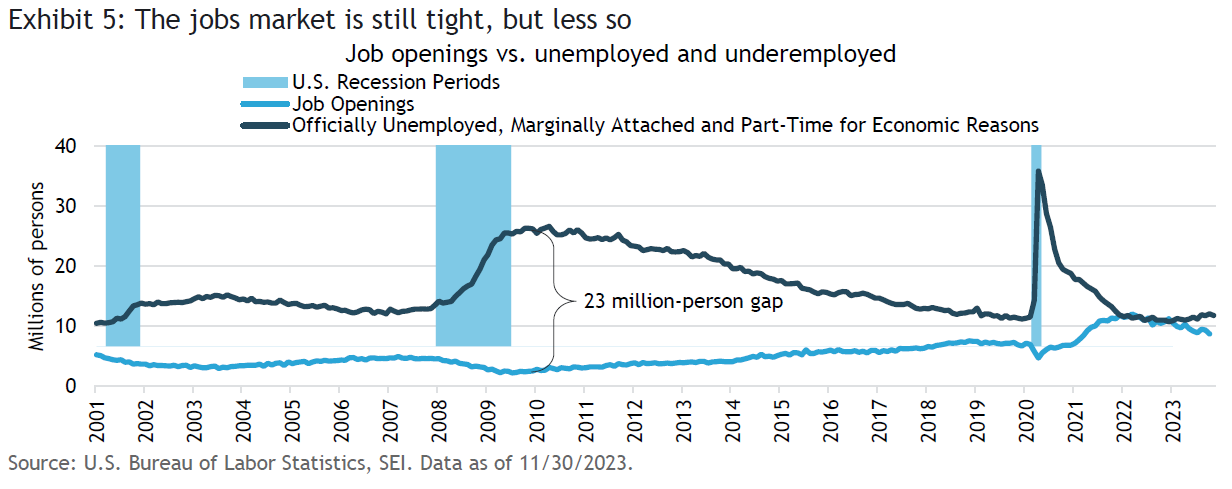
Shifting back to the U.S. economy, we expect more subdued growth in 2024, perhaps deteriorating into a stagnant/mildly recessionary environment along the lines of what is currently being seen in much of Europe. While interest rates may no longer be rising, they remain high and are starting to bite harder. Households have smaller savings cushions to draw upon to sustain spending in excess of their incomes. Credit-card usage is up sharply and, as a result, delinquency rates are climbing. The situation is not yet critical or indicative of recession, but households will be more heavily reliant on a continued robust jobs market and strong wage growth in the months ahead. The good news is that the jobs market is still tight. However, there are signs of weakness cropping up.
The Job Openings and Labor Turnover Survey (JOLTS) report highlights the deterioration. Exhibit 5 compares the number of job openings to the number of officially unemployed persons, discouraged workers (unemployed and not looking for a job, yet claiming to want one) and employees in temporary and part-time positions who want to work full time. Job openings have been decreasing since March 2022, from a high of 12 million to a current reading of 8.7 million as of October. That is a fairly hefty pullback at a time when the economy is still growing at a decent pace. Perhaps many of these job openings were “phantom” in the sense that employers were merely testing the waters to see who was available and qualified, but had little intention of filling the positions in the near term. In any case, the number of job openings is still well above the pre-COVID peak achieved five years ago. The number of unemployed and underemployed persons, meanwhile, has begun to creep up noticeably, totaling 11.8 million as of November, according to the U.S. Bureau of Labor Statistics.
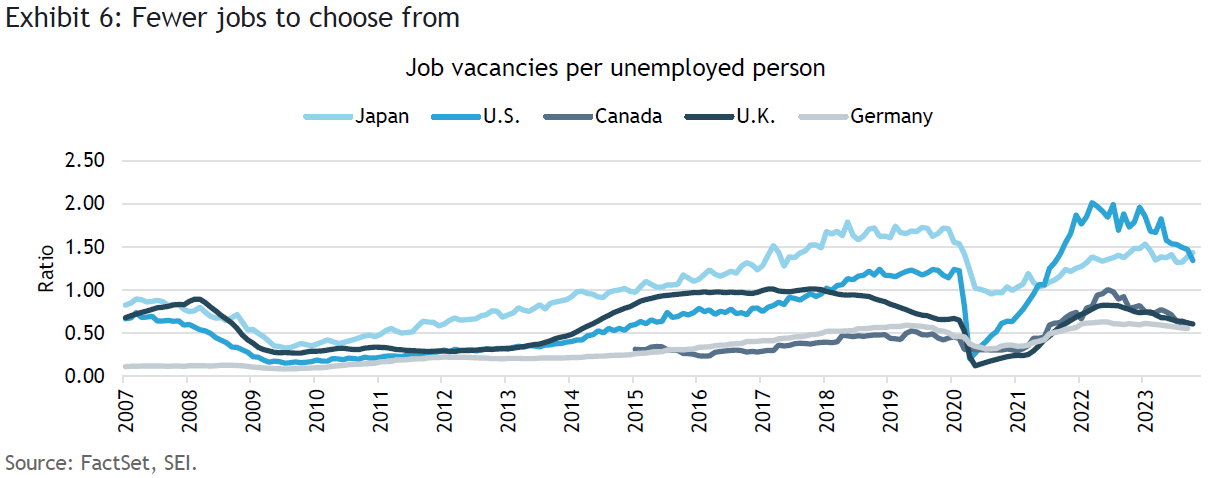
Other countries are experiencing easing labor market conditions as well. Exhibit 6 compares job openings to the number of officially unemployed persons. In the U.S., that amounts to 5.8 million persons. Currently, there are 1.3 job vacancies per unemployed person in the U.S. Except for Japan, that is a higher ratio than in the other countries listed in the chart, but it is down from a high of two job vacancies per person reached in March 2022. Japan has recorded a more modest decline, but the labor market in that country was even tighter in the years just prior to COVID. Canada and the U.K. also have recorded significant declines in their ratios since mid-2022.
Given this backdrop of easier labor-market conditions, it is not surprising that the Organisation for Economic Co-operation and Development (OECD) reported a sharp deceleration of compensation gains in the U.S. over the four quarters ending in September 2023. But the data are noisy on a year-to-year basis, and we think it is proper to take a multi-year average to discern the real trend in the international compensation statistics. Exhibit 7 examines total compensation rates (wages and non-wage benefits) for the U.S., the U.K., Canada, Germany, France and Japan, annualized over a three-year period.
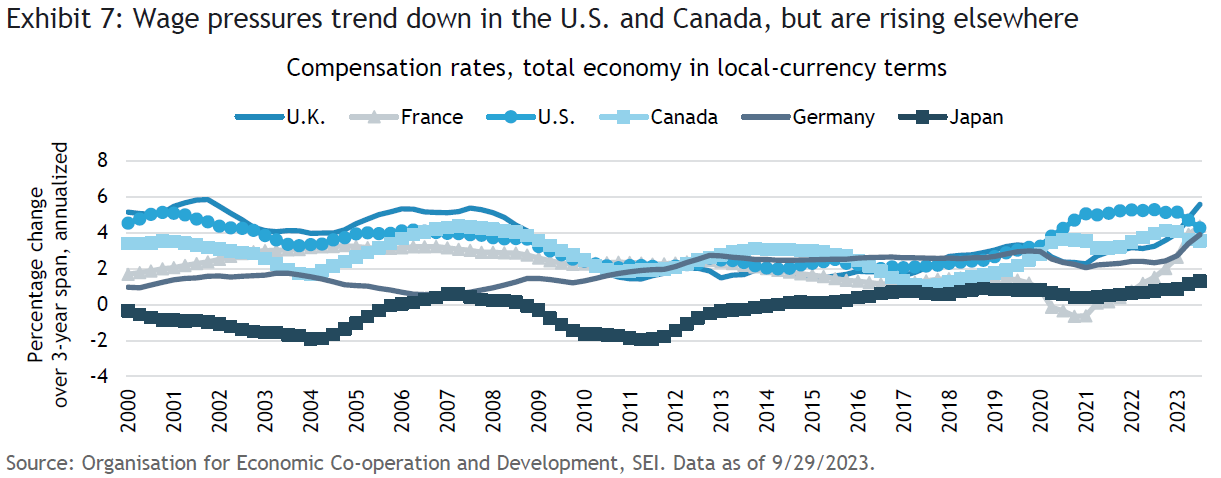
Both the U.S. and Canada have recorded a marked slowing in compensation gains from their 2022 peaks, although the advances in both countries are still running at their highest annualized levels since before the Global Financial Crisis of 2007-to-2009. The other four countries in the chart are still registering an accelerating rate of gain, led by the U.K. (+5.6% through the third quarter) and France (+4.3%). Even Japan has seen compensation rates break out to new multi-decade highs; although the pace of gain remains much lower (1.3%) compared to those of the other major countries.
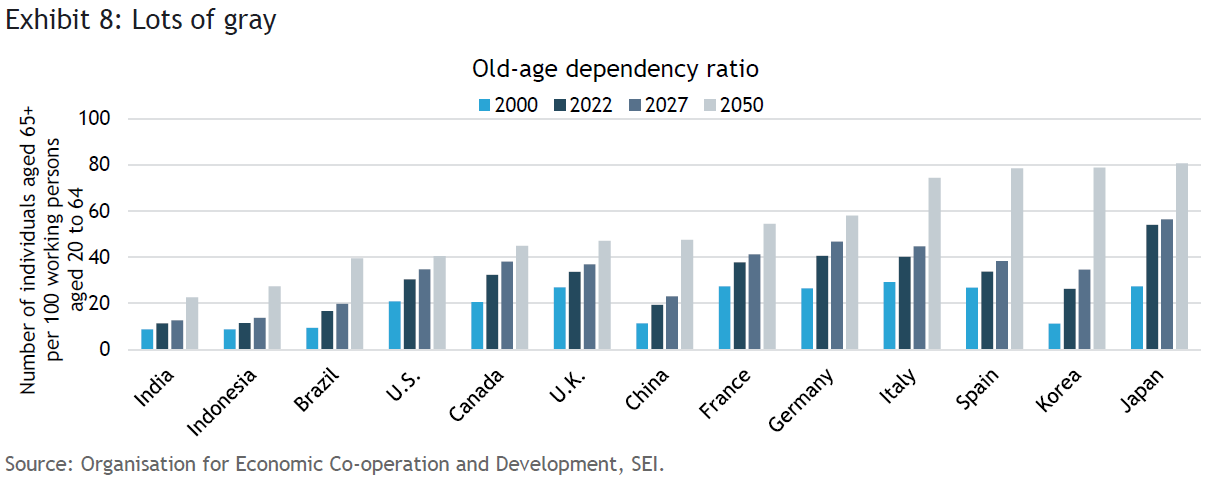
We believe that demographics will limit the deceleration in compensation gains over the course of the next business cycle. The retirement from the labor force of the baby boomer generation (those born between 1946 and 1964) accelerated during COVID, causing a 1.6-percentage point reduction in the labor force participation rate for that group. The participation for persons 55 years of age and over has stabilized in recent years around 39%, but it will surely start to decline again as more workers reach full retirement age. Participation rates for those 65 and over is less than 20%. According to Pew Research, roughly one-fifth of the U.S. population will be retired by 2030, with all baby boomers at or above the age of 65 at that time.
The demographic outlook is even more troubling for Europe and some Asian countries, especially Japan and South Korea. Exhibit 8 highlights the old-age dependency ratio for several developed and emerging countries. The dependency ratio is defined as the number of individuals 65 and over per 100 people of working age (those aged 20 to 64). The dependency ratio is already above 40% for Germany and Italy and a stunning 54% for Japan as of 2022. By comparison, the U.S. (30.4%), Canada (32.3%) and the U.K. (33.6%) appear to be in a better demographic position, although their old-age dependency ratios most likely will continue to rise in the years ahead. By 2050, the dependency ratio in Japan is estimated to reach 80%. South Korea’s ratio is expected to be nearly as high as Japan’s, followed closely by Spain. The U.S. (40.4%), Canada (44.9%), and the U.K. (47.1%) again look much better in comparison to the countries of Western Europe and East Asia.
Transitory disinflation?
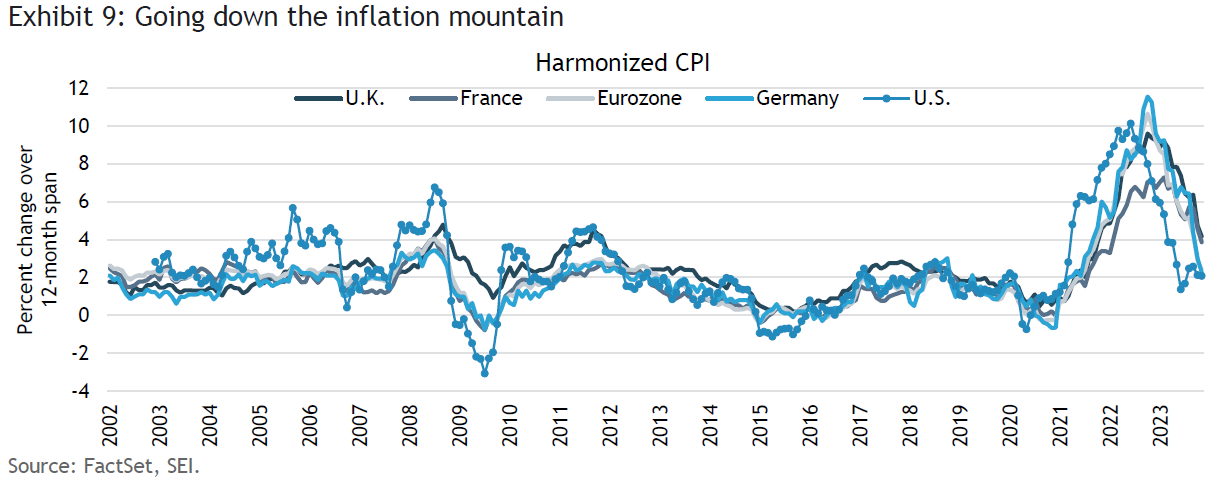
Although we acknowledged this time last year that inflation was trending lower, the rate of increase has decelerated more dramatically in recent months than we had expected. Exhibit 9 tracks the so-called Harmonized Index of Consumer Prices (HICP). This inflation statistic provides a more comparable measure of different countries’ inflation rates than the price data individually issued by the various countries themselves.1 The chart shows that the U.S. led the global acceleration of inflation in 2021 and 2022; in 2023, it has been leading the way down. Both the U.S. and the eurozone have enjoyed a fall in HICP inflation back to ward the 2% level, measured on a year-over year basis. The U.K. and France have been lagging in terms of inflation levels, but have, nonetheless, registered a rather sharp slowdown from their inflation-rate peaks.
Do the declines mean that central banks can confidently declare, “Mission accomplished”? In our opinion, the answer is a firm “no.” This is admittedly a minority view in the aftermath of the U.S. Federal Reserve’s (Fed) latest policy meeting in December, but we note that the bulk of the improvement has come in volatile food and energy prices. Exhibit 10 highlights the core inflation measures for the U.S., the U.K., Canada, the eurozone and Japan (The core consumer price index (CPI) data are published by the individual governments, and do not use the harmonized CPI methodology). Canada has recorded the largest improvement from the peak, with core inflation rising just 2.9% over the past year as of November 2023. Japan also saw core inflation rise 2.8%, but price gains there are still accelerating a bit (as opposed to the other countries depicted in the exhibit).
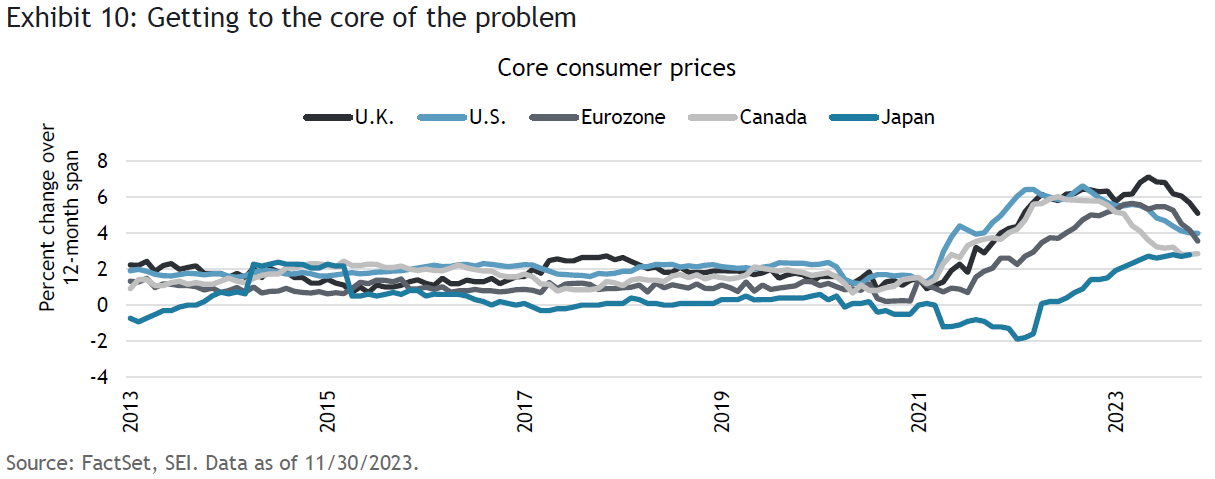
The annual inflation rate in the U.S. (+4.0%) and the eurozone (+3.6%) tracked each other in 2023, but we think core inflation in Europe is more likely than the U.S. to get closer to the respective central banks’ 2% target by the end of 2024, due to a relatively weaker regional economy, while the U.S. sees a stabilization of inflation closer to the 3% mark. The U.K., on the other hand, has had a much more difficult time getting its inflation rate lower. As of November 2023, the 12-month rate of change in consumer price index (CPI) core inflation was a still-worrisome 5.1%. Although U.K. inflation probably will decelerate further in the months ahead, the sharp increase in compensation rates noted in Exhibit 7 will likely impede that improvement and keep core inflation well above the Bank of England’s (BOE) 2% target.
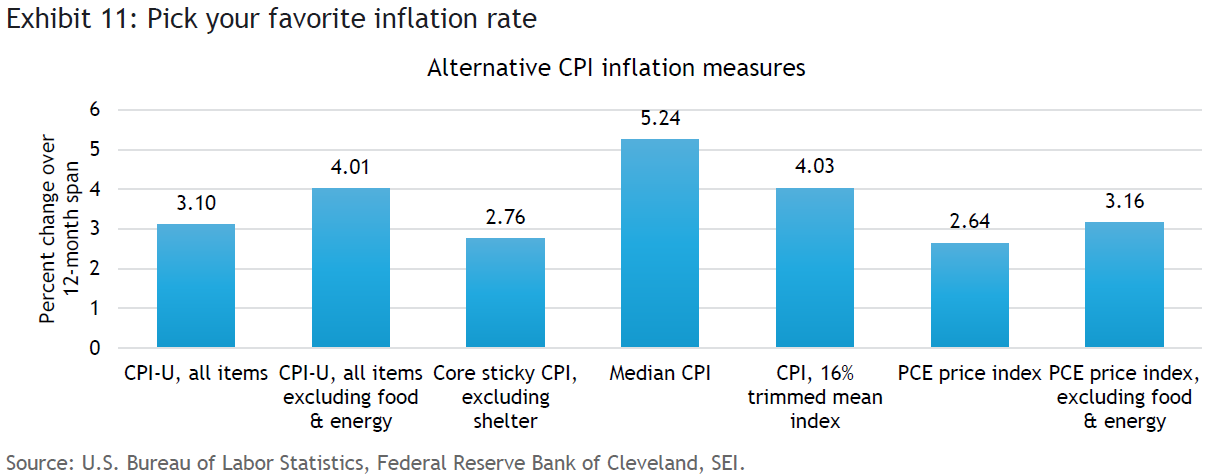
There are many ways to “slice and dice” inflation statistics, which we show for the U.S. in Exhibit 11. Consumer prices (CPI-U all items), the personal-consumption expenditures (PCE) price index and even the core “sticky” CPI less shelter index2 have decelerated to around the 2.6%-to-3.1% mark. By contrast, the median CPI3 is still above 5%. The so-called trimmed mean CPI, which excludes the CPI components that show the most extreme monthly price changes, is still above 4%. The core PCE price index, the inflation measure explicitly preferred by most Fed decision-makers, is now approaching 3%, about half a percentage point lower versus where we thought it might end the year.
As was the case at the end of 2022, we maintain our position that inflation will not fall all the way back to central banks’ target without some amount of pain. We think that economies globally will need to endure a prolonged period of subpar growth or outright contraction before labor markets can ease enough to exert enough downward pressure on wages to be consistent with a sustained 2% inflation rate.
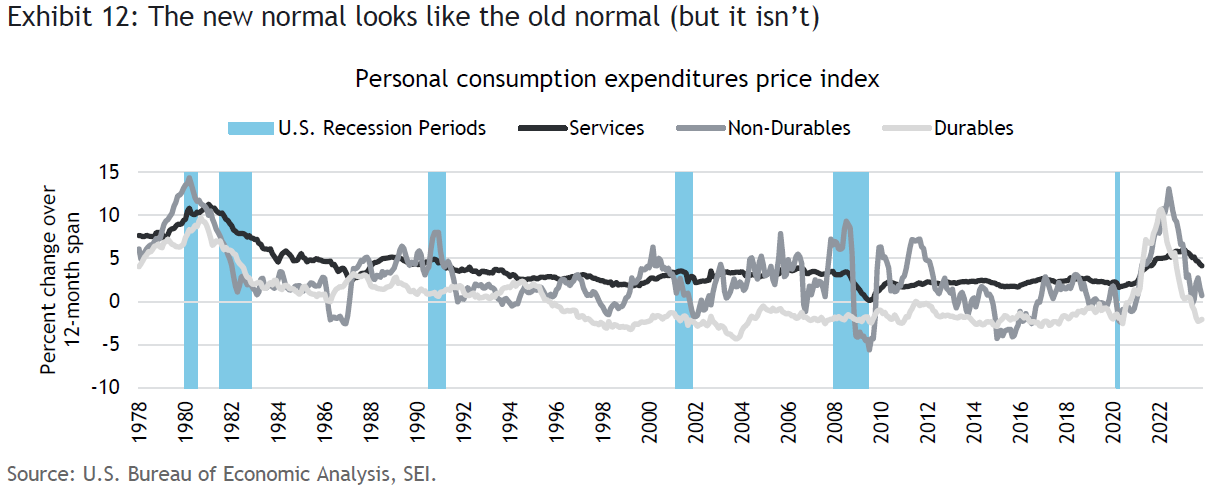
While a drop in inflation from the levels of the past two or three years is not surprising, we believe the most recent months’ reading of overall inflation underestimates the longer-term trend. This seems especially the case in the U.S., where the normalization of supply chains and shifts in consumer purchasing patterns have put downward pressure on goods prices that have caused an outright deflation in durable goods prices. Exhibit 12 breaks down the PCE price index into its component parts (durables, non-durables and services). Durable goods prices have fallen more than 2% over the past year, a performance that was the norm since the late 1990s. Prices for non-durable goods, which include food and energy, have decelerated sharply from their peak rate, but this component has always been a volatile series. Services inflation, meanwhile, was still posting a 4.1% year-over-year gain as of November; although it has been easing, service prices are still rising at their fastest clip since 1991.
Our skepticism that U.S. inflation will settle at around 2% is based on a few assumptions. We think the big decline in energy prices over the past year, for example, will not likely be repeated in 2024. Although there are concerns about demand-and-supply fundamentals, commercial crude oil inventory levels do not appear unduly excessive and global production of oil and other liquids has remained flat and mostly in line with demand (thanks to a series of production cuts, primarily by Saudi Arabia). As noted previously, geopolitical risk has been squeezed out of crude oil prices, despite the ongoing possibility of an escalation of the war in the Middle East.
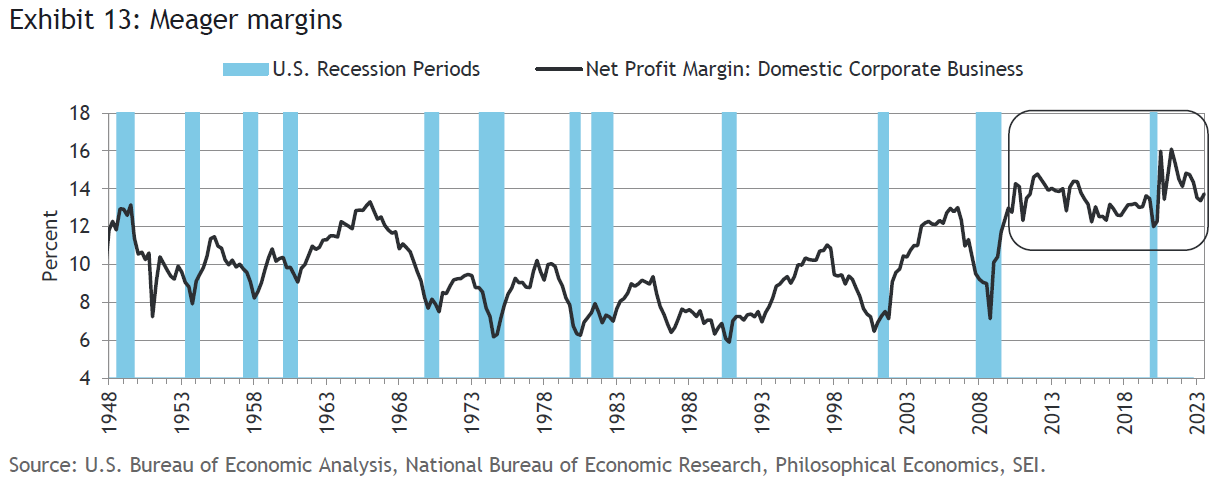
More importantly, we also believe that profit margins are likely to come under pressure as previous secular tailwinds turn into headwinds. This includes (1) structural tightness in the labor market keeping wage inflation higher for longer; (2) higher financing costs that will exert an even greater impact in future years as lower-cost debt matures; (3) increased costs and lower productivity caused by a reduction of scale as companies diversify their supply chains away from China; (4) higher corporate taxes as governments seek to repair their fiscal positions; and (5) the expense of adapting to new government environmental regulations aimed at drastically reducing the use of fossil fuels. Productivity improvements can certainly help to offset a portion of these drivers of reduced profit margins, but we think that companies with pricing power will push these costs onto the end users of their products and services. Exhibit 13 shows that economy-wide profit margins have already declined from the peak levels reached in 2021, and lately have been in the same range as in the five-year period between 2010 and 2015, a time when the economy was struggling to grow out of the Global Financial Crisis.
Powell plays Santa and markets go wild
In their mid-December meeting, Fed policy-makers clearly signaled their expectation that the U.S. economy will experience a soft landing, in which growth and inflation slow but the economy does not enter a recession. The Federal Open Market Committee’s (FOMC) median forecast projected a rise in GDP of 1.4% in 2024, following a 2.6% increase in 2023. Growth would then accelerate to 1.8% and 1.9% in 2025 and 2026, respectively. The unemployment rate is forecast to rise to only 4.1% from November’s 3.7% rate and stay there through 2026. Core PCE inflation is projected to finish 2023 at 3.2%, and then fall to 2.4% in 2024, 2.2% in 2025 and 2.0% in 2026. We tend to be a bit more pessimistic about the pace of growth in 2024, but the big difference between the Fed and ourselves centers on the path of inflation. We remain doubtful that inflation will fall smoothly toward 2% by 2026 for the reasons previously cited.
Consistent with the Fed’s benign assessment of the economic outlook, the central bank sees three federal-funds rate decreases next year, to 4.6%, four additional cuts in 2025, and more reductions in 2026 to 2.9%. Traders in the futures market appear even more optimistic than the Fed, pricing in 150-basis points (1.50%) of cuts in the federal-funds rate by the end of 2024. In contrast, we lean much closer to the Fed’s view, penciling in three 25-basis point reductions. It all depends, of course, on how strong the economy stays and whether inflation stabilizes or even backs up a bit from current levels.
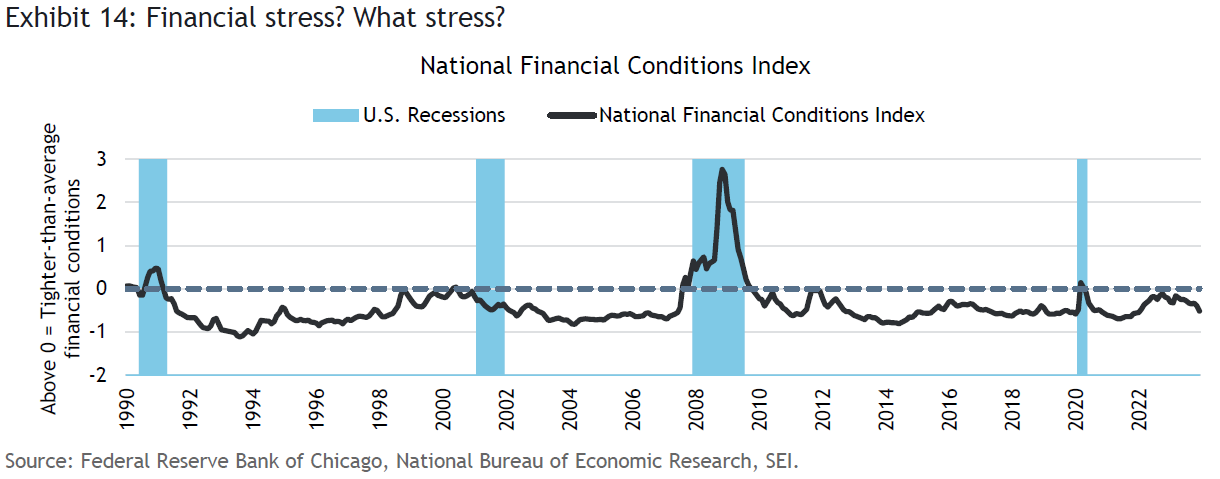
At this point, we question whether any rate cuts are really needed. Exhibit 14 tracks the Chicago Federal Reserve’s National Financial Conditions Index (NFCI), which tracks more than 100 financial-activity variables measuring risk, credit, and leverage. Positive values of the NFCI have been associated with financial conditions that are tighter than the historical average, while negative values signal that financial conditions are easier than average. By this measure, financial conditions actually have been easing since October 2022, reflecting the strength of the equity market and the tightening of credit spreads. With the recent decline in bond yields, the index has eased even further to a level that is consistent with economic expansion and a low level of financial stress. So far, the tightening of bank lending standards following the collapse of Silicon Valley Bank and a few other banking institutions in March 2023 has had an impact limited to those companies that are either too small or too financially weak to tap the capital markets.
Fed Chair Jerome Powell and other Fed officials maintain that monetary policy is now restrictive and inflation is down for the count. While we think these are debatable points, they provide the rationale to ease monetary policy at a time when the U.S. economy is at full employment and is still chugging along at a reasonable pace. In our view, the Fed’s rhetoric is simply adding fuel to investors’ enthusiasm.
Other central banks appear to be taking a more conservative tack. Both the BOE and the European Central Bank (ECB) insist that the job of vanquishing inflation is not done. Not surprisingly, given the U.K.’s higher inflation rate, the BOE’s rhetoric is more aggressive; the central bank seems to be preparing the ground for a “hard landing,” which occurs when a country's economy rapidly shifts from growth to slow growth to flat as it approaches a recession. One possible scenario: The BOE will be more hesitant to cut rates, lagging the Fed, the ECB, and the Bank of Canada. However, as the economy weakens, we believe that the pace will pick up, forcing the BOE to cut policy rates more aggressively than other central banks during the second half of 2024.
The ECB also is pushing back on the idea that rate cuts are coming soon. ECB President Christine Lagarde and her colleagues are wary that the rising trend in labor costs will become more embedded into prices, as it apparently has done in the U.K. In addition, Germany is facing a spike in CPI inflation as government energy subsidies end.
Japan and China remain important outliers among global economies. Despite intense speculation over the timing of a move away from negative policy rates and yield-curve control, the Bank of Japan (BOJ) has maintained the status quo, rising inflation notwithstanding. The deflation and poor economic performance since the early 1990s is burned deeply into the country’s psyche. Policy-makers still cannot believe that the inflation trend is truly sustainable. Like many other observers, SEI expects the BOJ to begin the normalization of interest rates in 2024. The timing remains a key unknown.
The Bank of China, on the other hand, has an immediate problem. The debt woes of the property sector and provincial governments are a malady that is not easily treated by monetary policy alone. Consumer prices fell 0.5% over the 12-month period ending November 2023. Outright deflation is an unusual occurrence in any major economy (Japan is another exception). It is a worrisome development for central banks because their policy tools become less effective. That is why policy-makers prefer a 2% target inflation rate rather than true price stability. Given China’s deflationary bias, a more aggressive fiscal policy is probably necessary. But the regime of President Xi Jinping has been loath to engage in a big fiscal reflation, preferring targeted measures instead. Perhaps 2024 will be the year China takes a bigger policy gamble, but there is little sign of that yet.
Fiscal follies
Last year at this time, SEI warned that government finances would deteriorate following improvement in 2022. This was an accurate call. Although the deficit financing might diminish a bit in 2024, now that COVID emergency expenditures have come to an end, that doesn’t mean that the fiscal positions of the major economies will improve dramatically. In the U.S., spending is mostly on autopilot, given Congressional deadlock and the fact that we are entering a presidential election year. Some of the biggest legislative achievements of the administration of President Joe Biden (the Inflation Reduction Act, the Chips Act, and the infrastructure bill) have long tails.
In Europe, countries are finding that, in Kermit the Frog’s immortal words, “it’s not easy being green.” Although payments to households to offset high electricity costs have ebbed, incentives to speed the transition to lower carbon emissions will keep overall spending levels high. All countries will also need to deal with higher expenditures on old-age benefits, further hikes in military expenditures, and much higher interest expense.
Central government debt as a percentage of GDP has risen across the major economies versus four years ago just before COVID lockdowns, as illustrated in Exhibit 15. The U.S. and Canada have recorded the largest expansion in government debt relative to GDP, rising almost 17 percentage points since the end of 2019. Italy isn’t far behind with its debt-to-GDP ratio advancing 14.5 percentage points over this span. The U.K., France and Japan each have recorded 11-percentage point rises, with the latter country’s ratio now reaching 213%. Unlike other central banks, the BOJ continues buy its government securities hand over fist in order to keep interest rates at absurdly low levels relative to those of any other country.
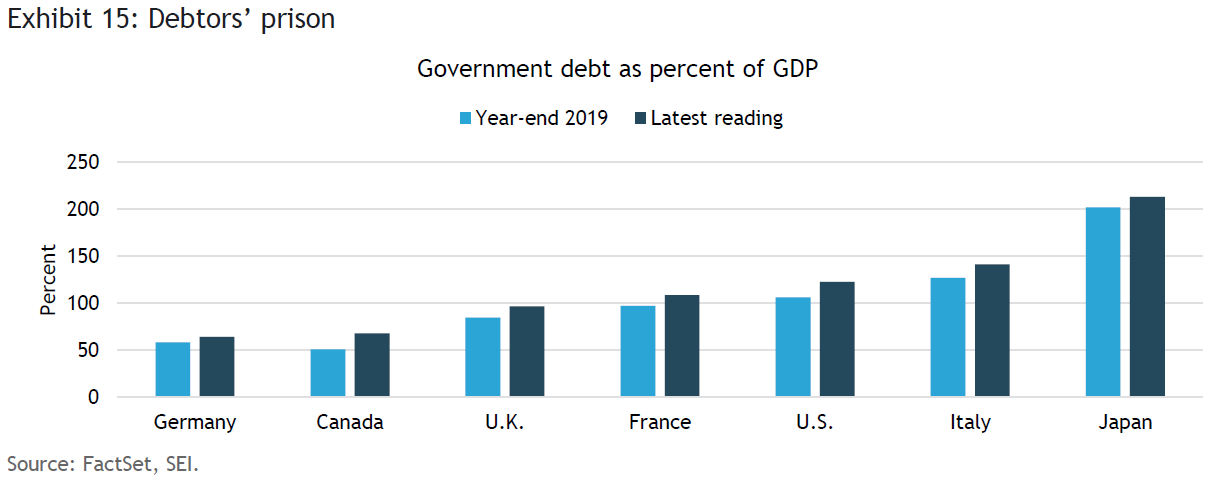
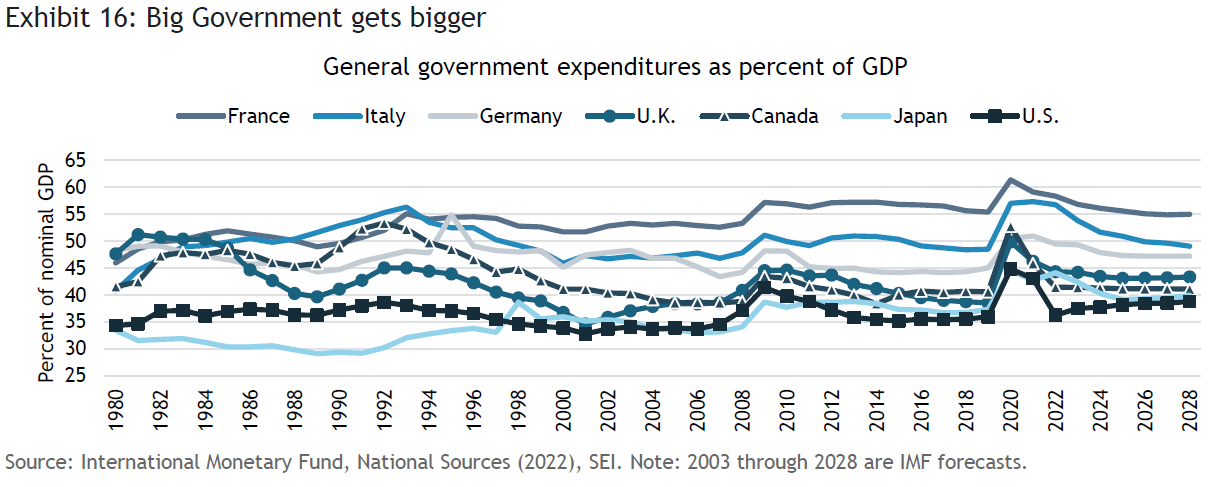
Exhibit 16 shows that general government expenditures also have become a larger part of the economy for many countries. The COVID-related spike in spending has dissipated, but France, the U.K., and the U.S. appear to be settling at higher spending levels relative to GDP than has generally been recorded in the past. It is important to note that the International Monetary Fund projects a steady rise in the spending-to-GDP ratio for the U.S. over the next few years to levels that have previously been matched or exceeded in recent decades only during recessions. This is a significant development, since the U.S. economy is currently operating at full employment, a time when revenues are strong and anti-cyclical spending to support the economy is low. In a recessionary economy, the deficit in the U.S. could approach 10% of GDP.
Geopolitics: Things are getting messy
We expected geopolitical considerations in 2023 to be nearly as fraught as they were in 2022. We anticipated that the war in Ukraine would drag on, which it did, but financial markets ended up being much more complacent about subsequent developments than we would have thought. More oil flowed out of Russia and Iran, and Europe managed to adjust to the elimination of Russian natural gas exports into the region by ramping up liquefied natural gas (LNG) imports from the U.S., Qatar and Nigeria. Massive conservation efforts, increased reliance on coal and a bit of luck in the form of benign weather conditions, also provided significant assistance in overcoming the energy challenge.
A new source of possible volatility in the oil markets is the war between Israel and Hamas. Although the war has thus far remained fairly localized, a broader regional conflict cannot be ruled out. Hezbollah, an Iran-backed, Shiite Muslim political party and militant group based in Lebanon, remains a threat on the Israeli-Lebanese border, while the Houthis in Yemen continue to attack shipping in the Red Sea. Maersk and Hapag-Lloyd, two major container-ship operators, temporarily suspended operations in the Red Sea and the Gulf of Aden in mid-December. BP, a large U.K.-based integrated oil company, also has paused transiting through the Suez Canal. Other carriers are following suit, jeopardizing supply chains yet again. There is pressure on the U.S. and other countries to protect this important shipping lane, but so far there has been a reluctance to deal forcefully with the Houthi militants. The same can be said with regard to Hezbollah; there have been more than 100 attacks on U.S. forces and interests, both at sea and on the ground. Thus far, these attacks have been mostly pinpricks. But the danger of a serious attack that injures or kills American military personnel would require retaliation—at the risk of involving Iran in a more direct fashion.
Five thousand miles to the east, tensions between the U.S. and China continue at a low simmer, pretty much as we expected at the beginning last year. Taiwan remains a flash point, however, and the Biden administration’s efforts to deprive China access to the most advanced semiconductors and chip-making equipment underscores the troubled relationship that now exists between the two superpowers. The administration’s big push to incentivize the building of semiconductor manufacturing capacity in the U.S. is a clear sign that the U.S. political establishment is preparing for the worst—a takeover of Taiwan and a disruption of the supply of essential chips—while hoping that the worst never happens.
China’s President Xi and President Biden lowered the tension somewhat between the two countries during their meeting in San Francisco in November. Military officials are again talking to each other, and John Kerry, U.S. Special Presidential Envoy for Climate, worked closely with his Chinese counterpart to push for a broad consensus at the COP28 climate change conference in December. In our view, this flurry of diplomatic activity toward the end of 2023 might reflect President Xi’s growing concern over his country’s economic performance.
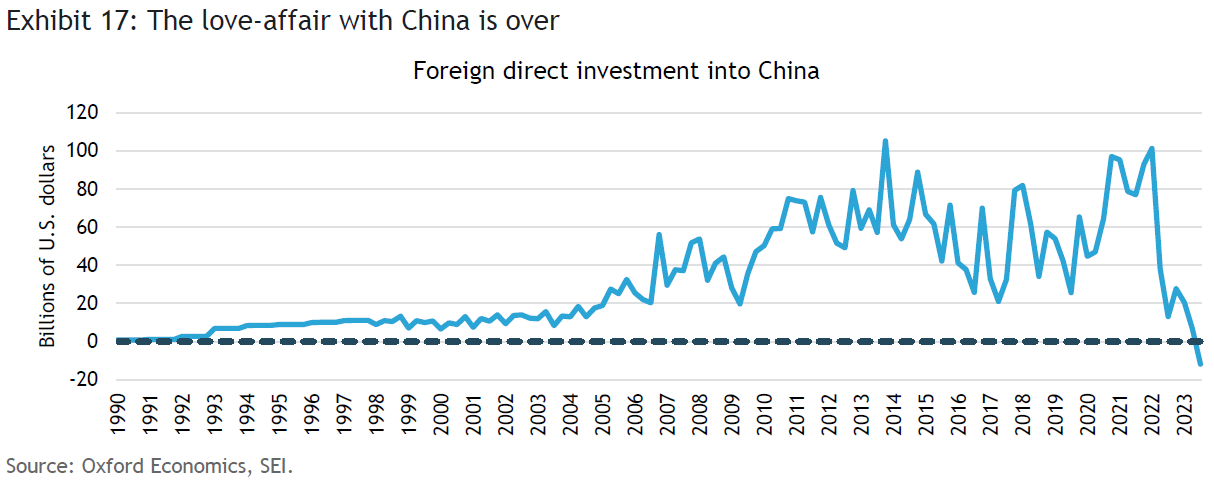
It is no secret that foreign businesses are redirecting resources away from China. Exhibit 17 shows that foreign direct investment in China turned negative in the third quarter of 2023—the first time that has happened since the country opened itself up to the world in 1978. Whether Xi’s extension of an olive branch to the U.S. government and business succeeds is an open question. Recent abductions and arrests of corporate executives (mostly local Chinese, but also some foreign executives) have hurt the country’s reputation badly. In the interim, both China and the U.S. continue to implement measures aimed at reducing their economic dependence on each other through trade restrictions and other non-tariff barriers.
The next strain in the U.S.-China relationship could come as soon as mid-January, with the presidential election in Taiwan. It is a three-way race, with the leader of the incumbent Democratic Progressive Party holding the lead in the most recent polling. If he were to prevail, tensions with China will likely remain at an uncomfortably high pitch.
There is a heavy global election schedule in 2024. In addition to Taiwan in January, there are presidential and/or parliamentary and congressional elections in several major countries, including Indonesia (February), Russia (March), India (April), South Africa (May), the European Union (June), the U.K. (to be determined) and the U.S. (November). Some of these could be closely run affairs that may lead to important policy shifts. Of special interest, of course, are the elections in the U.K. and the U.S.
In the U.K., the Labour Party appears to hold a solid lead, winning recent by-elections in former Tory strongholds. In the U.S. the polls are currently suggesting a victory by former President Donald Trump over President Biden. But it is still early in the election cycle, and there will be plenty of ups and down for both candidates (assuming each is nominated by their respective party, which seems likely). We expect a fair degree of market volatility as the vote nears in both the U.K. and U.S. The NDR (Ned Davis Research) presidential cycle database, as represented in Exhibit 18, tracks the performance of U.S. large-cap equities back to 1948.
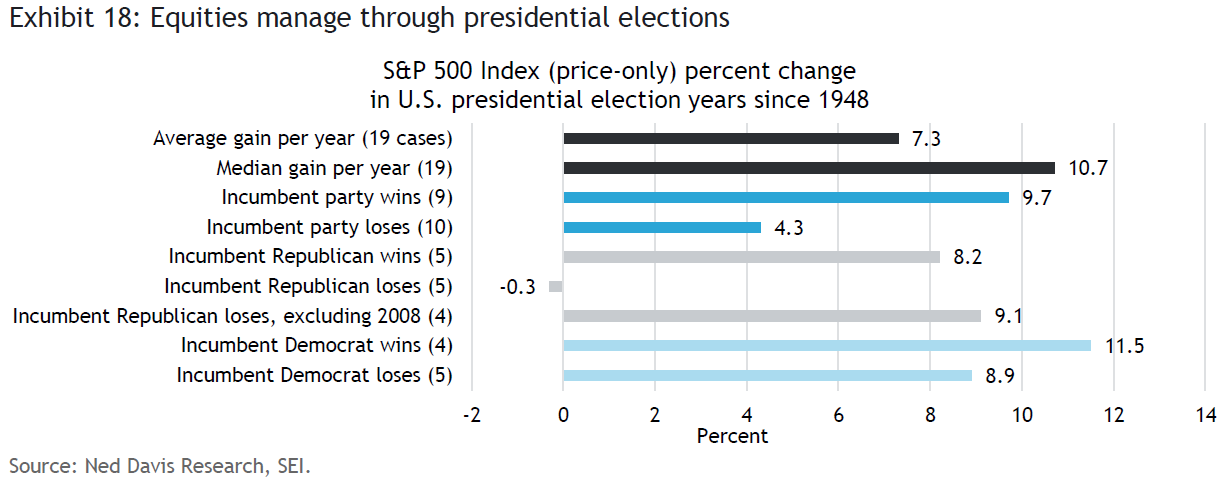
Presidential election years have tended to be good for the U.S. stock market, as represented by the S&P 500 Index, with equities rising 70% of the time, and sporting an average price-only gain (excluding dividends) of 6.4% annually. Since the end of World War II (the first postwar presidential election was held in 1948), the performance has proved to be even better; stocks have recorded gains 83% of the time, with an average increase of 7.3% per year and a median advance of 10.7%. This solid performance coincides with the tendency of monetary and fiscal policy to be expansionary in the final year an incumbent President’s term. Perhaps this is mostly coincidence, but there have been times (notably in 1972, when Fed Chairman Arthur Burns maintained an inappropriately expansionary interest-rate policy to aid Richard Nixon’s re-election effort) when policy leaned in favor of the incumbent party.
Equities appear to perform best when the incumbent Republican (or his Republican successor) wins the election. Continuity seems to be an important consideration. The S&P 500 Index (price only) has advanced 11.5% on average, when the incumbent Democrat wins. While it seems as if the stock market posted a below-average performance in cases where the incumbent party loses the election, this result was skewed by the Global Financial Crisis in 2008, when John McCain, the Republican nominee, lost to Barack Obama, the Democratic Party candidate. That year witnessed a 38.5% price decline in the S&P 500 Index. Excluding the 2008 experience, the S&P 500 Index has posted a 9.1% average yearly gain in those years when the incumbent Republican loses the election.
The outcome of the U.S. presidential election might thus have little impact on the direction of the overall market, but it could have a profound effect on specific sectors and industries. If Trump wins, the executive orders issued by President Biden will almost certainly be reversed. Trump most likely will issue his own set of executive orders. The downside to these potential policy reversals is the uncertainty it engenders for business. It is hard to invest in manufacturing plants and long-lived equipment that will take years to provide an adequate rate of return if the rules change dramatically over the expected life of that investment.
Animal spirits running high
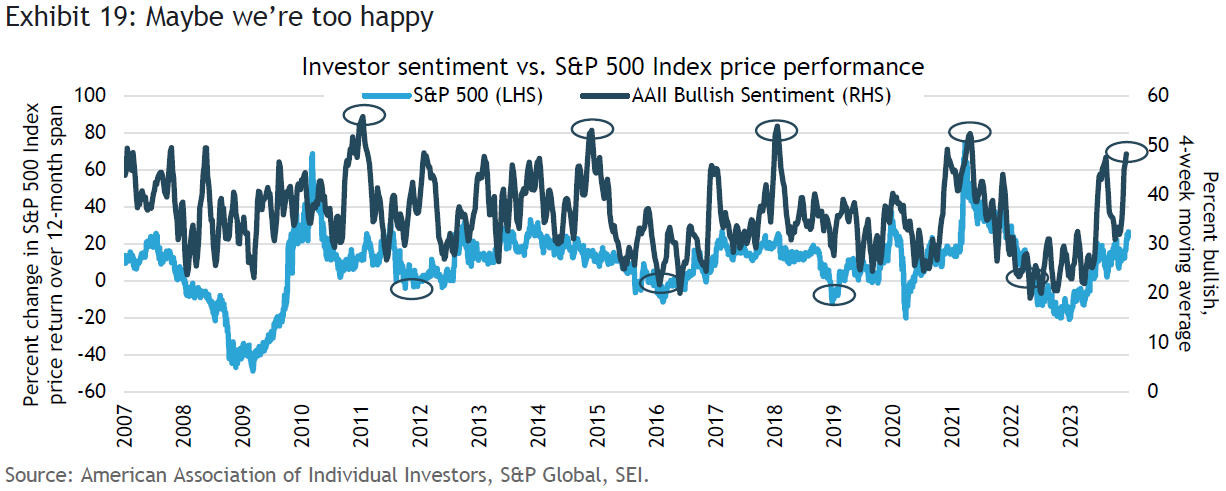
As 2022 came to a close, investor sentiment was quite subdued following a year of sharp declines in stock and bond prices. Surveys of investor sentiment, which we highlight in Exhibit 19, were near historically low levels for both institutional and retail investors. Now, investor optimism has rebounded toward the highs registered in 2021. Investor sentiment typically follows the performance of the stock market. Although the investor sentiment numbers are very volatile, peaks and troughs occur around the peaks and troughs of the year-over-year change in the S&P 500 Index. The percentage of bullish investors are currently approaching highs that have been recorded on only a few occasions since 2009—in January 2011, November 2014, January 2018, and April 2021. Twelve months later, stock prices, as measured by the S&P 500 Index, were either up slightly or down year-over-year.
The sharp contraction in price-to-earnings (PE) multiples that occurred in 2022 was also notable. At the end of 2021, the forward price-to-earnings ratio on large-cap U.S. equities was 22.5, well above the 10-year average of 18.1. At the end of 2022, the forward PE multiple had contracted to 17.1, representing a modest discount to its longer-term average. The technology sector bore the brunt of this correction, tumbling from a year-end 2021 value of 29.3 to a year-end 2022 reading of 19.4 (a level slightly below its average for the previous 10 years).
At the time, we thought any rally that might take hold from these more attractive levels would stall out rather quickly. It was our view that bond yields would rise further in 2023, which would place additional downward pressure on the PE multiples of highly valued growth stocks, including technology. At the end of 2022, the yield on the benchmark 10-year U.S. Treasury note was 3.88%. If we had been told ahead of time that the bond yield would approach 5% in October of 2023, we probably would have been even more cautious on technology than we already were. What we failed to appreciate, though, was the huge impact advances in artificial intelligence (AI) would have on the outlook for the major companies that appear to be in the best position to benefit, including Nvidia, Microsoft, and Alphabet.
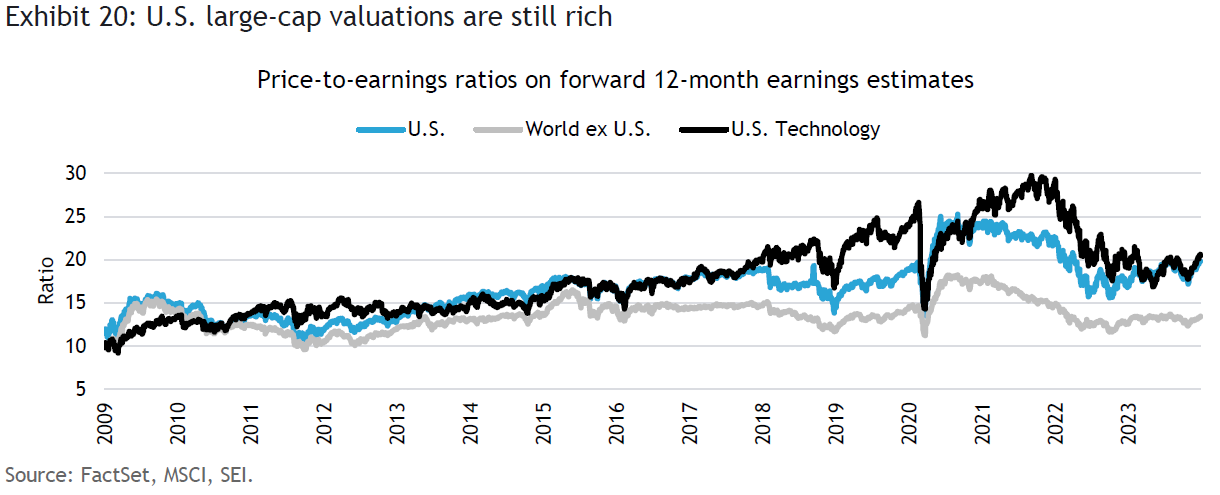
Even after the sharp rise in the so-called “Magnificent Seven” mega-cap technology stocks, the forward PE multiple for technology stocks do not look particularly stretched due to their strong earnings performance in 2023. Exhibit 20 tracks the forward PE multiples of the FactSet universe of large-cap stocks, the U.S. technology sector, and the MSCI World ex USA Index. The sharp declines sustained in 2022 brought forward PE multiples of the tech stocks and the overall U.S. large-cap market to more reasonable levels by the beginning of 2023. They have rebounded since, but remain in a middling range versus recent years. Relative to their longer-term history, however, technology and large-cap U.S. equity valuations still look elevated based on earnings estimates that we believe are probably too optimistic. There recently has been a broadening of the rally to include many of those sectors and styles that badly lagged the big technology stocks for most of 2023. While active managers are rooting for the rally to continue, there may be better opportunities in 2024 in a variety of other equity asset classes, including small-cap and international stocks.
With animal spirits running high, it would not be surprising to see this bull market stumble early in 2024. Yet, there are many crosscurrents that make it difficult to forecast the path of financial assets through the year. A weaker-than-expected economy would likely undercut investors’ optimistic earnings growth assumptions. It also could lead to a more aggressive easing in U.S. central-bank monetary policy rates than we anticipate, but a big decline in interest rates already seems to be largely discounted by the markets. More likely, the U.S. economy will not fall off a cliff in the next six months. If it surprises on the upside, however, the Fed will be hard-pressed to find a rationale for cutting rates at all. Under this scenario, company profits may continue to rise, but PE multiples are likely to contract as market participants’ interest-rate-cut enthusiasm wanes.
The path of inflation is likely to be the single most important determinant of the markets’ direction in 2024. That path looks benign at the moment, but we believe it is a mistake to assume that we are heading back to 2% inflation on a sustainable basis. A soft landing of the economy, the widely held view of the day, seems inconsistent with inflation falling below 3% for a prolonged period.
Risk assets traditionally have performed well when the Fed starts to cut interest rates, whether a recession materializes or not. According to statistics compiled by Ned Davis Research, a global provider of independent investment research, the S&P 500 Index (price only) has garnered an average gain of 15.2% over the first 12 months after the Fed begins cutting rates and a recession is avoided. There have been seven instances since 1967, with the last such occasion in 1998. The 12-month gain in the S&P 500 Index is nearly as strong when the Fed begins to cut rates and a recession develops—an average rise of 12.8%. There have been 10 occasions when this has occurred since 1954, most recently in July 2019. Although recent corporate earnings have been subpar or negative, PE multiples have risen sharply.
We are not joining the bullish crowd because large-cap equities are valued richly and PE ratios have increased significantly over the past year. In previous policy-rate-reducing cycles, PE multiples have tended to contract in the year preceding the first rate reduction as investors anticipate economic problems ahead. In our view, that is not investors’ mind-set at the moment.
If we are correct, central banks might not be able to cut interest rates as much as markets are expecting and bond yields are not likely to fall much from here. That would be a problem for equities, but it also would likely be a problem for fixed-income markets. A 10-year Treasury note yield that fluctuates in the 4%-to-5% range seems more likely than a sustained downward shift into the 3%-to-4% area. Credit spreads also are very tight and could be expected to widen in a recessionary environment, perhaps less so in a stagflationary scenario, where economic growth slows but the inflation outlook becomes a greater concern once again. Broad diversification across styles and asset classes is the best way to hedge against the unusually uncertain outcomes facing investors in 2024.
A summary of our views
- The U.S. economy remains relatively healthy in the near-term, especially versus other major advanced countries. Financial conditions are more consistent with continued economic expansion, at least through the first half of 2024. Other major countries are expected to continue on a slow-growth/mildly recessionary path.
- Labor markets are still tight across the major economies, although there are emerging signs of weakness. SEI does not expect a big rise in unemployment, so we are doubtful that wage pressures will subside to levels that are consistent with central banks’ mandated inflation targets.
- Inflation is far from dead, in our opinion. The benign trend observed in recent months is more reflective of normalizing supply chains and the sharp downturn in energy prices in 2023. Underlying cost pressures stemming from higher compensation rates, financing costs, taxes, a move away from China, and the costs of reducing carbon emissions are not likely to fade.
- We think that financial markets are probably pricing in too many policy-rate cuts, especially in the U.S. Although both the BOE and the ECB are rhetorically more aggressive than the Fed, their relatively weaker economies may lead to sharper interest-rate declines in 2024 than actually achieved by the U.S. central bank.
- Fiscal policies are generally quite expansionary. There may be some reduction in government deficit financing as COVID and energy-relief measures disappear. But spending is on automatic pilot in the U.S., and the U.K. has engineered election-year tax cuts. Rapidly rising old-age entitlement expenditures, higher interest expense, a ramp-up in military spending and the long tail of spending programs (semiconductors, infrastructure, green initiatives) will keep government expenditures at generally high levels for the foreseeable future.
- Geopolitical risks remain a concern, but their impact on markets is difficult to forecast. The Israeli-Hamas war still has the potential to escalate, leading to a spike in energy prices. The coming year has a heavy election calendar. The U.S. presidential election could be a source of market instability, but the real impact will be felt by those companies and industries that will be perceived as the winners and losers of a particular outcome.
- Investor sentiment is currently enthusiastic over the prospect of a soft economic landing and a return to 2% inflation. Both bonds and stocks appear overbought on a near-term basis, so some kind of price consolidation would not be surprising. The extent of any correction in risk assets will, of course, depend on changing perceptions regarding economic growth, the corporate-profits outlook, the path of inflation, and central-bank responses.
Index definitions
The Bloomberg Commodity Total Return Index comprises futures contracts and tracks the performance of a fully collateralized investment in the index. This combines the returns of the index with the returns on cash collateral invested in 13-week (three-month) U.S. Treasury bills.
The Bloomberg Long Government/Credit Index, the long-term component of the Bloomberg U.S. Credit Index, tracks the performance of U.S. dollar-denominated investment-grade (rated BBB- or higher by S&P Global Ratings/Fitch Ratings or Baa3 or higher by Moody’s Investors Service) corporate debt and sovereign, supranational, local authority, and non-U.S. agency bonds with a remaining maturity equal to or greater than 10 years. The average maturity is approximately 20 years.
The Bloomberg US Aggregate Bond Index tracks the performance of U.S. securities in the Treasury, government-related, corporate, and securitized sectors. It includes securities that are of investment-grade quality or better, have at least one year to maturity, and have an outstanding par value of at least $250 million.
The Bloomberg US Treasury Inflation-Protected Securities (TIPS) 1–5 Years Index tracks the performance of U.S. Treasury Inflation-Protected Securities (TIPS) with maturities of one to five years.
The ICE BofA US High Yield Constrained Index is a market capitalization-weighted index which tracks the performance of U.S. dollar-denominated below-investment-grade (rated BB+ or lower by S&P Global Ratings and Fitch Ratings or Ba1 or lower by Moody’s Investors Service) corporate debt publicly issued in the U.S. domestic market.
The J.P. Morgan EMBI Global Diversified Index tracks the performance of external debt instruments (including U.S. dollar-denominated and other external-currency-denominated Brady bonds, loans, eurobonds, and local market instruments) in the emerging markets.
The J.P. Morgan Government Bond Index - Emerging Markets (GBI-EM) Global Diversified Index tracks the performance of debt instruments issued in domestic currencies by emerging-market governments.
The MSCI China Index (total return) tracks the performance (including reinvested dividends) of large- and mid-cap stocks in China. The Index’s 151 constituents comprise about 85% of the China equity universe.
The MSCI Frontier Emerging Markets Index is a free float-adjusted (i.e., including only shares that are available for public trading), market capitalization-weighted index that tracks the performance of stocks in 32 frontier emerging-market countries. The index includes 129 constituents, comprising about 85% of the free float-adjusted (i.e., including only shares that are available for public trading) market capitalization in each country.
The MSCI World ex USA Index tracks the performance of the large- and mid-cap segments of equity markets across 22 of 23 developed- market countries--excluding the U.S. The index’s 887 constituents comprise approximately 85% of the free float-adjusted (i.e., including only shares that are available for public trading) market capitalization in each country.
The Russell 1000 Index tracks the performance of 1000 of the largest U.S. equity securities based on market capitalization. The index is a subset of the Russell 3000 Index, which comprises the 3,000 largest U.S. companies, and includes approximately 1,000 of the largest securities based on a combination of their market cap and current index membership.
The Russell 2000 Index tracks the performance of the small-cap segment of the U S. equity market. The index is a subset of the Russell 3000 Index, which comprises the 3,000 largest U.S. companies, and includes approximately 2,000 of the smallest securities based on a combination of their market cap and current index membership.
The S&P 500 Index (price only) is a market-weighted index that tracks the performance (excluding dividends) of the 500 largest publicly traded U.S. companies and is considered representative of the broad U.S. stock market.
The consumer-price index (CPI) measures changes in the price level of a weighted-average market basket of consumer goods and services purchased by households. The personal-consumption expenditures (PCE) price index measures the prices that consumers pay for goods and services to reveal underlying inflation trends. The core PCE price index, the primary inflation monitor used by the Federal Reserve, excludes volatile food and energy prices.
A market-capitalization (market-cap) weighted index assigns the weighting of its underlying stocks proportionally by size as measured by this total value. Many indexes are market-cap weighted so that smaller companies (companies with smaller capitalizations) do not have a disproportionate impact on the performance of the index.
Important information
This material represents an assessment of the market environment at a specific point in time and is not intended to be a forecast of future events or a guarantee of future results. Positioning and holdings are subject to change. All information as of the date indicated. There are risks involved with investing, including possible loss of principal. This information should not be relied upon by the reader as research or investment advice, (unless you have otherwise separately entered into a written agreement with SEI for the provision of investment advice) nor should it be construed as a recommendation to purchase or sell a security. The reader should consult with their financial professional for more information.
Statements that are not factual in nature, including opinions, projections and estimates, assume certain economic conditions and industry developments and constitute only current opinions that are subject to change without notice. Nothing herein is intended to be a forecast of future events, or a guarantee of future results.
Certain economic and market information contained herein has been obtained from published sources prepared by other parties, which in certain cases have not been updated through the date hereof. While such sources are believed to be reliable, neither SEI nor its affiliates assumes any responsibility for the accuracy or completeness of such information and such information has not been independently verified by SEI.
There are risks involved with investing, including loss of principal. The value of an investment and any income from it can go down as well as up. Investors may get back less than the original amount invested. Returns may increase or decrease as a result of currency fluctuations. Past performance is not a reliable indicator of future results. Investment may not be suitable for everyone.
This material is not directed to any persons where (by reason of that person's nationality, residence or otherwise) the publication or availability of this material is prohibited. Persons in respect of whom such prohibitions apply must not rely on this information in any respect whatsoever.
The information contained herein is for general and educational information purposes only and is not intended to constitute legal, tax, accounting, securities, research or investment advice regarding the strategies or any security in particular, nor an opinion regarding the appropriateness of any investment. This information should not be construed as a recommendation to purchase or sell a security, derivative or futures contract. You should not act or rely on the information contained herein without obtaining specific legal, tax, accounting and investment advice from an investment professional.
The views contained herein are not to be taken as advice or a recommendation to buy or sell any investment in any jurisdiction. Our outlook contains forward-looking statements that are judgments based upon our current assumptions, beliefs and expectations. If any of the factors underlying our current assumptions, beliefs, or expectations change, our statements as to potential future events or outcomes may be incorrect. We undertake no obligation to update our forward-looking statements.
The opinions and views in this commentary are of SIEL only unless stated and are subject to change. They should not be construed as investment advice.
Information issued in the UK by SEI Investments (Europe) Limited, 1st Floor, Alphabeta, 14-18 Finsbury Square, London EC2A 1BR which is authorised and regulated by the Financial Conduct Authority. Investments in SEI Funds are generally medium- to long-term investments.
The contents of this document have not been reviewed by any regulatory authority in Hong Kong. You are advised to exercise caution in relation to the offer. If you are in any doubt about any of the contents of this document, you should obtain independent professional advice.
This information is made available in Latin America and the Middle East FOR PROFESSIONAL (non-retail) USE ONLY by SIEL.
Any questions you may have in relation to its contents should solely be directed to your Distributor. If you do not know who your Distributor is, then you cannot rely on any part of this document in any respect whatsoever.
SIEL is not licensed under Israel’s Regulation of Investment Advising, Investment Marketing and Portfolio Management Law, 57551995 (the “Advice Law”) and does not carry insurance pursuant to the Advice Law. No action has been or will be taken in Israel that would permit a public offering or distribution of the SEI Funds mentioned in this email to the public in Israel. This email and any of the SEI Funds mentioned herein have not been approved by the Israeli Securities Authority (the “ISA”).
Issued in South Africa by SEI Investments (South Africa) (Pty) Limited FSP No. 13186 which is a financial services provider authorised and regulated by the Financial Sector Conduct Authority (FSCA). Registered office: 3 Melrose Boulevard, 1st Floor, Melrose Arch 2196, Johannesburg, South Africa.
This material is intended for information purposes only and the information in it does not constitute financial advice as contemplated in terms of the Financial Advisory and Intermediary Services Act.


