Uncertainty reigns supreme. (Long Version)
The first six months of Donald Trump’s presidency have been breathtaking as the administration has attempted to disrupt the status quo—whether in economics, politics, foreign relations, immigration policy, and more. No one can predict the future, but there are times when one can weigh the pros and cons of a situation and make a rationale assessment of what might transpire. This is not one of those times. Today, more than ever, we encourage diversification across geographies as well as across sectors and asset classes.
The first six months of Donald Trump’s presidency have been breathtaking as the administration has attempted to disrupt the status quo in multiple areas—including economics, politics, foreign relations, and immigration policy. The uncertainty is compounded by policy U-turns and over-the-top rhetoric aimed at keeping everyone guessing about Trump’s true intentions. Most recently, the U.S. attack on Iran’s nuclear facilities (coming on the heels of Israel’s attack on Iran and nearly two weeks of back-and-forth military strikes between the two nations) raised the specter of further escalation of the conflict and much higher oil prices. Those fears were quickly brushed aside by the surprise announcement of a ceasefire between Israel and Iran and a de-escalation of tensions between the U.S. and Iran.
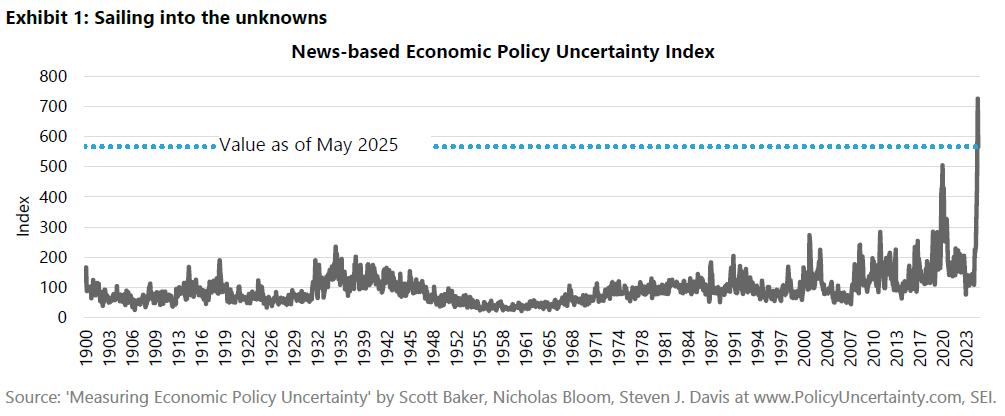
Exhibit 1 highlights one attempt to quantify the extent of uncertainty as it pertains to economic policy. It is based on news references from a database of 10 major U.S. newspapers across the country going all the way back to the year 1900. These references fall into a wide variety of categories, including monetary and fiscal policy, trade policy, regulation, and national security. According to this compilation, policy uncertainty is currently off the charts, although it has come down since April. Nonetheless, it remains higher than the peak recorded in April 2020, when the COVID-19 lockdowns were spreading throughout the U.S. and the world and is far higher than the readings recorded during the First and Second World Wars, the Great Depression, or the Global Financial Crisis of 2008.
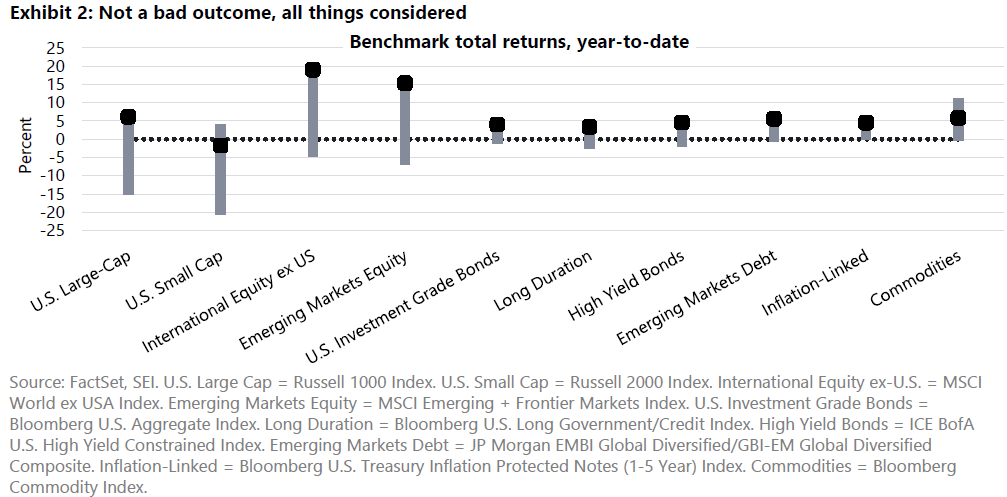
Remarkably, investors have managed to take all this uncertainty in stride. There has been a good deal of volatility, particularly for equities, but as shown in Exhibit 2, a broad grouping of assets is in positive territory for the year to date. International stocks, as measured by the MSCI World ex USA Index, have climbed 18.99% in the year-to-date period through June 30, 2025. U.S. large-cap stocks (represented by the Russell 1000 Index) are up 6.12% but were down by more than 15% in April on a year-to-date basis following the unveiling of so-called reciprocal tariffs. The small-cap Russell 2000 Index has been down much of the year but has come back from an even steeper loss of almost 21% and is down just 1.79% in the year-to-date. Bonds, meanwhile, have posted moderate year-to-date gains, with high-yield, emerging-market and long duration securities all recording a total return of roughly 5.4% over the first half of 2025, close to the performance of U.S. large-cap equities with much lower volatility. Commodities (as measured by the Bloomberg Commodity Index) also have performed well despite the uncertainty surrounding trade and global growth, although the index lost half its year-to-date gain following the ceasefire between Israel and Iran.
Where do we go from here?
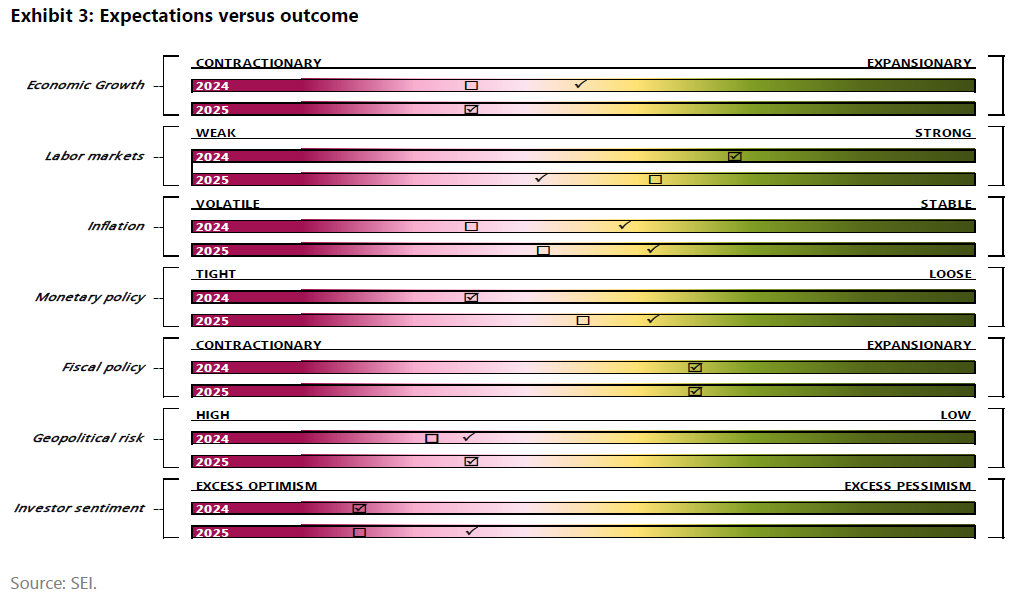
Exhibit 3 provides a stylized depiction of SEI’s 2024 and 2025 views on key economic data points and policy issues. Our original forecast for 2025, made at the end of last year, is represented by the box, while checkmarks represent our best assessment of the outcome in the first half of the year. This is not a quantitative exercise; it is simply meant to illustrate the degree to which our expectations for 2025 have compared to what has happened thus far.
Economic growth
This is a tough one to assess. The wild swings in U.S. tariff policies have had a profound impact on trade flows over the course of the past two quarters. U.S. inflation-adjusted gross domestic product (GDP) fell slightly in the first quarter owing to a surge in imports into the U.S. as companies rushed to get goods shipped into the country before the tariffs took effect. According to the U.S. Bureau of Economic Analysis, gross domestic purchases (GDP minus net exports of goods and services) by contrast, increased at a solid 4.1% annual rate. That compares with a 3.1% gain for all of 2024. The second quarter is shaping up to be much stronger for inflation-adjusted GDP, but that merely reflects the slump in imports. Growth in spending by households and businesses has slowed and inventories are expected to be drawn down.
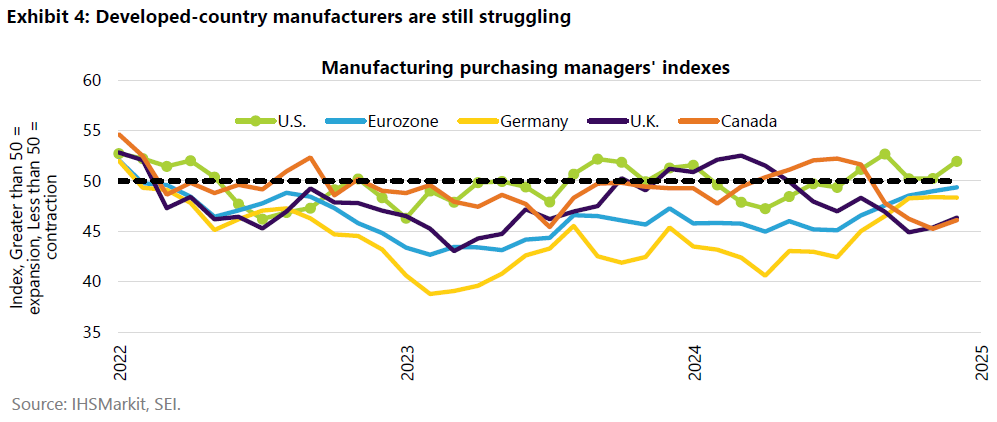
There appears to be some improvement in business activity outside of the U.S. but shifting trade flows make the data hard to interpret. Exhibit 4 tracks the most recent (May) survey of purchasing managers in manufacturing across the major economies. The U.S. continues to be in expansionary territory while the others remain in contraction, although Germany and the eurozone as a whole report some easing of the downward pressure. The composite Purchasing Managers Index, which includes services and other non-manufacturing activities such as construction, shows a more upbeat picture. Among the major developed economies, the U.S. remains at the head of the pack, with Italy, the U.K., and the eurozone reporting modest expansion. Germany and Canada continue to be the laggards, although more expansionary fiscal and monetary policies and a more settled trade picture should provide some relief in the second half of the year.
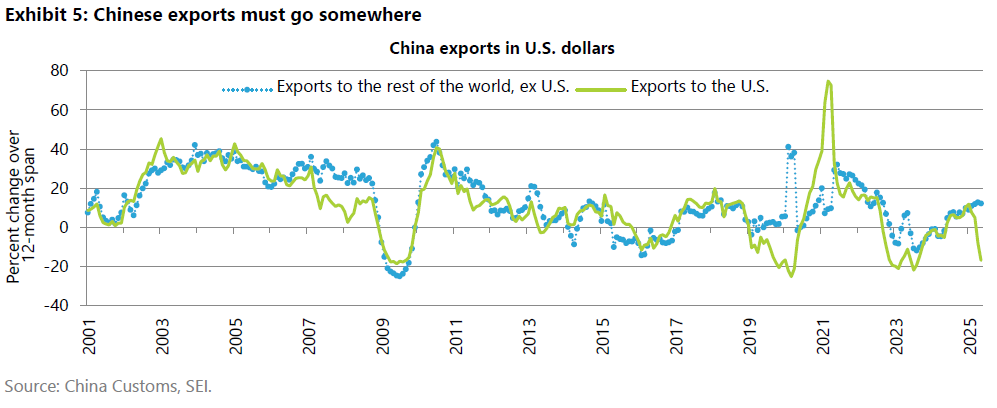
President Trump’s tariff war against China is complicating the picture as the latter country shifts its exports away from the U.S. to other countries. This is pressuring domestic goods-producing industries in both developed and emerging-country economies. As illustrated in Exhibit 5, exports to the U.S. plummeted nearly 17% in May versus the year-earlier reading. Exports to the rest of the world, however, have risen 12%. The last time we saw a divergence like this was in 2019 during the first Trump administration’s trade war with China. The duration of this divergence in Chinese export flows will depend on the how quickly the U.S. and China can reach a compromise in the trade negotiations now underway between the two countries. If the talks fail, other countries would be forced to act against the flood of Chinese goods to bring relief to their domestic manufacturers. Another round of global tariff hikes would almost certainly damage global growth and add to inflationary pressures.
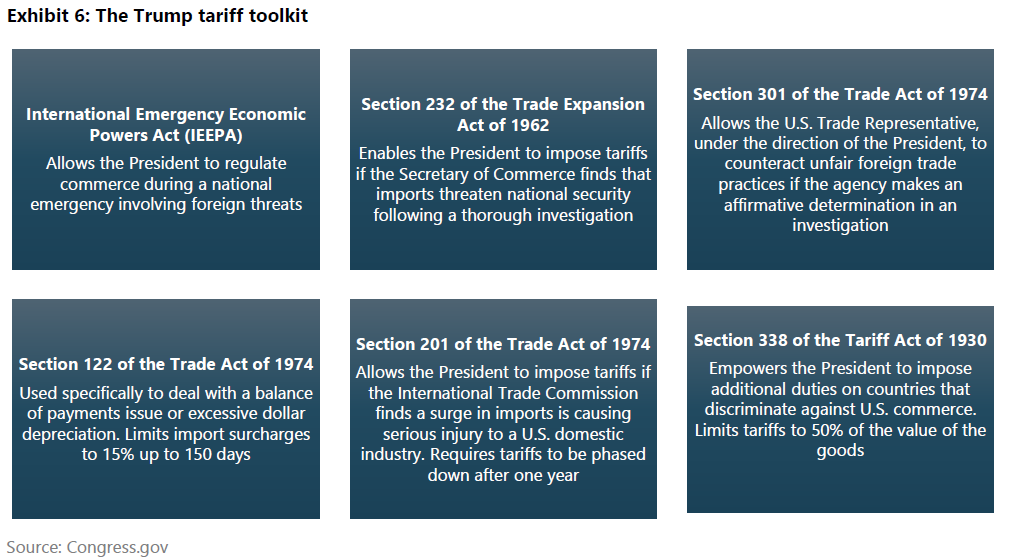
Recent U.S. lower court decisions have taken aim at the reciprocal tariffs, the fentanyl tariffs applied against Canada, Mexico, and China, and the 10% across-the-board levies applied against every country under the International Emergency Economic Powers Act (enacted in 1977). All but the reciprocal tariffs are still in effect, while the lawsuits wend their way through the appeals process. Even if they are overturned, however, there are plenty of tools to provide President Trump with the power to impose tariffs on specific industries and countries. Exhibit 6 provides a summary of the key sections of the tariff laws that the President has at his disposal. Section 232 of the Trade Expansion Act of 1962 and Section 301 of the Trade Act of 1974 were used in President Trump’s first term and have withstood legal scrutiny. It might take time to go through the process prescribed by law, and it may be more focused on specific industries and countries, but there is little question that the President has the authority to impose tariffs up to a high level.
The U.S. Department of Commerce has been conducting studies of the national-security impact of imports on semiconductors, pharmaceuticals, and critical materials; the results of those studies could be released soon. If the 10% across-the-board tariffs are overturned by the courts, the President could still impose across-the-board tariffs of as much as 15% for as long as 150 days under Section 122 of the Trade Act of 1974, although Congressional approval would be needed to extend beyond that 150-day limit. We assume that the average tariff rate across all imported goods will settle in the 10%-to-15% range, with China bearing a heavier burden than other countries.
Labor market conditions
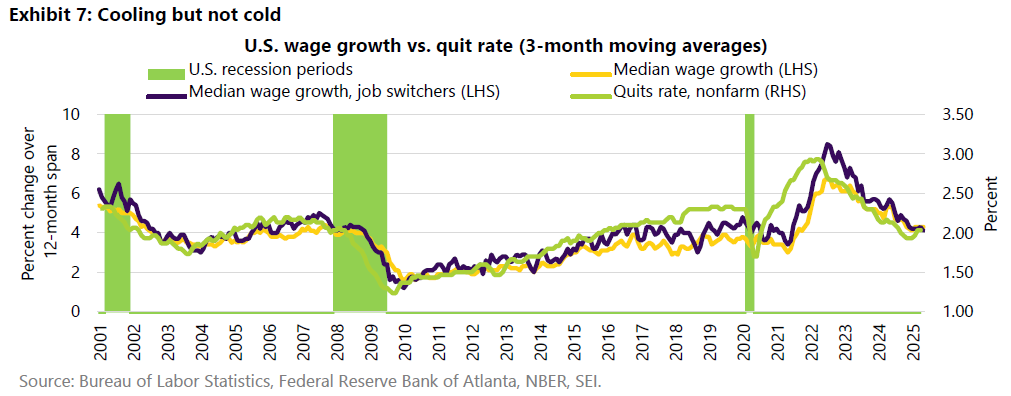
There are signs that the U.S. labor market is softening. While it is not recessionary in character, employment growth has slowed, initial unemployment claims have risen to their highest level in two years, jobseekers are reporting that jobs are harder to get, and the quit rate has declined to its lowest level since 2015. Exhibit 7 highlights the correlation between the quit rate and wage growth. Job-switchers are no longer enjoying outsized wage gains versus all wage earners. Overall wage growth has been holding steady above 4% in recent months, which is consistent with an inflation rate of 2.25%-to-2.75%. This is one reason the policymakers at the Fed are confident that any inflation impulse stemming from the tariffs will likely be short-lived.
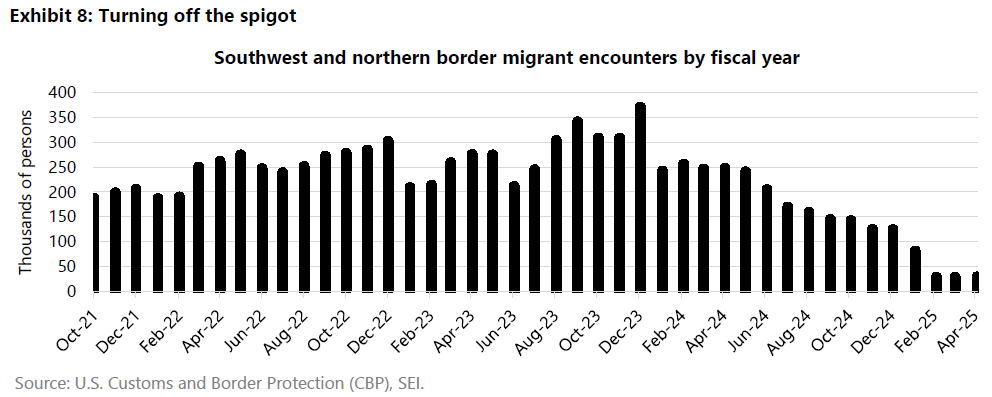
We still judge the economy to be near full employment because labor-force growth is slowing in line with employment growth. According to the U.S. Bureau of Labor Statistics, the U.S. unemployment rate remains quite low at 4.2%, and there is still just one unemployed person per job opening. Companies may be reluctant to hire, but they are also reluctant to let go of their workers despite the uncertain economic environment. Another thing to consider: The Trump administration’s crackdown on immigration may lead to an outright decline in the labor force over the next year. Exhibit 8 shows that migrant encounters at the southern and northern U.S. borders were running at a monthly pace of less than 30,000 between February and May. That compares with a monthly average of 250,000 encounters over the comparable period last year. There are now more encounters at the border with Canada than with Mexico.
In addition, the ramp-up of deportation efforts within the country is causing migrants with work permits to drop out of the labor force to evade detection. The ultimate impact of the Trump administration’s deportation policy is far from clear, but it has the potential to create labor shortages in industries that are highly reliant on unskilled labor such as agriculture, construction, landscaping, leisure and hospitality, and nursing and home care. According to the U.S. Bureau of Labor Statistics, since January 2021, foreign-born workers (including naturalized citizens and H1-B visa holders) have accounted for 70% of the increase in the U.S. civilian labor force. A disruption to that flow will probably keep the unemployment rate low even in a slow-growth economic environment, but it also could lead to upward pressure on wages as companies find themselves bidding for workers.
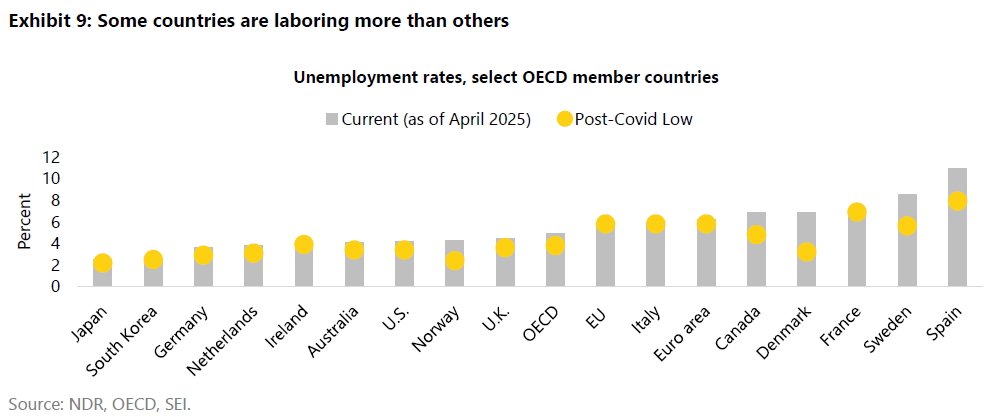
Most Organisation for Economic Co-operation and Development (OECD) member countries continue to enjoy unemployment rates that remain near their cyclical lows despite slow growth. Demographics are certainly playing a role as societies age and participation in the labor force declines. Not all countries have benefited, however. Exhibit 9 compares the current unemployment rates of several OECD-member countries, noting the cyclical lows achieved in the post-COVID-19 period since 2021. Countries that have recorded notable increases in their jobless rates include the Nordic countries (Denmark, Sweden, and Norway), Spain, and Canada. The disruptions to trade caused by the war in Ukraine, the hit to household budgets as mortgage payments quickly escalated with rising interest rates, the difficulty some countries experienced absorbing the influx of migrants into the labor force, and sectoral shifts away from manufacturing as a result of import competition and higher energy costs, are some of the factors that have hurt some economies more than others.
In short, labor markets have softened but, for most countries, the deterioration has been modest.
Inflation
The improvement in inflation varies across countries and regions, but price pressures have subsided more than we projected at the beginning of the year. Exhibit 10 tracks the deceleration in overall consumer-price inflation for the major economies. Canada and the eurozone recorded a year-over-year inflation rate just below 2% in the most recent period ending in May. Consumer prices in the U.S. have climbed 2.4%. The U.K. and Japan are the outliers, with 3.5% price increases. U.K. inflation has spiked owing to a mix of utility cost hikes and one-off calendar events. These include sharp adjustments to energy and water bills, higher vehicle excise duties, and a spike in airfares driven by Easter holiday travel. While many of the idiosyncratic factors pushing prices up lately will reverse or at least flatten out, services inflation in the U.K. remains elevated, with prices rising by 4.5% over the past year. By contrast, Canada’s inflation rate has fallen sharply partially due to the end of the federal carbon tax, causing double-digit declines in gasoline and natural gas prices. Shelter inflation is slowing as well because demand for housing is stalled due to high mortgage rates, lower immigration, and weak employment and wage trends.
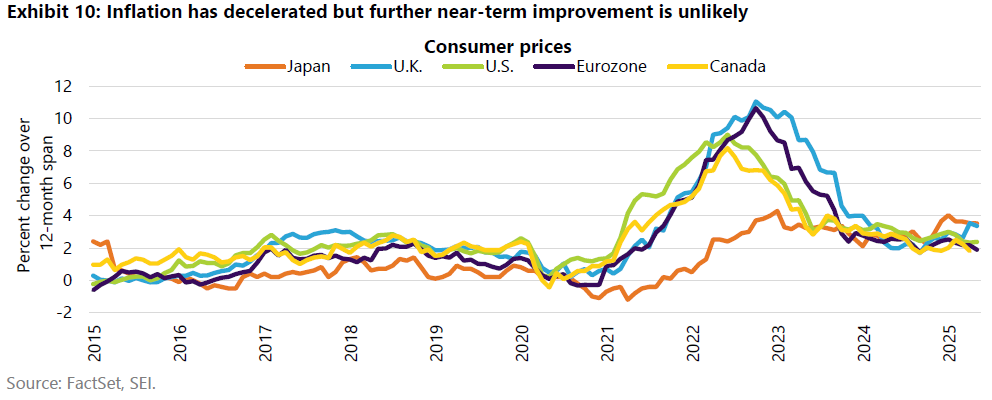
SEI believes that further improvements in inflation among the major economies will be limited, although the U.K. and the U.S. are likely to continue to have more elevated inflation than the other countries owing to stronger wage gains and a larger services sector where inflation tends to be sticky. Although it hasn’t shown up yet in the data, the U.S. is likely to sustain a bump-up in its inflation rate as the cost of the tariffs finally are passed through to consumers. U.S. importers loaded up on goods during the first quarter to avoid paying the tariffs (at least for a while). China, which we noted above will likely face a higher tariff than most, might go back to its old playbook of shipping its goods to a third country that faces lower tariffs. Those goods are then shipped to the U.S. from that third country. This could provide modest price relief. Nevertheless, a quintupling of the tariff rate on imports into the U.S. is no small deal. There is only so much that businesses can absorb in their profit margins, especially for low-cost consumer goods such as apparel and toys.
The Israeli-Iranian war and the attack on Iran’s nuclear facilities have had a rather limited impact on oil and gas prices to date. In fact, crude oil prices have dropped back to where they were just prior to the start of the war. The potential exists for a more serious price spike if the ceasefire breaks down or elements of the Islamic Revolutionary Guard Corps go rogue and attack shipping in the Persian Gulf. That would be enough to reverse the downward trend in inflation and severely disrupt the economies of oil-consuming nations. Under this scenario, the U.S. and Canada would probably face less harm than the U.K., Europe and Asia. This worst-case scenario is unlikely to materialize but, if Iran falls into political and social chaos following its defeat at the hands of the Israelis, one cannot completely rule out the possibility.
Monetary policy
The monetary policies of the major central banks are naturally aligned with the economic conditions of the economies they oversee. The Federal Reserve (Fed) and the Bank of England have been more reluctant than the Bank of Canada and the European Central Bank to cut their policy rates because inflation, while decelerating, is still elevated and more persistent. Low unemployment rates also encourage a wait-and-see approach. The Bank of Japan, meanwhile, continues to slowly normalize its monetary setting, raising its overnight interest rate while other central banks are lowering theirs. Exhibit 11 provides an update of where policy rates currently stand.
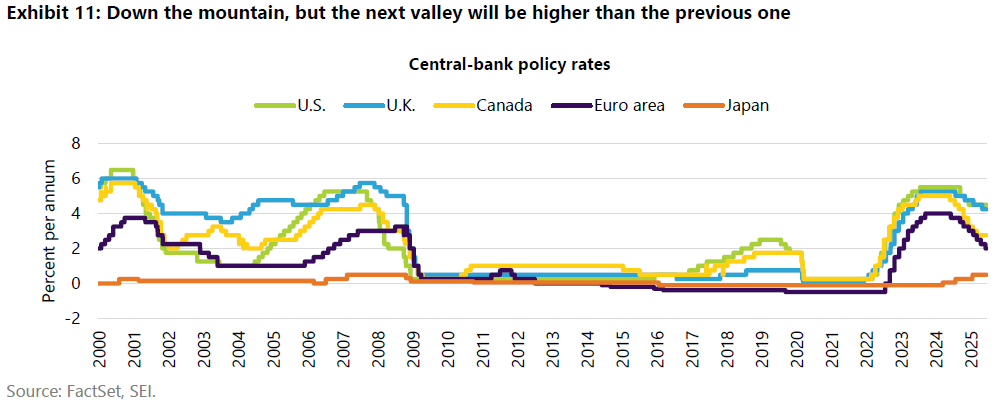
More interest-rate cuts are probably ahead, but the pace of easing in Canada and the eurozone should slow since policy rates are approaching the same level as the current inflation rate. The U.S. and the U.K., on the other hand, probably have more room to cut their respective policy rates, but SEI expects both central banks to be cautious in doing so. At a time when the outlook is so uncertain, all the major central banks are probably more data-dependent than ever. Among the potentially inflationary developments all central banks need to consider: the generally expansive fiscal policies pursued by their governments, the potential for retaliatory tariff hikes that increase prices on targeted goods, and the potential impact of the Israeli-Iranian war on energy prices (now less concerning). Economies appear to be heading in a stagflationary direction, making monetary policy choices more difficult.
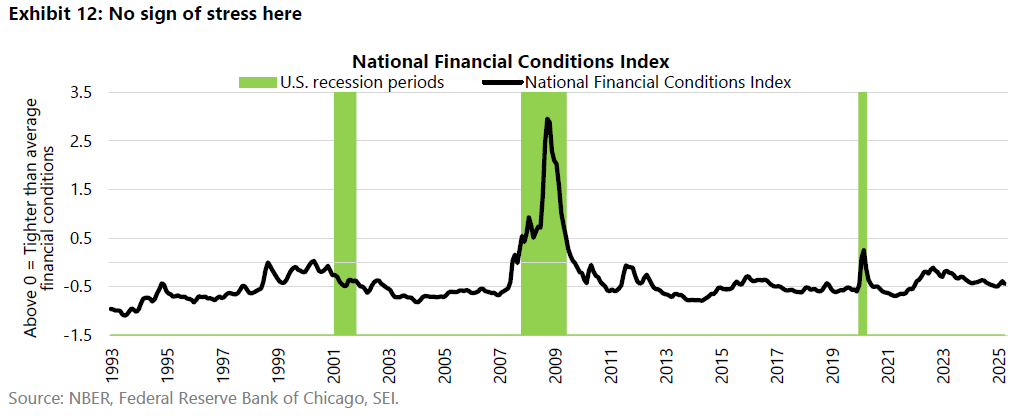
Although it is generally assumed that Fed policy is restrictive, some data suggest otherwise. The Federal Reserve Bank of Chicago’s National Financial Conditions Index (NFCI), highlighted in Exhibit 12, has been easing since September 2022. The NFCI tracks 105 measures of financial activity across money markets, the debt and equity markets, and the banking system. These variables fall into three different categories: risk, credit, and leverage. None of these categories are flashing signs of trouble. Their negative values are historically associated with looser-than-average financial conditions.
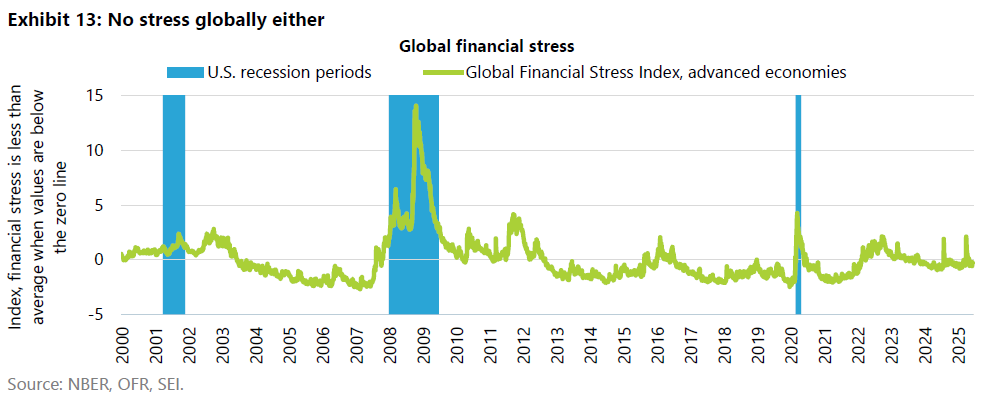
Another measure of financial stress, illustrated in Exhibit 13, looks at global stress for advanced economies. This series is published by the Office of Financial Research (OFR), which is part of the U.S. Department of the Treasury. Like the NFCI, it uses financial market variables such as yield spreads, interest rates and valuation measures. It historically has tended to be more volatile than the NFCI, briefly popping higher (indicating increasing stress) in early April as markets responded badly to the introduction of Trump’s reciprocal tariffs. Financial markets, of course, have calmed quite a bit since then and the stress level is now slightly below average. There does not seem to be much reason for central banks to push the panic button.
Fiscal policy
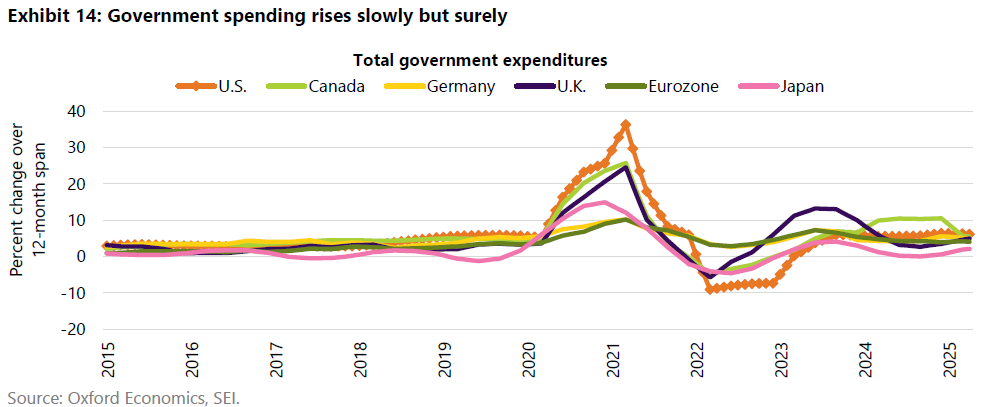
SEI still sees fiscal policy to be on an expansionary track, with the major advanced economies posting general expenditure gains above the inflation rate. Exhibit 14 highlights the year-over-year change in spending. Although we believe the pace of growth should slow through the rest of this year and into 2026 for some economies, nominal expenditures in the U.S. and the eurozone (led by Germany) could record faster growth next year and in 2027. The modification of Germany’s debt brake will accommodate a ramp-up in defense spending and on infrastructure projects. The U.S. appears on track to increase its military expenditures, more than offsetting any savings in discretionary non-defense spending. Changes in eligibility rules for Medicaid (a joint federal and state program that helps cover medical costs for some people with limited income and resources) are also on the table, but they would only serve to make room for the additional tax cuts the Trump administration is seeking to achieve beyond the must-pass extension of the 2017 tax cuts.
In the U.K., the government has been struggling to hit its budget targets. The biggest increases in spending are aimed at addressing the severe problems facing the National Health Service (the U.K.’s publicly funded healthcare system), old-age benefits, improving military preparedness, and providing more funds to schools and for skills development. Other parts of the budget are being squeezed to a lesser or greater degree. Unfortunately, the tax increases pushed through last year by Chancellor of the Exchequer Rachel Reeves have been blamed for slowing the economy. As a result, revenue growth has not been as robust as hoped.
Canada has recorded a sharp reduction in expenditure growth following double-digit gains in 2023 and 2024. The spending splurge in those years reflected large increases in federal transfers (including a C$28.3 billion settlement agreement with the First Nations indigenous peoples), rising social benefits, and higher interest expense. Transfer payments in the form of employment/social development and old-age and health benefits remain big growth drivers. A push to increase defense spending toward the North Atlantic Treaty Organization (NATO) recommended minimum expenditure equaling 2% of GDP is now added to the mix. These drivers of spending have been partially offset by a big decline in statutory spending owing to the termination of the consumer carbon tax and the associated rebates for households and businesses. COVID-19-era pandemic benefits are also coming to an end.
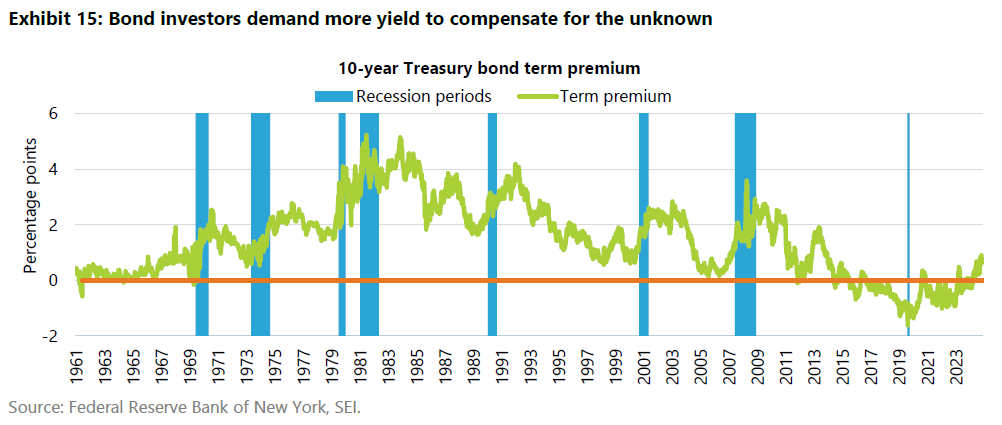
There’s a common theme to the fiscal policies of the advanced economies. The most resources are devoted to old-age benefits, health, and education. Higher interest rates have increased payments on the debt dramatically versus three or four years ago. Military spending is on the rise following more than two decades of slow growth in inflation-adjusted terms. At its recent meeting, NATO allies agreed on an ambitious goal to increase defense spending to 5% of GDP by 2035. Other types of spending are being kept to a tight budget, particularly overseas aid and the programs that are near-and-dear to the party that is out of power. Attempts to close budget gaps through taxes historically have tended to lead to a slower economy. Attempts to grow the economy quickly enough to reduce the fiscal deficit via tax cuts rarely work as advertised. Politicians will not respond until there is a crisis that forces them to make difficult decisions. We don’t seem to be there yet, but the term premia on bonds (the extra yield demanded by investors to buy longer-term debt instruments) has been on the rise. Exhibit 15 tracks the term premium for the 10-year U.S. Treasury note. We think it could climb another 50-to-100 basis points (0.50% to 1.00%) over the next two years, keeping the yield on bonds at current levels or higher, even if the Fed lowers its policy rate two or three times.
Geopolitical risk
Geopolitical risk obviously remains elevated, with the latest focus on the Israel-Iran war and America’s entry into the fray. Outside of the energy complex, there has been little reaction on the part of financial markets. The jump in crude oil prices seemed rather constrained and, as previously noted, have fallen back to pre-war levels. Even the possibility of a rogue operation by Iran’s Islamic Revolutionary Guard Corps aimed at disrupting shipping through the Strait of Hormuz would be irrational and self-defeating. Roughly 95% of Iran’s oil exports is loaded onto tankers docked at Kharg Island, near the northern end of the Persian Gulf. Iran cannot afford to disrupt its neighbors’ exports without disrupting its own. In addition, China, one of Iran’s strategic partners, receives almost half of its imported oil from the Middle East; Iran cannot afford to lose any allies.
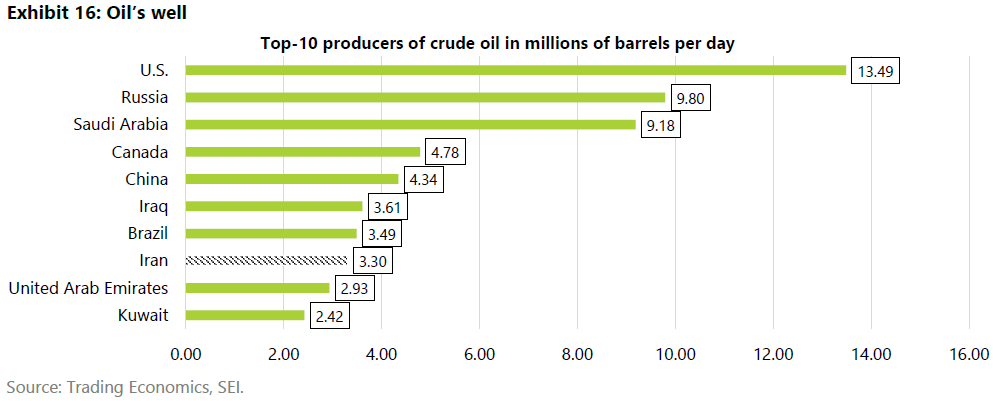
Even in a worst-case scenario in which some sort of supply blockage occurs, SEI assumes that it wouldn’t last long. Oil prices might jump sharply, but the rise would likely be short-lived. In addition, there is plenty of excess capacity to replace Iranian oil production. Exhibit 16 provides a list of the 10 largest producers of crude oil. Iran produces about 3.3 million barrels of oil per day, of which only about two million barrels are exported. Saudi Arabia by itself has enough idled capacity to replace the Iranian crude that would be removed from the market.
A more concerning issue following the attack on Iran’s key nuclear facilities is the possibility of retaliation against U.S. military personnel and assets in the surrounding countries. Iran’s proxies in Iraq and Yemen still have the firepower to lob missiles at U.S. military facilities. Terrorist activity targeting soft targets in Europe and the U.S. itself also cannot be ruled out. One thing is clear: Iran’s foreign policy strategy is in tatters following the military setbacks endured by Hamas and Hezbollah and the fall of the regime of Bashar al-Assad in Syria.
There is also the possibility of regime change in Iran. No one can be sure what that would look like. Unfortunately, regime change can be a very messy affair as different groups vie for power. The Islamic Revolutionary Guard Corps is probably in the best position to take over the country, given its military and economic power. While we are hopeful that political upheaval in Iran would eventually turn out for the better, we would not be surprised if the country remains an implacable enemy of Israel and the U.S. The big difference, obviously, is that Iran will no longer be a nuclear threat. In our view, the political dynamics in the Middle East are undergoing profound change that should play to the advantage of the U.S. once the dust settles.
Investor sentiment
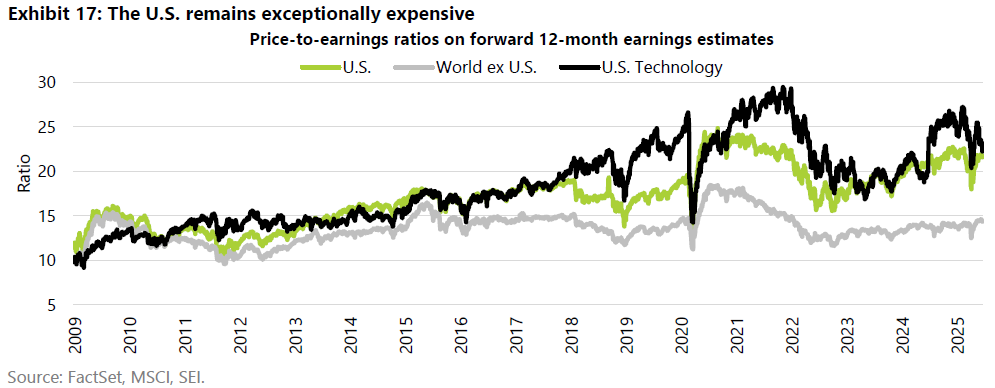
The resiliency of the U.S. equity market has been impressive. The rebound in equity prices from their early-April lows, however, also means that valuations have returned to elevated levels. Exhibit 17 shows that the U.S. technology sector currently sports a multiple of 23 times analysts’ estimated earnings for the next 12 months, while the overall market multiple, based on the MSCI USA Price index, is trading near 22 times. Granted, these valuations are lower than they were in 2024, but so is the growth in earnings. Even after their strong year-to-date performance, equity valuations outside the U.S. are still much lower. To be sure, U.S. companies still enjoy structurally stronger revenue and earnings growth than their global counterparts. But the deep valuation discount outside the U.S. helps to even the playing field. SEI is a strong believer in diversification across geographies as well as across sectors and asset classes.
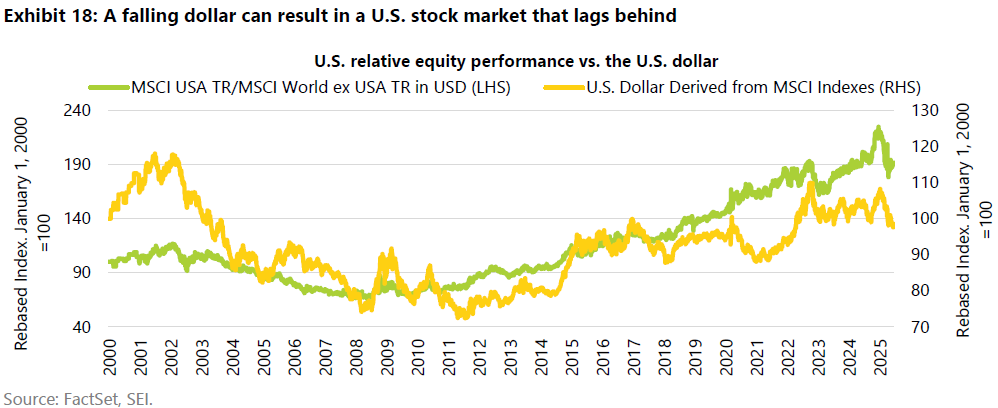
A sustained weakening of the U.S. dollar against other currencies would add to the attractiveness of investing outside the U.S. Exhibit 18 highlights the correlation of the changes in the U.S. dollar versus the relative performance of the MSCI USA Index versus the MSCI World ex USA Index. The MSCI USA Index has tended to underperform on a relative basis in U.S. dollar terms when the greenback depreciates, as was generally the case between 2002 and 2011. By contrast, the relative performance of U.S. equities is superior to that of other developed-world stock markets when the dollar is strong. This was the situation from 2011 to 2022. Of course, there have been shorter periods when the U.S. market has outperformed despite a drop in the dollar’s exchange rate, notably in 2020 and again between 2022 and 24. These were times when America’s advantage in technology and the massive outperformance of the “Magnificent Seven” mega-cap technology stocks was on full display.
The U.S. dollar has been in a broad 10% trading range since October 2022. Over this timeframe, the MSCI USA Index tracked an erratic path relative to the MSCI World ex USA Index. On a relative basis, it is no higher now than it was in October 2022. Exhibit 19 shows the long multi-year cycles that the trade-weighted U.S. dollar has recorded since 1973.
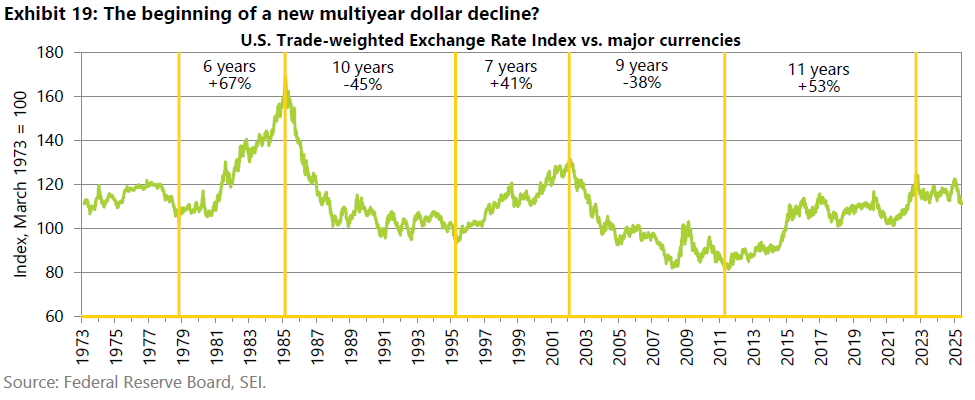
There have been five long-term shifts in the dollar over the past 52 years, lasting between six and eleven years. The last upcycle, from 2011 to 2022, was the longest, with the U.S. dollar gaining 53% from trough to peak. As we mentioned before, the trade-weighted dollar has been in a trading range since October 2022 but has recently broken below the bottom of that range, although it remains to be seen whether the current weakness gathers additional momentum. We do find it telling, however, that there has been little sign of a flight to safety in the dollar as Middle East tensions ratchet higher. The impact of a chronically weak greenback could be the next big story in a year that has been full of big stories.
Glossary
The 10-Year Treasury yield represents the annual interest rate that the U.S. government pays on 10-year Treasury notes, serving as a key benchmark for other interest rates and a barometer of investor sentiment about the economy.
Gross domestic product (GDP) is the total monetary or market value of all the goods and services produced in a country during a certain period.
The “Magnificent Seven” refers to a group of seven mega-cap technology companies (Alphabet, Amazon, Apple, Meta, Microsoft, Nvidia, and Tesla) that have significantly influenced market indices like the S&P 500 due to their strong performance and market dominance.
The Organization for Economic Co-operation and Development (OECD) is an international organization with 38 member countries that works to promote economic growth, prosperity, and sustainable development.
A reciprocal tariff is a tax or trade restriction that one country imposes on another in response to similar actions taken by that country, aiming to create balance in trade by mirroring the tariffs or trade barriers imposed by the other nation.
Stagflation refers to an economic environment of stagnant activity, accelerating inflation, and rising unemployment.
Trade-weighted dollar is an index created by the Federal Reserve to measure the value of the U.S. dollar (USD) based on its competitiveness versus trading partners.
Index definitions
The Bloomberg Commodity Index comprises futures contracts and tracks the performance of a fully collateralized investment in the index.
The Bloomberg U.S. Aggregate Bond Index tracks the performance of U.S. securities in the Treasury, government-related, corporate, and securitized sectors. It includes securities that are of investment-grade quality or better, have at least one year to maturity, and have an outstanding par value of at least $250 million.
The Bloomberg U.S. Long Government/Credit Index tracks the performance of all medium and larger public issues of U.S. Treasury, agency, investment-grade corporate, and investment-grade (rated BBB- or higher by S&P Global Ratings/Fitch Ratings or Baa3 or higher by Moody’s Investors Service) international dollar-denominated bonds with a remaining maturity longer than 10 years.
Bloomberg U.S. Treasury Inflation Protected Notes (1-5 Year) Index
Composite Leading Indicator (CLI) diffusion index measures the proportion of countries whose CLI is rising or remaining unchanged, either month-over-month (MoM) or year-over-year (YoY). This provides insight into the health and directional momentum of the global economy.
The Composite Purchasing Managers Index combines the results of manufacturing and services sector purchasing managers’ indexes (PMIs) to provide a comprehensive overview of economic activity. PMIs track the prevailing direction of economic trends in the manufacturing and service sectors.
The ICE BofA High Yield Constrained Index is a market value-weighted index of all domestic and Yankee high-yield bonds, including deferred interest bonds and payment-in-kind securities, with maturities of one year or more and a credit rating of BB+ or lower by S&P Global Ratings and Fitch Ratings or Ba1 or lower by Moody’s Investors Service, but are not in default.
The MSCI EMU Index (European Economic and Monetary Union) captures large and mid-cap representation across the 10 Developed Markets countries in the EMU.
The MSCI Canada Index tracks the performance of the large- and mid-cap segments of the Canada equity market.
The MSCI Emerging + Frontier Markets (EFM) Index captures large and mid cap representation across 24 Emerging Markets (EM) countries and 28 Frontier Markets (FM) countries.
The MSCI Germany Index measures the performance of the large and mid-cap segments of the German market. With 56 constituents, the index covers about 85% of the equity universe in Germany.
The MSCI Japan Index tracks the performance of the large- and mid-cap segment of the Japanese equity market. The index’s 237 constituents comprise approximately 85% of the free float-adjusted (i.e., including only shares that are available for public trading) market capitalization in Japan.
The MSCI United Kingdom Index measures the performance of the large and mid-cap segments of the U.K. market. With 78 constituents, the index covers approximately 85% of the free float-adjusted market capitalization in the U.K.
The MSCI USA Index tracks the performance of the large- and mid-cap segments of the U.S. equity market. The index’s 624 constituents comprise approximately 85% of the free float-adjusted (i.e., including only shares that are available for public trading) market capitalization in the U.S.
The MSCI World ex-USA Index tracks the performance of the large- and mid-cap segments of equity markets across 22 of 23 developed- market countries--excluding the U.S. The index’s 887 constituents comprise approximately 85% of the free float-adjusted (i.e., including only shares that are available for public trading) market capitalization in each country.
The National Financial Conditions Index (NFCI), calculated by the Federal Reserve Bank of Chicago, tracks 105 measures of financial activity across money markets, the debt and equity markets, and the banking system.
The Russell 2000 Index tracks the performance of the small-cap segment of the U S. equity market. The index is a subset of the Russell 3000 Index, which comprises the 3,000 largest U.S. companies, and includes approximately 2,000 of the smallest securities based on a combination of their market cap and current index membership.
The Russell 1000 Index tracks the performance of 1000 of the largest U.S. equity securities based on market capitalization. The index is a subset of the Russell 3000 Index, which comprises the 3,000 largest U.S. companies, and includes approximately 1,000 of the largest securities based on a combination of their market cap and current index membership.
The U.S. Trade Policy Uncertainty Index measures policy-related economic uncertainty. we construct an index from three types of underlying components: news coverage about policy-related economic uncertainty, tax code expiration data, and economic forecaster disagreement.
The J.P. Morgan Government Bond Index - Emerging Markets (GBI-EM) Global Diversified Index tracks the performance of debt instruments issued in domestic currencies by emerging-market governments.
Important information
This material represents an assessment of the market environment at a specific point in time and is not intended to be a forecast of future events, or a guarantee of future results. Positioning and holdings are subject to change. All information as of the date indicated. There are risks involved with investing, including possible loss of principal. This information should not be relied upon by the reader as research or investment advice, (unless you have otherwise separately entered into a written agreement with SEI for the provision of investment advice) nor should it be construed as a recommendation to purchase or sell a security, including futures contracts. The reader should consult with their financial professional for more information.
Statements that are not factual in nature, including opinions, projections and estimates, assume certain economic conditions and industry developments and constitute only current opinions that are subject to change without notice. Nothing herein is intended to be a forecast of future events, or a guarantee of future results.
Certain economic and market information contained herein has been obtained from published sources prepared by other parties, which in certain cases have not been updated through the date hereof. While such sources are believed to be reliable, neither SEI nor its affiliates assumes any responsibility for the accuracy or completeness of such information and such information has not been independently verified by SEI.
There are risks involved with investing, including loss of principal. The value of an investment and any income from it can go down as well as up. Investors may get back less than the original amount invested. Returns may increase or decrease as a result of currency fluctuations. Past performance is not a reliable indicator of future results. Investment may not be suitable for everyone.
Diversification does not ensure a profit or guarantee against a loss. International investments may involve risk of capital loss from unfavorable fluctuation in currency values, from differences in generally accepted accounting principles or from economic or political instability in other nations. Emerging markets involve heightened risks related to the same factors as well as increased volatility and lower trading volume. Narrowly focused investments and smaller companies typically exhibit higher volatility. Bonds and bond funds will decrease in value as interest rates rise. High-yield bonds involve greater risks of default or downgrade and are more volatile than investment-grade securities, due to the speculative nature of their investments.
Index returns are for illustrative purposes only and do not represent actual portfolio performance. Index returns do not reflect any management fees, transaction costs or expenses. One cannot invest directly in an index.
This material is not directed to any persons where (by reason of that person's nationality, residence or otherwise) the publication or availability of this material is prohibited. Persons in respect of whom such prohibitions apply must not rely on this information in any respect whatsoever.
The information contained herein is for general and educational information purposes only and is not intended to constitute legal, tax, accounting, securities, research or investment advice regarding the strategies or any security in particular, nor an opinion regarding the appropriateness of any investment. This information should not be construed as a recommendation to purchase or sell a security, derivative or futures contract. You should not act or rely on the information contained herein without obtaining specific legal, tax, accounting and investment advice from an investment professional.
SEI sources data directly from FactSet, Lipper, and BlackRock unless otherwise stated.
Information provided by SEI Investments Management Corporation, a wholly owned subsidiary of SEI Investments Company (SEI). They should not be construed as investment advice.
Information issued in the UK by SEI Investments (Europe) Limited, 1st Floor, Alphabeta, 14-18 Finsbury Square, London EC2A 1BR which is authorised and regulated by the Financial Conduct Authority. Investments in SEI Funds are generally medium- to long-term investments.
This document has not been registered by the Registrar of Companies in Hong Kong. In addition, this document may not be issued or possessed for the purposes of issue, whether in Hong Kong or elsewhere, and the Shares may not be disposed of to any person unless such person is outside Hong Kong, such person is a “professional investor” as defined in the Ordinance and any rules made under the Ordinance or as otherwise may be permitted by the Ordinance.
The contents of this document have not been reviewed by any regulatory authority in Hong Kong. You are advised to exercise caution in relation to the offer. If you are in any doubt about any of the contents of this document, you should obtain independent professional advice.
This information is made available in Latin America and the Middle East FOR PROFESSIONAL (non-retail) USE ONLY by SIEL.
Any questions you may have in relation to its contents should solely be directed to your Distributor. If you do not know who your Distributor is, then you cannot rely on any part of this document in any respect whatsoever.
Issued in South Africa by SEI Investment (South Africa) (Pty) Limited FSP No. 13186 which is a financial services provider authorised and regulated by the Financial Sector Conduct Authority (FSCA). Registered office: 3 Melrose Boulevard, 1st Floor, Melrose Arch 2196, Johannesburg, South Africa.
This material is intended for information purposes only and the information in it does not constitute financial advice as contemplated in terms of the Financial Advisory and Intermediary Services Act.
SIEL is not licensed under Israel’s Regulation of Investment Advising, Investment Marketing and Portfolio Management Law, 5755-1995 (the “Advice Law”) and does not carry insurance pursuant to the Advice Law. No action has been or will be taken in Israel that would permit a public offering or distribution of the SEI Funds mentioned in this email to the public in Israel. This document and any of the SEI Funds mentioned herein have not been approved by the Israeli Securities Authority (the “ISA”).
The information contained herein is for general and educational information purposes only and is not intended to constitute legal, tax, accounting, securities, research or investment advice regarding the strategies or any security in particular, nor an opinion regarding the appropriateness of any investment. This information should not be construed as a recommendation to purchase or sell a security, derivative or futures contract. You should not act or rely on the information contained herein without obtaining specific legal, tax, accounting and investment advice from an investment professional.
The views contained herein are not to be taken as advice or a recommendation to buy or sell any investment in any jurisdiction. Our outlook contains forward-looking statements that are judgments based upon our current assumptions, beliefs, and expectations. If any of the factors underlying our current assumptions, beliefs or expectations change, our statements as to potential future events or outcomes may be incorrect. We undertake no obligation to update our forward-looking statements.


