Monthly Market Commentary: Stocks trade up despite looming tariff concerns.
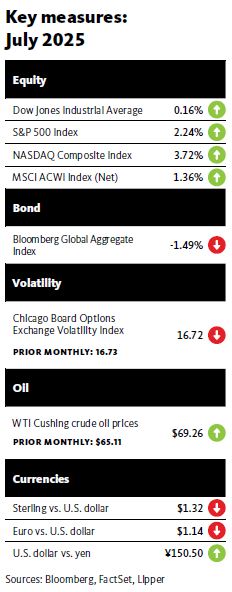
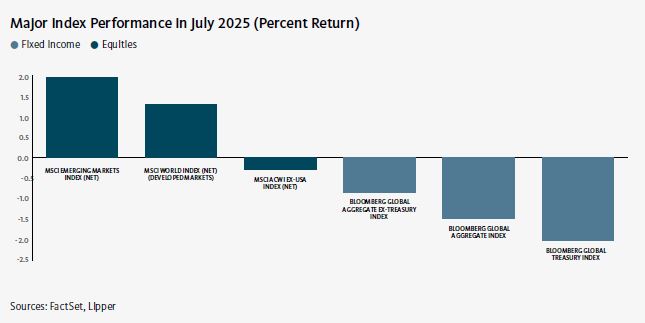
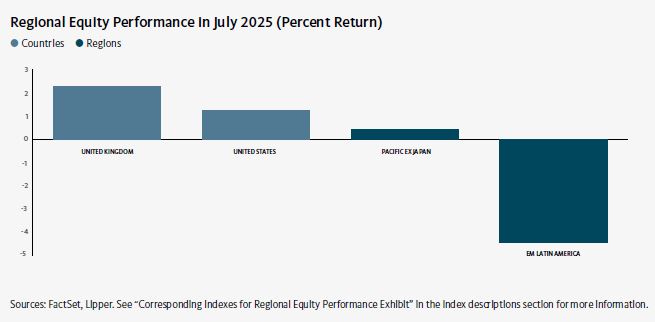
Global equities, as measured by the MSCI ACWI Index, gained ground in July. Investors were encouraged by some clarity on U.S. trade policy before uncertainty resurfaced toward the end of the month. Generally positive corporate earnings reports also bolstered the markets. Emerging markets outperformed developed markets in July, led by Jordan, Egypt, and Morocco. Chinese stocks listed on the Hong Kong Stock Exchange also performed well. Latin America recorded a negative return and was the most notable market laggard for the month. North America was the top performer within the developed markets in July due mainly to strength in the U.S. Additionally, the Pacific ex Japan region benefited from market upturns in Hong Kong and Singapore. In contrast, the Nordic countries were hampered by weakness in Denmark and Norway. The slump in European Union stocks for the month was attributable to a market downturn in the Netherlands.
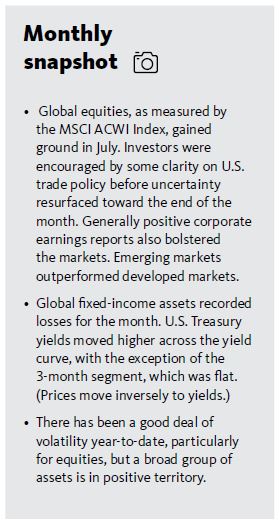
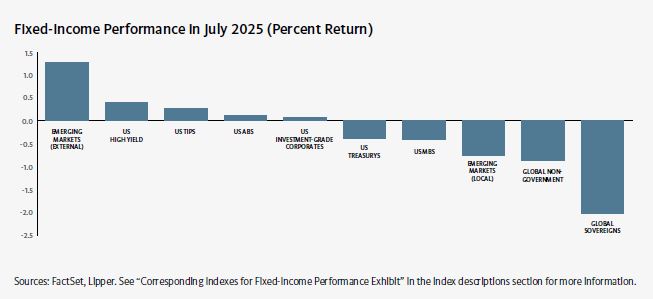
Global fixed-income assets, as represented by the Bloomberg Global Aggregate Bond Index, declined 1.5% (in U.S. dollars) in July. High-yield bonds led the U.S. fixed-income market, followed by investment-grade corporate bonds. Mortgage-backed securities (MBS) and U.S. Treasurys registered losses during the month. U.S. Treasury yields moved higher across the yield curve, with the exception of the 3-month segment, which was flat. Yields on 2-, 3-, 5-, and 10-year Treasury notes rose by corresponding margins of 0.22%, 0.21%, 0.17%, and 0.13% to 3.94%, 3.89%, 3.96%, and 4.37%, respectively. The yield curve remained inverted (3-month yields exceeded 10-year yields) during the month.
Global commodity prices, as represented by the Bloomberg Commodity Index, were down 0.5% in July. Spot prices for West Texas Intermediate (WTI) and Brent crude oil climbed 6.4% and 7.4%, respectively, in July due to ongoing geopolitical tensions regarding the Israel-Iran military conflict in the Middle East, as well as strong demand from emerging markets, particularly Asia and Latin America. The geopolitical tensions also contributed to the 1.2% rise in the gold price for the month as investors sought safe-haven assets. The 11.0% decline in the New York Mercantile Exchange (NYMEX) natural gas price was attributable to softer demand due to reduced industrial activity in several major global economies and rising inventories in the U.S. The wheat price fell 2.8% in July amid concerns about potential trade deals and the possibility of new tariffs.
U.S. trade policy remained a focal point for the global financial markets during the month. On 7 July, Trump extended the deadline for trade deals with several nations from 9 July to 1 August, and threatened tariffs ranging from 25% to 40% on countries that do not reach trade deals with the U.S. by the new deadline. The following day, Trump imposed a 50% levy on global imports of copper beginning 1 August. Copper prices subsequently rose to record highs, increasing costs for numerous industries, including semiconductor and aircraft manufacturers, and data centers. On 9 July, Trump announced a 50% tariff on imported goods from Brazil starting 1 August in response to the Brazilian government’s legal actions against former President Jair Bolsonaro and U.S. technology firms. Bolsonaro has been charged with plotting to overturn Brazil’s 2022 presidential election, a legal action which Trump characterised as “an attack on a political opponent.”
Late in the month, Trump announced that the U.S. had reached trade deals with Japan and the European Union (EU). Under the terms of the agreement with Japan, the U.S. will impose a 15% tariff on imported goods from Japan—a significant reduction from the Trump administration’s previously stipulated 25% tariff. Additionally, Trump said that Japan will invest $550 billion in the U.S., including energy infrastructure and semiconductor manufacturing. The trade deal with the EU includes a 15% tariff—one-half of the 30% tariff the U.S. had initially proposed—on most European exports to the U.S., including cars, pharmaceuticals, and semiconductors. A 50% tariff on imported steel and aluminum will still apply, however. The EU agreed to eliminate tariffs on a wide range of U.S. exports and purchase $250 billion annually in U.S. energy products through 2027. At the end of the month, Trump announced that the U.S. will impose tariffs on numerous countries, but the start date for the levies would be pushed back from 1 August to 7 August. Trump also issued an executive order applying 35% tariffs on imports from Canada, citing his view that the government had failed to stem the flow of fentanyl over the border, along with Canada’s retaliatory tariffs on goods from the U.S. earlier this year. The Trump administration also reached trade deals with several other countries in July, most notably South Korea. The ongoing trade policy developments remain highly volatile and in constant flux.
On the geopolitical front, in late July, the U.S. and Israel recalled their negotiating teams from the Gaza ceasefire talks, citing frustration with Hamas’ response to a proposal for a 60-day truce in the Israel-Hamas military conflict. U.S. special envoy Steve Witkoff accused Hamas of not acting in good faith and showing a “lack of desire” to reach a ceasefire. He stated that the U.S. would now consider “alternative options” to secure the release of hostages and stabilise Gaza. Israel also withdrew its delegation, saying Hamas’ latest response to the ceasefire proposal did not allow for progress without significant concessions. However, Israel indicated it remains open to further discussions.
Economic data
U.S.
It appears that the Trump administration’s tariffs are beginning to have an impact on inflation. According to the Department of Labor, the consumer price index (CPI) rose 0.3% in June, up from the 0.1% rise in May and in line with expectations. Fuel oil costs increased 1.3%, while gasoline and electricity prices rose 1.0%. Conversely, prices for used cars and trucks and new vehicles fell by corresponding margins of 0.7% and 0.3% for the month. The CPI advanced 2.7% year-over-year in June—higher than the 2.4% increase in May and meeting expectations. Costs for utility gas service and electricity climbed 14.2% and 5.8%, respectively, over the previous 12-month period, while gasoline prices declined 8.3%, and fuel oil prices were down 4.7%. Core inflation, as measured by the CPI for all items less food and energy, rose 2.9% year-over-year in June, edging up from the 2.8% annual upturn in May. Housing prices increased 3.6% year-over-year, while costs for medical services and transportation services each were up 3.4%.
According to the advance estimate from the Department of Commerce, U.S. gross domestic product (GDP) increased at an annual rate of 3.0% in the second quarter of 2025—a significant improvement from the 0.5% decline in the first quarter and exceeding expectations. The upturn in the economy in the second quarter was attributable primarily to a notable decline in imports (which are subtracted from the calculation of GDP)—following a surge in imports in the first quarter as businesses rushed to stockpile goods before the Trump administration’s tariffs took effect in early April—as well as an increase in consumer spending. These more than offset downturns in private inventory investment (a measure of the changes in values of inventories from one time period to the next) and exports.
U.K.
The Office for National Statistics (ONS) reported that inflation in the U.K., as measured by the CPI, increased 0.3% in June, edging up from the 0.2% rise in April. The CPI advanced at an annual rate of 3.6% in June, slightly higher than the 3.4% year-over-year increase for the previous month. Restaurants and hotels, transportation, and alcohol and tobacco posted the largest gains in June, while clothing and footwear costs declined. Prices for housing and household services, education, and alcohol and tobacco were up 7.5, 7.5%, and 6.4%, respectively, over the previous 12-month period. Furniture and household goods costs were up just 0.9% year-over-year.
The ONS also announced that U.K. GDP increased 0.7% in the first quarter of 2025 (the most recent reporting period), up from the 0.1% growth rate in the fourth quarter of 2024. Output in the production, services, and construction sectors rose 1.3%, 0.7%, and 0.3%, respectively, over the quarter.
Eurozone
Eurostat pegged the inflation rate for the eurozone at 2.0% for the 12-month period ending in June, slightly higher than the 1.9% annual upturn in May. Costs in the services sector rose at an annual rate of 3.3% in June, edging up from the 3.2% increase in May. Prices for food, alcohol and tobacco increased 3.1% year-over-year in June versus the 3.2% annual rise for the previous month. In contrast, energy prices fell 2.6% year-over-year. Core inflation, which excludes volatile energy, food, and alcohol and tobacco prices, increased at an annual rate of 2.3% in June, unchanged from the year-over-year increase in May.
Eurostat also reported that eurozone GDP rose 0.6% the first quarter of 2025 (the most recent reporting period), representing improvement over the 0.3% growth rate for the fourth quarter of 2024. Eurozone GDP increased 1.5% over the previous 12-month period. The economies of Ireland and Iceland were the strongest performers for the first quarter, expanding 9.7% and 2.7%, respectively. In contrast, GDP in both Denmark and Luxembourg declined 0.5% during the quarter.
SEI’s view
There has been a good deal of volatility year-to-date, particularly for equities, but a broad group of assets is in positive territory. As of July 31, international stocks, as measured by the MSCI World ex USA Index, had climbed 17.6% for the first seven months of 2025. U.S. large-cap stocks, as represented by the Russell 1000 Index, have gained 8.5% so far this year, rallying from a 15% year-to-date decline in April following the unveiling of so-called reciprocal tariffs. At the end of July, the small-cap Russell 2000 Index had surged from a steep loss of nearly 21% and was up 0.9% year-to-date.
The 3.0% rise in U.S. GDP in the second quarter largely reflected a sharp decline in imports. However, growth in spending by households and businesses has slowed, and inventories are expected to be drawn down. Outside the U.S., there appears to be some improvement in business activity, but shifting trade flows present a challenge in interpreting the data. There are plenty of tools available to provide President Trump with the power to impose tariffs on specific industries and countries if the fentanyl, reciprocal, and across-the-board levies are overturned by the courts. We still judge the U.S. economy to be near full employment because labour-force growth is slowing in line with employment growth. The Trump administration’s crackdown on immigration may lead to an outright decline in the labour force over the next year.
Regarding monetary policy, more interest-rate cuts are likely ahead, but the pace of easing in Canada and the eurozone should slow since policy rates are approaching the same level as the current inflation rate. The U.S. and the U.K., on the other hand, probably have more room to cut their respective policy rates, but SEI expects both central banks to be cautious in doing so. At a time when the outlook is so uncertain, all the major central banks seem more data dependent than ever. Among the potentially inflationary developments all central banks need to consider: the generally expansive fiscal policies pursued by their governments, the potential for retaliatory tariff hikes that increase prices on targeted goods, and the potential impact of the Israeli-Iranian war on energy prices (now less concerning). Economies appear to be heading in a stagflationary direction, making monetary policy choices more difficult. As Federal Reserve Chair Jerome Powell noted at a news conference following the Federal Open Market Committee meeting on July 30, “you’re being pulled in two directions and you have to decide which of those to go in.”
SEI believes that further improvements in inflation among the major economies will be limited, although the U.K. and the U.S. are likely to continue to have more elevated inflation than the other countries owing to stronger wage gains and a larger services sector, where inflation tends to be sticky. Although it hasn’t shown up yet in the data, the U.S. is likely to sustain a bump in its inflation rate as the cost of the tariffs finally are passed through to consumers. U.S. importers loaded up on goods during the first quarter to avoid paying the tariffs (at least for a while). China, which will likely face a higher tariff than most, might go back to its old playbook of shipping its goods to a third country that faces lower tariffs, which then ships the goods to the U.S. This could provide modest price relief. Nevertheless, a quintupling of the tariff rate on imports into the U.S. is no small thing. There is only so much that businesses can absorb in their profit margins, especially for low-cost consumer goods such as apparel and toys.
Global diversification in equity markets remains a strategic investment theme for SEI, along with our preference for active portfolio management. Despite the “Magnificent Seven” mega-cap tech stocks, which trade at an average of nearly 30 times future earnings, dominating performance during the second quarter after faltering to start the year, we continue to expect broader participation from U.S. equity sectors and capitalizations in the latter half of 2025.
Within the fixed-income markets, credit spreads remain relatively tight yet yields and income are attractive. We continue to prefer securitised credit over corporate debt given the favourable risk-adjusted yields. In our view, asset classes such as collateralised loan obligations (CLOs) look particularly attractive at this stage of the cycle.
Glossary of Financial Terms
Yield is the income returned on an investment, such as the interest received from holding a security. The yield is usually expressed as an annual percentage rate based on the investment’s cost, current market value, or face value.
Yield curve represents differences in yields across a range of maturities of bonds of the same issuer or credit rating (which is used to assess the risk of default of companies or countries). A steeper yield curve represents a greater difference between the yields. A flatter curve indicates that short- and long-term yields are closer together.
Index definitions
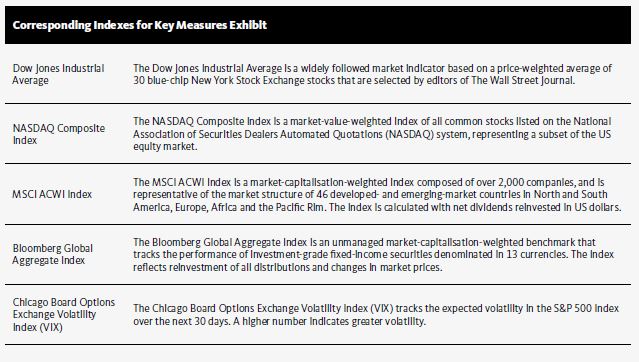
The MSCI ACWI Index is a market capitalization-weighted index that tracks the performance of over 2,000 companies, and is representative of the market structure of 48 developed and emerging-market countries in North and South America, Europe, Africa, and the Pacific Rim. The index is calculated with net dividends reinvested in U.S. dollars.
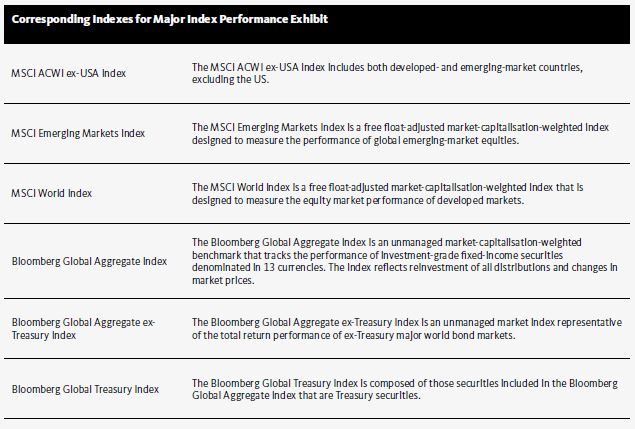
The Bloomberg Global Aggregate Bond Index is a market capitalization-weighted index that tracks the performance of investment-grade (rated BBB- or higher by S&P Global Ratings/Fitch Ratings or Baa3 or higher by Moody’s Investors Service) fixed-income securities denominated in 13 currencies. The index reflects reinvestment of all distributions and changes in market prices.
The ICE BofA U.S. High Yield Constrained Index is a market value-weighted index of all domestic and Yankee high-yield bonds, including deferred interest bonds and payment-in-kind securities, with maturities of one year or more and a credit rating of BB+ or lower by S&P Global Ratings and Fitch Ratings or Ba1 or lower by Moody’s Investors Service, but are not in default.
The ICE BofA U.S. Corporate Index includes publicly issued, fixed-rate, nonconvertible investment-grade (rated BBB- or higher by S&P Global Ratings and Fitch Ratings or Baa3 or higher by Moody’s Investors Service) dollar-denominated, U.S. Securities and Exchange (SEC)-registered corporate debt having at least one year to maturity.
The S&P US Mortgage Backed Securities Index tracks the performance of U.S. dollar-denominated, fixed-rate and adjustablerate/hybrid mortgage pass-through securities issued by Ginnie Mae (GNMA), Fannie Mae (FNMA) and Freddie Mac (FHLMC).
The ICE BofA U.S. Treasury Index tracks the performance of the direct sovereign debt of the U. S. government.
The Bloomberg Commodity Index tracks the performance of futures contracts on physical commodities. The index comprises 24 of the most traded commodity futures contracts across six sectors.
Consumer-price indexes measure changes in the price level of a weighted-average market basket of consumer goods and services purchased by households. A consumer price index is a statistical estimate constructed using the prices of a sample of representative items whose prices are collected periodically.
The MSCI World ex USA Index tracks the performance of the large- and mid-cap segments of equity markets across 22 of 23 developed- market countries--excluding the U.S.
The Russell 1000 Index tracks the performance of 1000 of the largest U.S. equity securities based on market capitalization. The index is a subset of the Russell 3000 Index, which comprises the 3,000 largest U.S. companies, and includes approximately 1,000 of the largest securities based on a combination of their market cap and current index membership.
The Russell 2000 Index tracks the performance of the small-cap segment of the U S. equity market. The index is a subset of the Russell 3000 Index, which comprises the 3,000 largest U.S. companies, and includes approximately 2,000 of the smallest securities based on a combination of their market cap and current index membership.
Important Information
This material represents an assessment of the market environment at a specific point in time and is not intended to be a forecast of future events or a guarantee of future results. Positioning and holdings are subject to change. All information as of the date indicated.
This information should not be relied upon by the reader as research or investment advice, (unless you have otherwise separately entered into a written agreement with SEI for the provision of investment advice) nor should it be construed as a recommendation to purchase or sell a security. The reader should consult with their financial professional for more information. Statements that are not factual in nature, including opinions, projections and estimates, assume certain economic conditions and industry developments and constitute only current opinions that are subject to change without notice. Nothing herein is intended to be a forecast of future events, or a guarantee of future results.
Certain economic and market information contained herein has been obtained from published sources prepared by other parties, which in certain cases have not been updated through the date hereof. While such sources are believed to be reliable, neither SEI nor its affiliates assumes any responsibility for the accuracy or completeness of such information and such information has not been independently verified by SEI.
There are risks involved with investing, including loss of principal. The value of an investment and any income from it can go down as well as up. Investors may get back less than the original amount invested. Returns may increase or decrease as a result of currency fluctuations. Past performance is not a reliable indicator of future results. Investment may not be suitable for everyone.
This material is not directed to any persons where (by reason of that person's nationality, residence or otherwise) the publication or availability of this material is prohibited. Persons in respect of whom such prohibitions apply must not rely on this information in any respect whatsoever.
The information contained herein is for general and educational information purposes only and is not intended to constitute legal, tax, accounting, securities, research or investment advice regarding the strategies or any security in particular, nor an opinion regarding the appropriateness of any investment. This information should not be construed as a recommendation to purchase or sell a security, derivative or futures contract. You should not act or rely on the information contained herein without obtaining specific legal, tax, accounting and investment advice from an investment professional. While considerable care has been taken to ensure the information contained within this document is accurate and up-to-date, no warranty is given as to the accuracy or completeness of any information and no liability is accepted for any errors or omissions in such information or any action taken on the basis of this information.
Index returns are for illustrative purposes only, and do not represent actual account performance. Index returns do not reflect any management fees, transaction costs or expenses. Indexes are unmanaged and one cannot invest directly in an index. Not all strategies discussed may be available for your investment.
Information issued in the UK by SEI Investments (Europe) Ltd, 1st Floor, Alphabeta, 14-18 Finsbury Square, London EC2A 1BR which is authorised and regulated by the Financial Conduct Authority.
The contents of this document have not been reviewed by any regulatory authority in Hong Kong. You are advised to exercise caution in relation to the offer. If you are in any doubt about any of the contents of this document, you should obtain independent professional advice.
This information is made available in Latin America and the Middle East FOR PROFESSIONAL (non-retail) USE ONLY by SIEL.
Any questions you may have in relation to its contents should solely be directed to your Distributor. If you do not know who your Distributor is, then you cannot rely on any part of this document in any respect whatsoever.
Issued in South Africa by SEI Investment (South Africa) (Pty) Limited FSP No. 13186 which is a financial services provider authorised and regulated by the Financial Sector Conduct Authority (FSCA). Registered office: 3 Melrose Boulevard, 1st Floor, Melrose Arch 2196, Johannesburg, South Africa.


