Monthly market commentary: Global equity markets earn their way to gains.
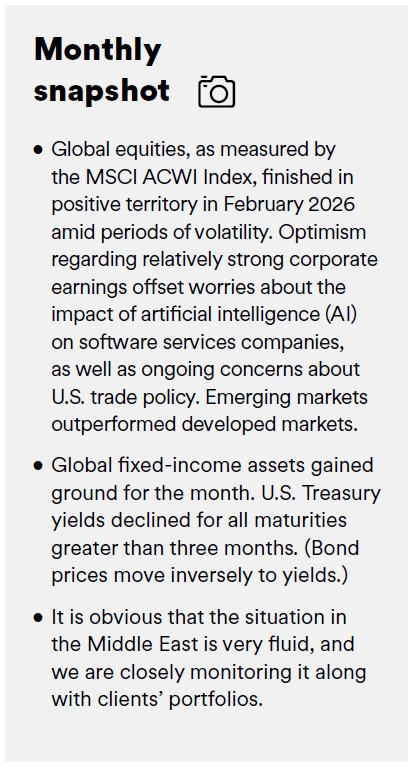
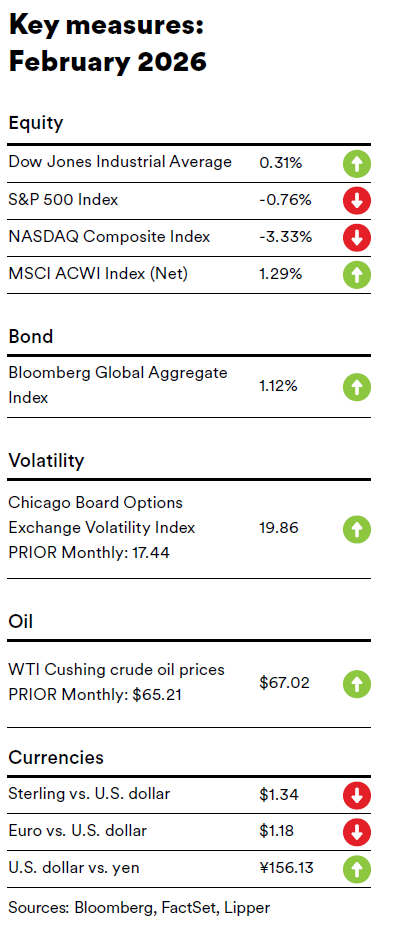
Global equities, as measured by the MSCI ACWI Index, finished in positive territory in February 2026 amid periods of volatility. Optimism regarding relatively strong corporate earnings offset worries about the impact of artificial intelligence (AI) on software services companies, as well as ongoing concerns about U.S. trade policy. Emerging markets outperformed developed markets during the month.
The technology sector lagged the broader global equity market, as measured by the MSCI World Index, in February. New advances in AI systems have the capabilities to write software, create apps, and analyze data, raising investors’ fears that they are threatening the viability of traditional software and data services providers. These worries led to a market rotation away from tech stocks with relatively high price-to earnings multiples, even as corporate earnings generally remained robust.
The Far East and Asia were the strongest performers among the emerging markets in February as both regions benefited from strength in Korea and Taiwan. In contrast, Chinese stocks listed on the Hong Kong Stock Exchange recorded negative returns for the month. The Gulf Cooperation Council (GCC) countries also lagged due mainly to weakness in Saudi Arabia and Qatar. Japan was the top-performing developed-market country within both the Far East and Pacific regions in February; Australia also contributed to the outperformance of the Pacific region. The underperformance of the Nordic countries in February was attributable entirely to a sharp market downturn in Denmark.1
Global fixed-income assets, as measured by the Bloomberg Global Aggregate Bond Index, returned 1.1% (in U.S. dollars) in February. U.S. Treasury securities led the U.S. fixed-income market, followed by mortgage-backed securities (MBS), investment-grade corporate bonds, and high-yield bonds. U.S. Treasury yields declined for all maturities greater than three months. (Bond prices move inversely to yields.) Yields on 2-, 3-, 5-, and 10-year Treasury notes fell by corresponding margins of 0.14%, 0.21%, 0.28%, and 0.29%, ending the month at 3.52%, 3.60%, 3.79%, and 4.26%, respectively. The 10-year to 3-month yield curve narrowed by 29 basis points (0.29%) to +0.30% as of the end of February.2
Global commodity prices, as represented by the Bloomberg Commodity Index, increased 1.1% in February. The spot prices for West Texas Intermediate (WTI) and Brent crude oil climbed 2.8% and 5.1%, respectively, during the month, driven primarily by escalating U.S.–Iran geopolitical tensions and renewed concerns over the security of flows through the Strait of Hormuz, a key shipping channel in the Middle East. The gold price rose 10.6% for the month as investors sought safe-haven assets amid the tensions in the Middle East. The 34.3% decline in the New York Mercantile Exchange (NYMEX) natural gas price in February was in response to warmer weather in much of the U.S., dampening expectations for heating demand. The wheat price jumped 9.9% due to a prolonged period of dry and cold weather, high winds, and wildfire damage in the U.S. Great Plains, particularly Kansas, Oklahoma, and Texas.
On the geopolitical front, in the early morning of February 28, President Donald Trump announced that the U.S. and Israel had launched strikes against several military and government targets in Iran after the Iranian government failed to accept an agreement to end its nuclear enrichment program. The Trump administration warned that Iran could use the enrichment program to develop nuclear weapons. The Iranian government confirmed that the bombing killed Ayatollah Ali Khamenei, Iran’s Supreme Leader. Prior to the military strikes, the U.S. had deployed two aircraft carriers and advanced fighter jets to Israel and evacuated nonessential diplomatic personnel from the region. There has been some collateral damage as Iran has lashed out with strikes not only of U.S. bases but on infrastructure, including oil facilities, and residential areas in the region.
The Strait of Hormuz has been effectively closed (at this point more out of fears among commercial interests in response to the still-low number of attacks that have actually occurred), shutting in a significant amount of global oil capacity. The bombing of Iran marks a significant escalation in an already tense regional dynamic. This action is likely to continue reverberating across diplomatic, security, and economic spheres and raises questions about near-term stability in the region.
U.S. trade policy took center stage again during the month. In a 6-3 decision on February 20, the U.S. Supreme Court ruled that President Trump had exceeded his powers by imposing tariffs without clear authorization from Congress. Chief Justice John Roberts, writing for the majority, said that if Congress had intended to grant a president the extraordinary power to impose tariffs, it would have done so explicitly. The ruling invalidates two major sets of tariffs: a broad levy applied to nearly all U.S. trading partners to address trade deficits, and separate tariffs on Mexico, Canada, and China justified by the administration as a response to fentanyl trafficking. The Supreme Court rejected the administration’s argument that the International Emergency Economic Powers Act (IEEPA), enacted in 1977, implicitly allowed such tariffs. The ruling leaves unresolved whether the government must refund tariff revenue already collected, a question likely to be litigated in lower courts. In a dissenting opinion, Justice Brett Kavanaugh commented that tariff refunds could create major complications for the U.S. Department of the Treasury. On February 21, Trump announced the assessment of a 10% global tariff on imports under Section 122 of the Trade Act of 1974, which authorizes the president to impose temporary tariffs (up to 15% for 150 days) only to “deal with large and serious United States balance-of-payments deficits” or “to cooperate with other countries in correcting an international balance-of payments
disequilibrium.”
Economic data
U.S.
The Department of Labor reported that the consumer-price index (CPI) rose 0.2% in January. Costs for utility gas service climbed 1.0% during the month, while fuel oil and gasoline prices fell by corresponding margins of 5.7% and 3.2%. The CPI advanced 2.4% year-over-year in January—down from the 2.7% rise in December and slightly below expectations. Utility gas service and electricity prices climbed 9.8% and 6.3%, respectively, over the previous 12-month period, while gasoline and fuel oil prices posted corresponding declines of 7.5% and 4.2%. Core inflation, as measured by the CPI for all items less food and energy, increased 2.5% year-over-year in January, down marginally lower than the 2.6% upturn in December and in line with expectations. Costs for medical care services rose 3.9% over the previous 12-month period, while prices for used cars and trucks decreased 2.0%.
According to the advance estimate from the Department of Commerce, U.S. gross domestic product (GDP) expanded at an annual rate of 1.4% for the fourth quarter of 2025—down sharply from the 4.4% gain in the third quarter and well below expectations. The economy expanded 2.2% for the 2025 calendar year, a decrease from the 2.8% growth rate in 2024. The increase in GDP for the fourth quarter was attributable primarily to upturns in consumer spending and nonresidential fixed investment (purchases of equipment and software, and nonresidential structures). Conversely, federal government spending and exports fell during the quarter. There was speculation that the 43-day U.S. government shutdown that ended in mid-November contributed significantly to the quarter-over-quarter drop in GDP. However, in its news release, the Department of Commerce commented, “The full effects of the partial federal government shutdown on the fourth-quarter estimates cannot be quantified…”

U.K.
According to the Office for National Statistics (ONS), inflation in the U.K., as measured by the CPI, fell 0.5% in January, a significant drop from the 0.4% increase in December. Costs for clothing and footwear, furniture and household goods, and transportation posted the largest declines for the month, while healthcare and alcohol and tobacco prices rose sharply. The CPI advanced at an annual rate of 3.0% in January, down from the 3.4% year-over-year upturn in December. Education, alcohol and tobacco, and communication costs were up 5.1%, 4.6%, and 4.6%, respectively, over the previous 12-month period. Conversely, prices for furniture and household goods dipped 0.5% year-over-year, and clothing and footwear prices were flat. Core inflation, as represented by the CPI excluding energy, food, alcohol, and tobacco, increased 3.1% over the previous 12 months, edging down from the 3.2% annual increase in December.3
The ONS also announced that U.K. GDP ticked up 0.1% for the fourth quarter of 2025), matching the growth rate for the third quarter. Output in the production sector increased 1.2% for the quarter, while the construction sector output decreased 2.1% and the services sector was flat.4


Eurozone
Eurostat pegged inflation for the eurozone at 1.7% for the 12-month period ending in January, lower than the 2.0% annual increase in December. Costs in the services sector rose 3.2% year-over-year in January, down slightly from the 12-month advance of 3.4% in December. Prices for food, alcohol and tobacco posted an annual increase of 2.6% year over- year in January versus the 2.5% year-over-year upturn in December, while energy prices declined 4.0% over the previous 12-month period. Core inflation, which excludes volatile energy, food, and alcohol and tobacco prices, rose at an annual rate of 2.2% in January, marginally lower than the 2.3% year-over-year advance in December.5
According to Eurostat’s flash estimate (an early estimate for key economic indicators over the most recent reporting period), eurozone GDP rose 0.3% in the fourth quarter of 2025—unchanged from the growth rate for the third quarter of this year—and increased 1.5% for the 2025 calendar year, down marginally from the 1.6% year-over-year increase in the third quarter. The economies of Ireland, Cyprus, and Poland were the strongest performers for the fourth quarter, expanding 6.7%, 4.5%, and 3.6%, respectively. In contrast, GDP for Romania contracted by 1.6% during the quarter.6
SEI’s view
Despite periods of volatility, most global equity markets garnered positive returns in February. Earnings continued to broaden and AI hyper scalers (large providers of cloud computing and data center services) continued to spend. Additionally, as noted previously, there was a selloff of shares of software and services companies.
AI is clearly a transformative technology, and companies failing to harness it effectively will be left behind. But we expect its benefits to accrue well beyond the few hyper scalers that have enjoyed outsized returns in recent year. While traditional software/SaaS (software as a service) business models may be challenged by increasingly capable agentic AI, real-world complications will inevitably limit the pace of transformation, and software companies will see opportunities to employ AI to their advantage rather than simply being displaced by it. The market does appear to be overreacting, however, to the potential for AI disruption. Both software companies and wealth management firms have attracted sellers seemingly concerned with the ability of AI to not complement but to completely undermine these businesses. We believe this volatility presents substantial opportunities for active managers.
Regarding the conflict in the Middle East, markets never like uncertainty. In 2025, a bombing campaign focused on destroying Iran’s nuclear capabilities lasted 12 days. This 2026 version may be a longer mission with the objective expanded from preventing acquisition of nuclear weapons to effecting regime change. The deaths of Iranian leader Ayatollah Khamenei and other high-ranking individuals are obvious moves in that direction and have been reinforced by public comments from President Trump. However, it’s still quite unclear what a new Iranian government might look like. An election for the next supreme leader has been announced but not scheduled, Iran has some important rival internal factions, and there has, of course, been significant civil unrest in the country for several months.

It is obvious that the situation in the Middle East is very fluid, and we are closely monitoring it along with clients’ portfolios. The conflict is already snarling important supply chains for energy goods, most notably crude oil, which has the potential to spark headline inflation higher in the months ahead, although OPEC+―many of whose Arab country members have long viewed Iran with suspicion if not outright hostility―has voted to increase crude output in response which could provide some marginal relief to higher prices. While there has been a still-limited number of attacks on shipping, seeking to block the Strait of Hormuz would certainly run afoul not only of Mideast rivals, but also China. China may well be Iran’s most important strategic relationship following the fall of the Syrian regime and the materially weaker positions of allied non-state actors Hezbollah and the Houthis. Of course, if the Iranian regime sees its survival at stake, its calculus might become more reckless, and soft targets outside the region could also be targeted. Despite those risks, echoing what we observed in 2025, the continued profound changes in Middle East political dynamics should play to the advantage of the U.S. and other Middle East powers once the latest tensions settle.
There remain quite a few positive trends in the global equity markets. Corporate earnings have been strong and expanding beyond just the megacap technology companies. Earnings expectations for 2026 also remain broadly positive. In the U.S., With 96% of S&P 500 Index constituents reporting fourth-quarter 2025 results as of the end of February, nearly three-fourths posted positive earnings-per-share (EPS) and revenue surprises. The blended year-over-year earnings growth rate (the actual reported earnings growth rates combined with the estimated growth rates for those that have not yet reported) for the S&P 500 was 14.2%―the fifth consecutive quarter of double-digit earnings growth for the S&P 500 Index.7
We maintain our view that the Trump administration has been aware of the possibility of an adverse ruling on the global tariffs for months. Tariffs remain core to President Trump’s economic and foreign policy vision. And while it may take more administrative and legal work to implement the tariffs―and possibly closer cooperation with Congress (Chief Justice John Roberts’ majority opinion emphasized Congress’ authority over the so-called power of the purse)―the administration has already identified workarounds that it plans to pursue. In fact, Trump has already announced that he will immediately impose a 10% global tariff under Section 122 of the Trade Act. Therefore, while the ruling may ultimately lower the effective tariff rate, it is likely to do so only marginally when all is said and done. In light of the Supreme Court’s decision, we believe that in terms of the ongoing tariff dispute, the treatment of refunds is now the largest unresolved question. Should courts rule that importers are entitled to refunds, it has the potential to push up both growth and deficits, all else equal. The makeup of the next Congress will also be a variable to watch as November’s midterm elections draw closer.
We believe that inflation globally is likely to remain stubborn and above most central bank targets. Given the current global economic environment and the substantial stimulus measures expected this year, we believe most investors would benefit from a strategic, broad commodities exposure due to the asset class’s high sensitivity to inflation—particularly during periods of positive economic growth.

GLOSSARY AND INDEX DEFINITIONS
For financial term and index definitions, please see: seic.com/ent/imu-communications-financial-glossary
IMPORTANT INFORMATION
This material represents an assessment of the market environment at a specific point in time and is not intended to be a forecast of future events or a guarantee of future results. Positioning and holdings are subject to change. All information as of the date indicated.
This information should not be relied upon by the reader as research or investment advice, (unless you have otherwise separately entered into a written agreement with SEI for the provision of investment advice) nor should it be construed as a recommendation to purchase or sell a security. The reader should consult with their financial professional for more information. Statements that are not factual in nature, including opinions, projections and estimates, assume certain economic conditions and industry developments and constitute only current opinions that are subject to change without notice. Nothing herein is intended to be a forecast of future events, or a guarantee of future results.
Certain economic and market information contained herein has been obtained from published sources prepared by other parties, which in certain cases have not been updated through the date hereof. While such sources are believed to be reliable, neither SEI nor its affiliates assumes any responsibility for the accuracy or completeness of such information and such information has not been independently verified by SEI.
There are risks involved with investing, including loss of principal. The value of an investment and any income from it can go down as well as up. Investors may get back less than the original amount invested. Returns may increase or decrease as a result of currency fluctuations. Past performance is not a reliable indicator of future results. Investment may not be suitable for everyone.
This material is not directed to any persons where (by reason of that person's nationality, residence or otherwise) the publication or availability of this material is prohibited. Persons in respect of whom such prohibitions apply must not rely on this information in any respect whatsoever.
The information contained herein is for general and educational information purposes only and is not intended to constitute legal, tax, accounting, securities, research or investment advice regarding the strategies or any security in particular, nor an opinion regarding the appropriateness of any investment. This information should not be construed as a recommendation to purchase or sell a security, derivative or futures contract. You should not act or rely on the information contained herein without obtaining specific legal, tax, accounting and investment advice from an investment professional. While considerable care has been taken to ensure the information contained within this document is accurate and up-to-date, no warranty is given as to the accuracy or completeness of any information and no liability is accepted for any errors or omissions in such information or any action taken on the basis of this information.
Index returns are for illustrative purposes only, and do not represent actual account performance. Index returns do not reflect any management fees, transaction costs or expenses. Indexes are unmanaged and one cannot invest directly in an index. Not all strategies discussed may be available for your investment.
Information issued in the UK by SEI Investments (Europe) Ltd, 1st Floor, Alphabeta, 14-18 Finsbury Square, London EC2A 1BR which is authorised and regulated by the Financial Conduct Authority.
The contents of this document have not been reviewed by any regulatory authority in Hong Kong. You are advised to exercise caution in relation to the offer. If you are in any doubt about any of the contents of this document, you should obtain independent professional advice.
This information is made available in Latin America and the Middle East FOR PROFESSIONAL (non-retail) USE ONLY by SIEL.
Any questions you may have in relation to its contents should solely be directed to your Distributor. If you do not know who your Distributor is, then you cannot rely on any part of this document in any respect whatsoever.
Issued in South Africa by SEI Investment (South Africa) (Pty) Limited FSP No. 13186 which is a financial services provider authorised and regulated by the Financial Sector Conduct Authority (FSCA). Registered office: 3 Melrose Boulevard, 1st Floor, Melrose Arch 2196, Johannesburg, South Africa.
SIEL is not licensed under Israel’s Regulation of Investment Advising, Investment Marketing and Portfolio Management Law, 5755-1995 (the “Advice Law”) and does not carry insurance pursuant to the Advice Law. This document and any of the SEI Funds mentioned herein have not been approved by the Israeli Securities Authority (the “ISA”).
This material is intended for information purposes only and the information in it does not constitute financial advice as contemplated in terms of the Financial Advisory and Intermediary Services Act.
For professional clients only. Not suitable for retail distribution.


