The Year Ahead: Riding on Rocky Ground (Long Version)
First, the good news for investors: 2022 is over. As we show in Exhibit 1, both fixed-income and equity markets chalked up big losses last year—almost regardless of region or style.
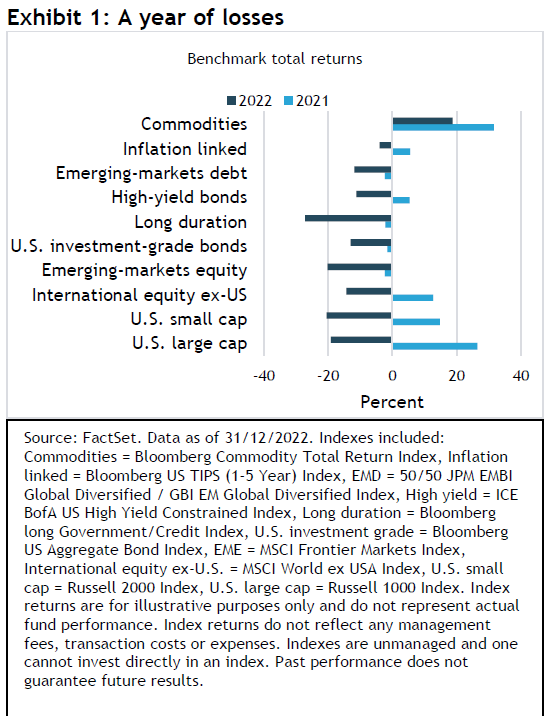
U.S. long-duration bonds (as represented by the Bloomberg Long Government/Credit Index) endured a stunning 27.2% decline, exceeding the sharp losses sustained by U.S. and international equities. While emerging-market equities and bonds fared relatively better, the only asset class to post a positive absolute return for the year was commodities. The Bloomberg Commodity Index, up 18.8% for the year, was also the best performer in 2021.
Now for the bad news: 2023 is shaping up to be another challenging year. Further volatility is expected across asset classes as investors face familiar headwinds: inflation rates exceeding the targets of major central banks; interest-rate increases potentially continuing throughout the first half of the year; quantitative easing shifting to quantitative tightening; and, for many countries, stagnant or recessionary economies through 2023, and perhaps, into 2024.
Exhibit 2 provides a stylized depiction of our 2022 and 2023 views on several key economic data points and policy issues. Our original forecasts for 2022, made at the end of 2021, are represented by the boxes in the top bars for each category; the actual outcomes are represented by check marks. This is not a quantitative exercise. Rather, it is meant to illustrate the degree to which our expectations for 2022 were proven accurate. These forecasts pertain to the U.S., but they would not have been that different for other major developed countries.
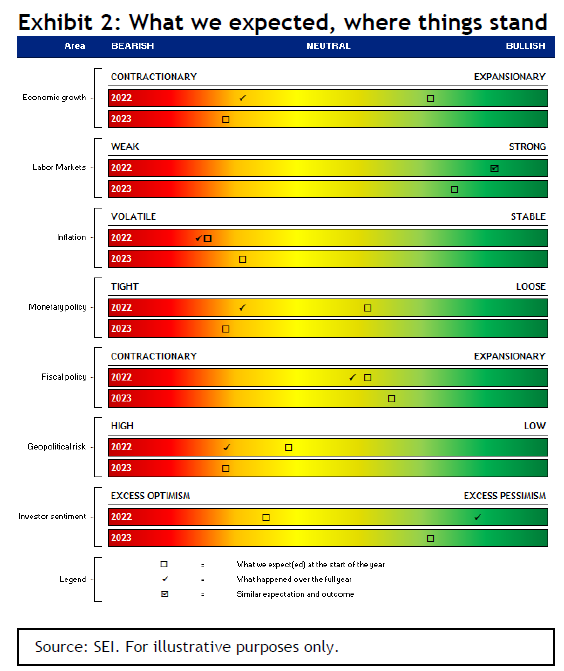
To begin, U.S. economic growth fell well short of our expectations. We thought real gross domestic product (GDP)—the inflation-adjusted total monetary or market value of all goods and services produced in the country—would approach 4% for the 12 months ended December 2022. Instead, an increase of just over 1% in overall business activity now appears likely, due primarily to plummeting labour-force productivity. This stands in sharp contrast to the substantial 3.5% gain in non-farm payroll employment estimated for the period. If workers’ output per hour had increased just 0.5%, our 4% GDP growth expectation would have proven to be correct.
To be sure, productivity rates can swing wildly from one year to the next. Output per hour soared during 2020, for example—to one of the strongest readings in more than 70 years—only to plunge by the second quarter of 2022 to record the second worst year-over-year figure since 1950 (Source: Federal Reserve Economic Data, SEI). When examined over a three-year time frame in order to temper the volatility, the change in productivity moderates. Yet, even on this basis, we expect labour-force productivity to decelerate further in 2023 as the U.S. economy potentially stumbles into a mild recession.
There have been several reasons for the drop in labour productivity since 2020. The most significant factors include the COVID-19-related economic shutdown during the spring of that year and its subsequent reopening, combined with the ongoing supply-chain disruptions that have only just begun to ease. The accelerating pace of retirement among baby boomers has also come into play, given that cohort’s work experience. Labour hoarding may also be a factor as attracting and retaining workers has turned into a major undertaking across many industries. After shedding workers at a phenomenal rate during the COVID-19 lockdown period, most U.S. companies were caught flat-footed by the rapid recovery in consumer demand that followed, first for stay-at-home goods and then for goods and services needed for a more mobile lifestyle. Although growth in consumer demand has slackened, the labour market remains extraordinarily tight; employers have been reluctant to lay off staff, fearing it will be difficult to get them back when better economic times return.
The key to raising workforce productivity is increasing capital intensity (investment in fixed assets, such as property, plant, and equipment) per employee. However, as we show in Exhibit 3, the introduction of labour-saving equipment and processes has slowed.
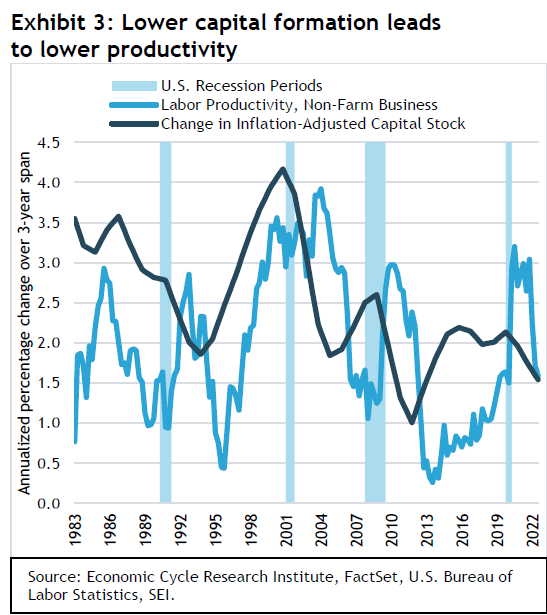
Over the past three years, the economy’s capital stock (plant and equipment) has increased at a pace of only 1.5% annually. The trend in growth has been on the decline since the tech bubble burst in 2000—with peaks and troughs alike progressively lower over the past two decades. Since changes in the capital stock typically lead to changes in labour productivity by two years or more, it will take a while for capital spending to bear fruit—and that’s only if U.S. companies dramatically step up their investing from current levels.
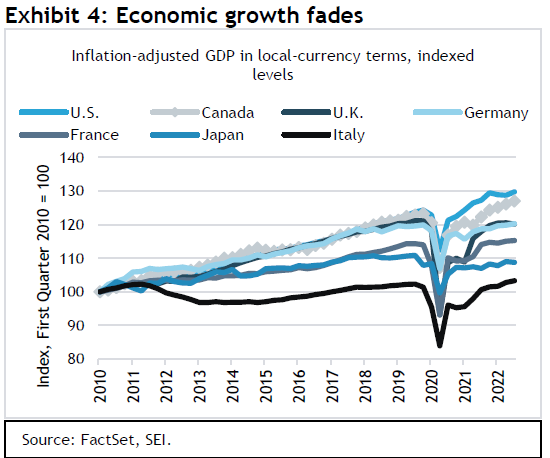
Economic growth in other major countries during 2022 tended to be more robust than in the U.S. through the first half of the year, mostly because they came out of COVID-19 lockdown later than the U.S. That relative vibrancy appears to have faded during the second half of the year. The U.K. reported a quarterly decline in real GDP during the third quarter, raising concerns that its economy has fallen into recession. Japan also recorded a negative reading for the third quarter. In Exhibit 4, we track the GDP levels of major industrial economies from the first quarter of 2010 through the third quarter of 2022. The U.S. and Canada have generally led the pack, although the U.S. has struggled this past year while Canada has recorded steadier growth. Germany and France are still eking out modest gains but, like the U.K., overall business activity is barely above the pre-pandemic peaks. Japan remains below its 2019 high-water mark.
We are penciling in a less robust global economy in 2023 than the one witnessed in the past year. Stagnation is probably the best word for it, while “recessionary” almost certainly will apply in some countries and regions. It is not at all clear to us whether the U.S. will be one of those countries, although surveys of economists published by the Federal Reserve Bank of Philadelphia, the Wall Street Journal, and the National Association of Business Economics suggest a greater than 50% chance of recession. It unusual for economists to be so bearish—we’re only half-joking when we say that this is the most anticipated recession in the history of recessions. Wages are down in inflation-adjusted terms, the housing market is suffering a severe contraction, and some industries (notably within technology) are now losing a significant number of jobs. However, the overall economy still isn’t declining in a pronounced, pervasive, and persistent manner—the so-called “three Ps” that characterize a typical recession.
Payroll employment is one of the key economic variables that has yet to signal a significant downturn in U.S. economic activity. Exhibit 5 is a chart we frequently show as a barometer of the labour situation. It compares the number of job openings to the number of officially unemployed (not employed and actively looking for a job) plus the number of discouraged and inactive workers (unemployed and not actively looking for a job, yet wanting a job) plus those in temporary and part-time positions who want to work full time.
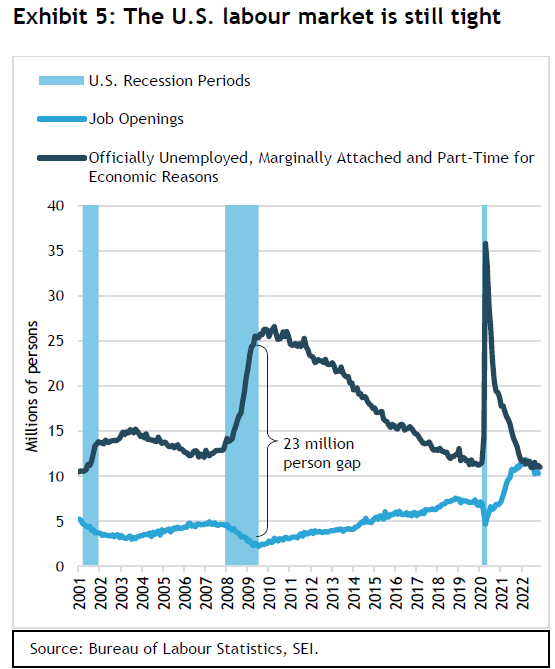
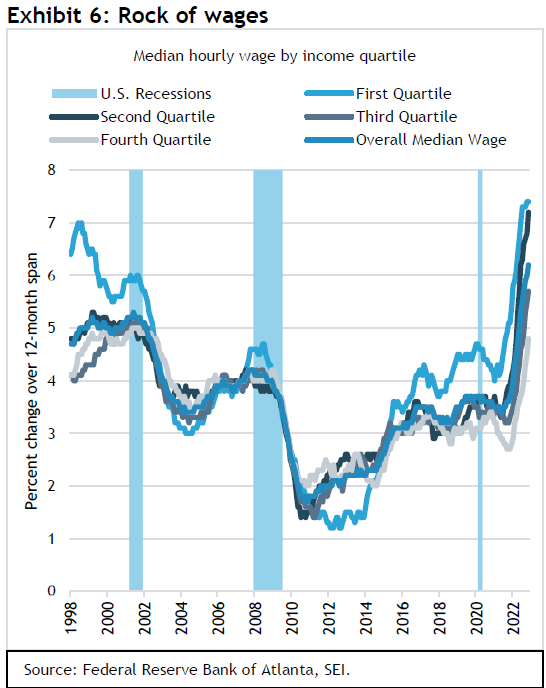
The number of job openings has contracted by more than 1.5 million since March 2022, while the number of unemployed and underemployed persons contracted slightly over the same period. In our opinion, labour-market conditions have not yet eased enough to improve the imbalance in demand and supply; workforce demand and supply remains exceedingly tight compared to previous late-in-the-economic cycle periods. As a result, we do not expect a quick deceleration in wage growth just because there are fewer job listings. As shown in Exhibit 6, the Atlanta Fed’s wage growth tracker indicates that hourly wages in the U.S. have continued to accelerate on a year-over-year basis, slowing only modestly in recent months. The overall median hourly wage index, shown in Exhibit 6, reached 6.2% in November. That’s the sharpest gain in the history of this statistic going back to 1998.
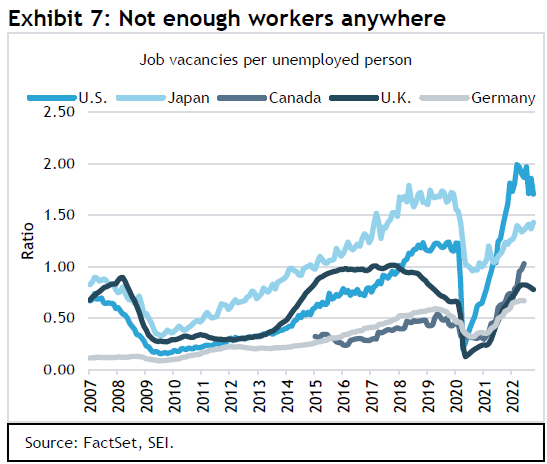
The U.S. is not the only country with a tight labour market. Exhibit 7 compares the number of job vacancies per officially unemployed person for a selection of major economies. While the U.S. has the tightest labour market in terms of the ratio of job vacancies per unemployed person (1.7 to 1), all the countries highlighted in the chart have experienced a significant increase in labour market challenges in recent years. Both Canada and Germany have greater labour challenges now than they did before the pandemic.
However, the U.S. remains the outlier when it comes to sustaining a rapid rise in wages. The Organisation for Economic Co-operation and Development (OECD) publishes quarterly data on total labour compensation for the largest economies, which we highlight in Exhibit 8.
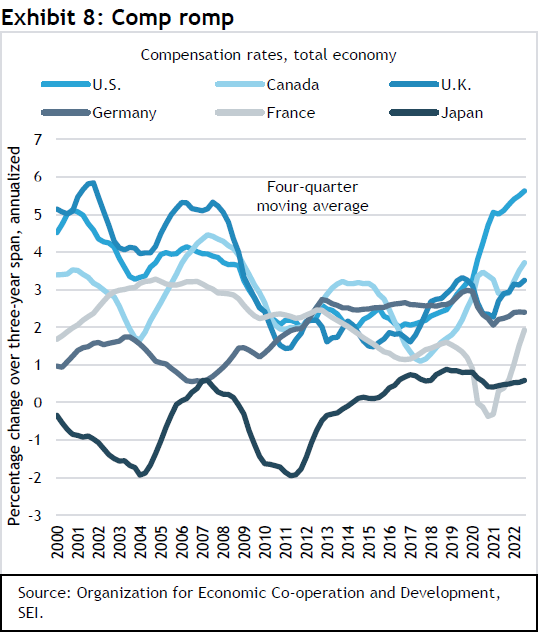
Year-over-year changes are highly variable, so we smooth out the fluctuations by taking a 12-month moving average and tracking the annualized percentage change over a three-year period. Even when one makes these adjustments, it is clear that the U.S. is still undergoing a much sharper compensation acceleration than the other five countries tracked in the exhibit. Both Canada and the United Kingdom, however, have recorded a rising wage-inflation trend that have reached their highest levels since 2009. Compensation gains in France may not be as strong, but they are accelerating quickly.
We noted at the beginning of last year that the United States, the United Kingdom and Canada would likely need to lean hard against accelerating inflation lest it become embedded in their economies. Although inflation rates turned out to be considerably higher than we expected, we warned that the surprises would be on the upside and that the longer-term inflation outlook beyond 2022 appeared worse to us than either central banks or investors were baking into their expectations. SEI still believes this is the case, although we do acknowledge that inflation is now in the process of inflecting lower and the gap between our view and the consensus is much closer now than 12 months ago.
Exhibit 9 tracks the so-called harmonized index of consumer prices, or HICP. This inflation statistic provides a more comparable measure of different countries’ inflation rates than their individually issued consumer-price statistics.
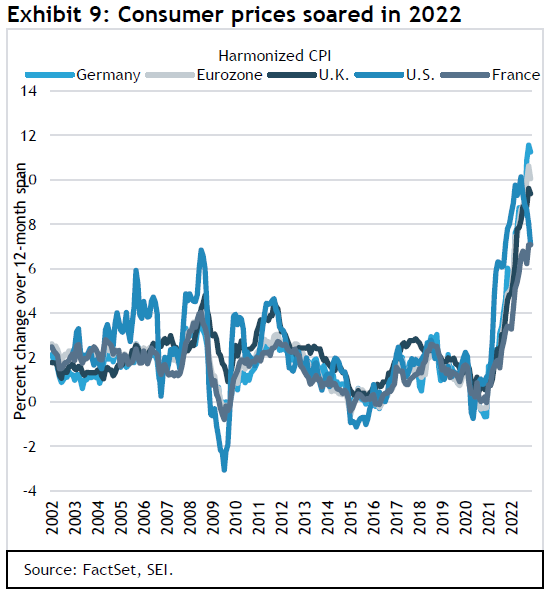
The HICP for the U.S., for example, excludes the costs of owner-occupied housing (one of the more important drivers of the U.S. Department of Labor’s consumer-price index). Under the HICP methodology, the rental-equivalent cost for owner- occupied housing is considered an investment, not consumption, so is left out of the calculation; only the actual cost of renting is included. In any event, the chart highlights the fact that inflation in Europe and the U.K. is now higher than in the U.S. (The U.S. reached a peak of 10.1% in June, but its HICP inflation rate has since retreated to 7.1% as of November.) Germany’s inflation rate as of November was 11.3% above its year-ago level. Inflation in the eurozone as a whole was up 10% as of November, while the U.K. recorded a 9.4% inflation rate.
The collapse in oil and natural gas prices since the summer of 2022 has been raising hopes in Europe that inflation rates are peaking and will soon begin to fall rapidly. However, we are skeptical that the path to a lower inflation rate will be a smooth one. Much of the pullback in energy prices came as a result of an unseasonably mild autumn that reduced heating demand. In addition, to the surprise of most observers, natural-gas storage facilities in Europe managed to reach full capacity in preparation for the winter heating season. This has eased investors’ concerns that businesses would need to be shuttered in order to provide enough energy to heat residences. Although the region will still face a difficult winter, the economic outlook isn’t quite as dire as it appeared to be during the summer.
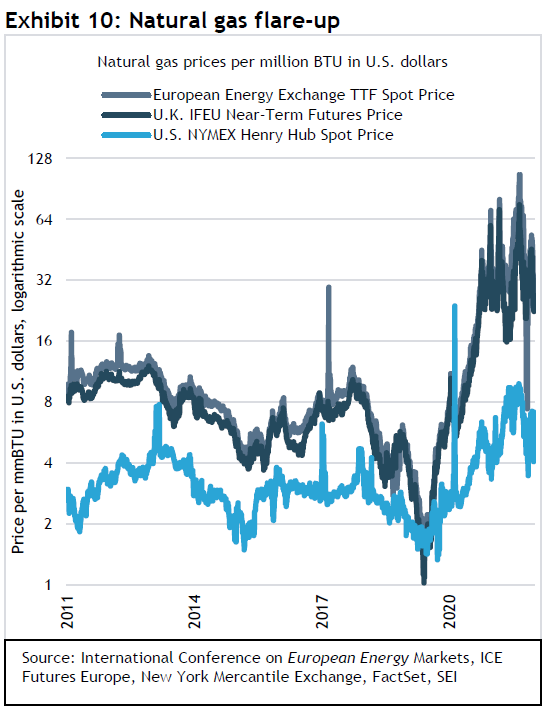
Nevertheless, those ample inventories will now be drawn down to heat homes and businesses; preparing for the 2023-to-2024 heating season will prove even more challenging given the near-total absence of Russian natural gas supplies. Even deliveries of petroleum from Russia could be eliminated, depending on how President Vladimir Putin reacts to the recent imposition of the US$60 per barrel cap on the country’s exports via tanker. It is worrisome that the wholesale price of natural gas in both the eurozone and the U.K. has lost all stability, although the latest move has been to the downside, as we show in Exhibit 10. Clearly, energy prices are likely to remain extraordinarily volatile, dependent on a combination of geopolitics, weather, and economic conditions. If China’s economy comes out of its zero-COVID-19 doldrums, the challenge could become even greater since the Europeans will face a major source of competition for limited supplies of both oil and liquefied natural gas.
As we mentioned above, wages have not been rising as quickly in the euro area as they have in the U.S., the U.K., and Canada. That should help to reduce the pressure on core inflation (excluding food and energy), although there isn’t too much evidence of an easing just yet. Core inflation in the eurozone reached 5% in October, having climbed from its low of 0.7% in July 2021, and has since accelerated in a near-straight line. The bottom line is that inflation will not be tamed easily anywhere. All major economies must endure a prolonged period of slow growth or outright contraction before their labour markets can meaningfully loosen and see an easing of wage pressures.
On the positive side, outsized price increases stemming from supply-chain pressures and port disruptions are subsiding around the globe. The New York Fed publishes a monthly measure of global supply-chain stress. The measure takes into account transportation costs and supply-chain-related components derived from IHS Markit’s purchasing managers’ index—which comprises data from manufacturers across seven interconnected economies: China, Japan, South Korea, Taiwan, the U.K., the U.S. and the euro area—and tries to strip out demand effects in order to isolate the pressures affecting global supply chains.
As Exhibit 11 shows, companies are experiencing far fewer supply-chain issues than was the case this time last year. Although China’s zero-COVID-19 policy continued to cause severe disruptions, the impact generally has not been as extensive as during previous lockdown episodes.
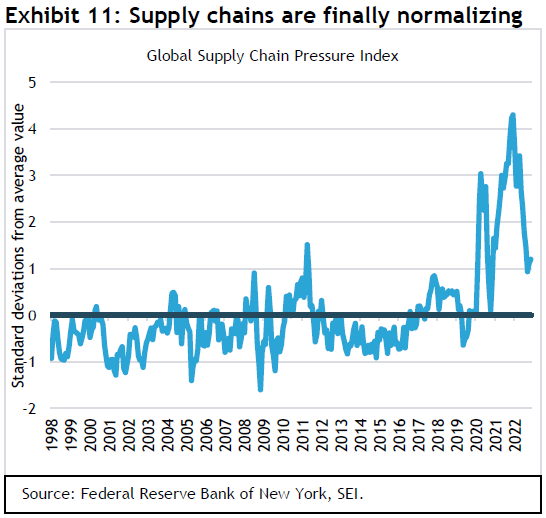
Even the war in Ukraine has had a fleeting impact. Since China is progressively easing its COVID-19 restrictions, we expect supply-chain pressures to subside further in 2023.
There is good reason to believe that inflation has peaked for most countries. Still, we view it as a mistake to assume that prices will fall as quickly as they have risen, or that they will return to the 2% target that central banks of advanced economies set for themselves. This is especially true in the U.S. and other countries challenged by exceptionally tight labour markets and already-high wage inflation.
Exhibit 12 suggests that inflation will remain a problem in the U.S. throughout 2023. The chart highlights the year-on-year change in the headline personal-consumption expenditures (PCE) price index (which includes the more volatile food and energy components). The vertical bars on the chart represent a statistic developed by the St. Louis Fed called the price-pressures measure (PPM). It calculates the probability at 70% or more that PCE inflation will exceed 2.5%, on average, over the next 12 months. This statistic incorporates over 100 different data series, including a variety of price measures, labour-market indicators, financial variables, and measures of inflation expectations.
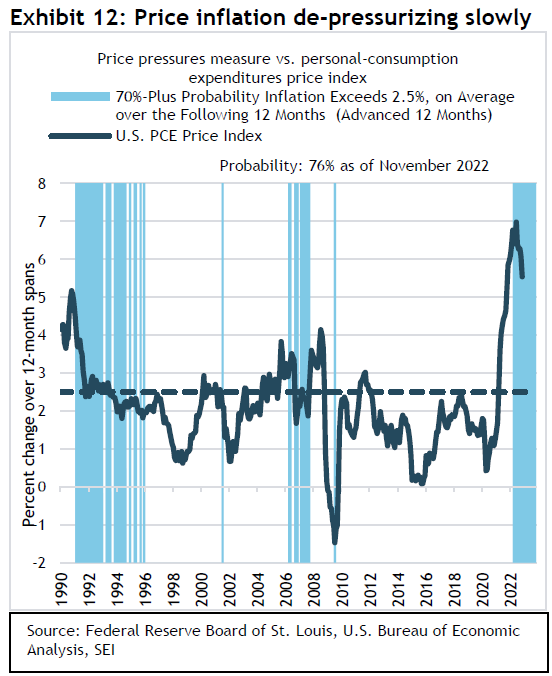
When charting the PPM, we advance the series by 12 months in order to see how the calculated probabilities line up against the actual inflation reported one year later. This exercise reveals that, at the 70% probability level, actual inflation was either at or below the 2.5% mark for much of the period from 1993 to 1996. Conversely, between 2005 and 2008 PCE inflation spent a good amount of time above 2.5%—even during those intermittent periods when the probability level fell below 70%. Most recently, the PPM at the end of October 2022 showed a 76% probability of inflation surpassing 2.5% through much of next year. We think PCE inflation could still be approximately 3.5% one year from now.
Central banks still have work to do
Moving on to monetary policy, we were definitely too optimistic this time last year. However, we did note that a shift toward tighter monetary policies in both the U.S. and elsewhere would occur. We also warned that inflationary pressures would eventually force central banks to become more hawkish than they anticipated. Nevertheless, the Fed surprised us, pursuing a far more aggressive tightening of monetary policy in 2022 than we thought possible, given the institution’s bureaucratic caution and the dovish rhetoric expressed by Fed Chair Jerome Powell and other members of the Federal Open Market Committee (FOMC) throughout the previous year. Even though Powell retired the reference to “transitory” from the Fed’s lexicon when describing inflation, the central bank’s own (and investors’) forecasts still held onto the assumption that inflation pressures would ease substantially in 2022. Consequently, the Fed’s projections of the federal-funds rate issued in December 2021 were well below the actual rate increases that the central bank implemented in the past year.
Exhibit 13 highlights how dramatically the Fed’s expectations have changed. In December 2021, the central bank figured it would raise its policy rate by an aggregate of 75 basis points (three-quarters of a percentage point) to a level of 0.9% by year-end 2022. It would then raise its policy rate another 75 basis points, to 1.6%, in 2023 and an additional 50 basis points, to 2.1% in 2024. The actual outcome was dramatically different, of course, with the funds rate now in the 4.25%-to-4.50% area. Further tightening is expected in 2023, with a year-end median prediction of 5.1% and a central-tendency forecast (incorporating the majority of FOMC decision-makers) of 5.1% to 5.4%. The obvious question is whether this unexpectedly forceful approach taken by the Fed this past year and, presumably, in the year ahead, will be sufficient to bring inflation down. Or will it still prove insufficient, thereby forcing the central bank to keep raising its policy rate beyond its current expectations?
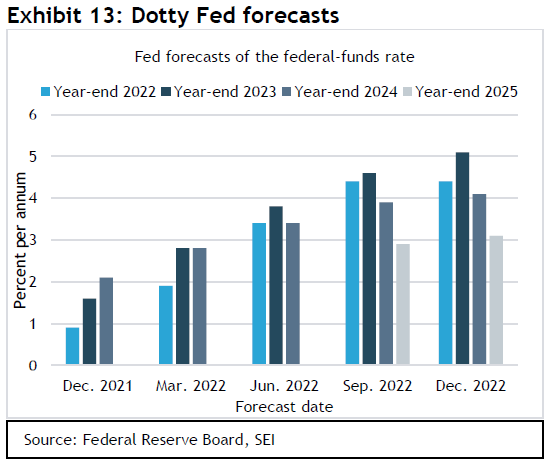
Market-implied pricing of the federal-funds rate suggests that investors and traders think that the Fed will end its tightening cycle by mid-2023, peaking at just under 5%. By year-end 2023, the market-implied funds rate is expected to be trimmed to 4.6%, with additional declines, to 3.6%, by year-end 2024. We are in the camp of the Fed’s more hawkish FOMC members. If there is going to be a surprise, it may still be toward a somewhat higher federal funds in 2023, not a lower one. In our opinion, tight labour markets and a stubbornly resilient U.S. economy will keep inflation higher for longer. The Fed might need to keep probing to find the federal-funds rate at which labour-market slack opens up more significantly and wage pressures finally subside. We see the Fed projection of a 5.1% median peak funds rate as the minimum to be expected. It would not be terribly surprising to see the peak funds rate ultimately reach 5.5%.
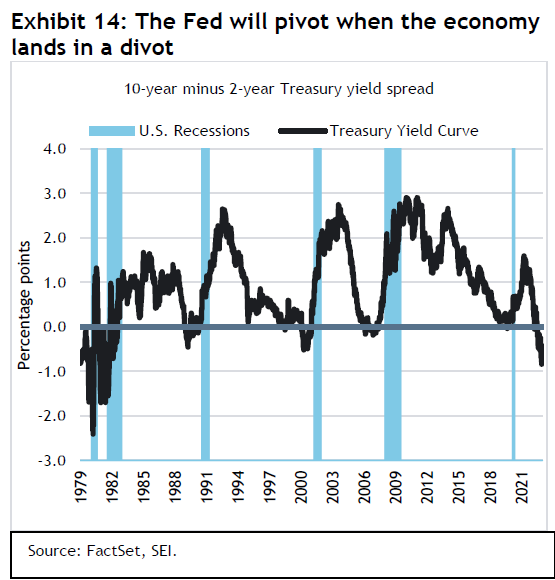
Consensus expectations for a Fed pivot sooner rather than later are probably influenced by the sharp inversion of the 2-to-10-year yield curve spread, which we highlight in Exhibit 14. Two-year Treasury notes are now about 50-to-60 basis points above the yield on the 10-year Treasury note. This is one sign of a tight monetary policy and it has consistently heralded the onset of an economic recession a year or two later. This yield-curve inversion is greater now than at any time in the last 40 years. However, inflation is also a larger problem than it has been at any time in the past 40 years. It is our guess that a major reversal (steepening) in the yield-curve spread could occur sometime in the first half of 2023 (yields and prices move inversely). When that turn comes, the re-steepening of the curve should be sharp and dramatic.
Other central banks also are grappling with how high rates must rise. Exhibit 15 tracks the policy rates of the major central banks.
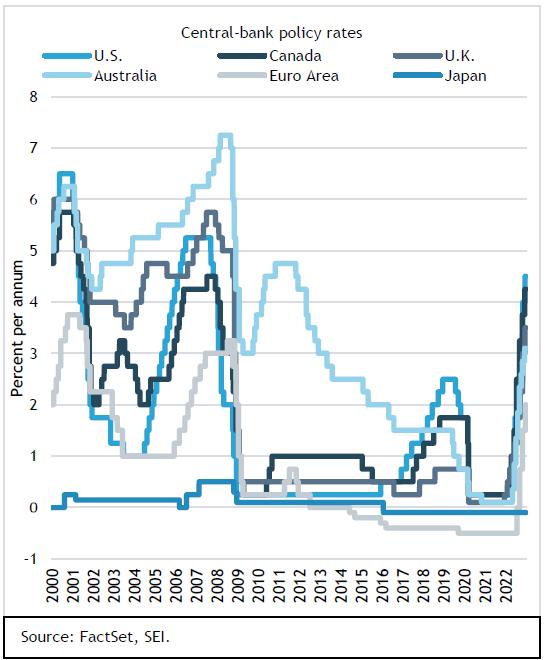
The Fed and the Bank of Canada have been mostly pushing up rates in lockstep with each other. The Bank of England (BOE) has not been quite as aggressive despite the extremely high inflation rate facing the country. Meanwhile, the European Central Bank (ECB) only recently pushed its deposit facility rate up to 2%, less than half the level of the U.S. federal-funds funds rate. During her latest press conference, however, ECB President Christine Lagarde spoke rather forcefully about the need to continue hiking the policy rate. Even Japan, which now has the only negative policy rate in the world, is finally shifting its policy stance from extreme monetary easing. The Bank of Japan (BOJ) modified its yield-curve control policy in December, raising the cap on the government’s 10-year bond from 0.25% to 0.50%.
The hike in interest rates this year certainly has been impressive, especially in the U.S., Canada, and the U.K. However, there is one question that only time will resolve. Which is more impactful—the cumulative rise in interest rates (which has been dramatic) or the actual level of rates (which is still well below levels seen before the global financial crisis of 2007 to 2009) in nominal terms, and still in negative territory relative to the inflation of the past year? Those who think the global economy is quickly falling into recession are putting more weight on the former, while those who expect it to show resiliency and believe inflation will remain well above target (SEI is in that camp), emphasize the latter.
Of course, some countries are more interest-rate- sensitive than others. The U.S., for example, is the only country in the world to offer a 30-year mortgage at a fixed rate for its entire term (Source: International Monetary Fund, OECD) . Those borrowers who have taken advantage in recent years to refinance at levels below 4% and even 3% have not been affected by the surge in rates to 6.5% or more. Home mortgages in France, Germany, and Italy also commonly have a fixed rate between 10 and 25 years. By contrast, mortgages in Canada and the U.K. are fixed for only five years before they reset; borrowers in New Zealand typically face a two-year reset. Countries that have predominantly adjustable-rate mortgages that reset to market levels even more quickly include Australia, Ireland, and South Korea.
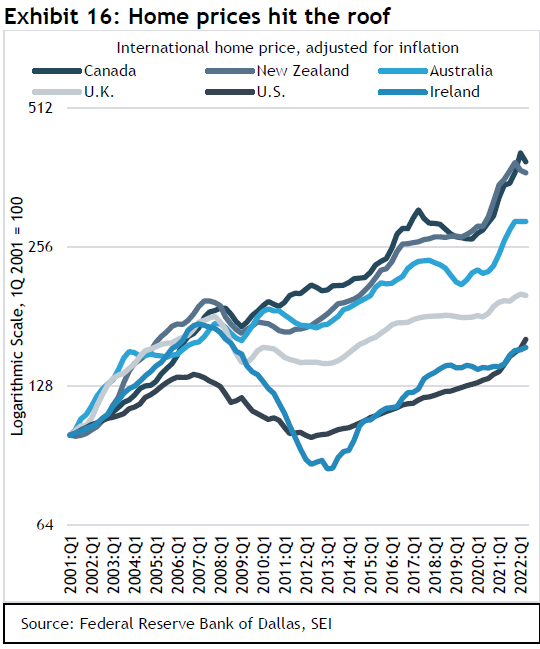
Exhibit 16 compares home prices, adjusted for inflation, for countries where owner-occupied housing plays an important role in their economies. Canada and New Zealand head up this list, followed by Australia and the U.K. The U.S. has been a comparative price laggard since 2001, but it recently surpassed Ireland’s cumulative gain over the entire 21-year period. Like the other countries in the exhibit, the “Emerald Isle” enjoyed a spectacular housing boom in the early 2000s; the subsequent bust was deeper and longer there than anywhere else.
In all of these countries, home prices have far outpaced gains in households’ personal disposable income in inflation-adjusted terms. However, the true outliers are Canada and New Zealand, where prices have nearly tripled over the past two decades while real disposable incomes have recorded cumulative increases of less than 50% for Canada and 65% for New Zealand. By contrast, home prices in the U.K. have “only” doubled in inflation-adjusted terms over this span while incomes have advanced 23%. The U.S., meanwhile, has registered a 61% cumulative gain in home prices since 2001 versus a 27% advance in inflation-adjusted personal disposable income.
Those countries with extended home prices, high debt-servicing costs relative to income, and little protection from the jump in interest rates in the form of long-term fixed-rate mortgages, are the ones most sensitive to the big shift in the global interest-rate regime. The Bank of Canada, for example, may become more reluctant to raise interest rates in the future, even if the U.S. Fed continues on a tightening path. Indeed, the Canadian central bank has hinted that its policy rate has risen to a level where it can now become more data-dependent instead of playing catch-up to inflation. In the U.K., the BOE needs to take into account not just the impact of rising mortgage-debt servicing, but the burden of high energy and food costs on consumer budgets. The BOE may terminate its rate hiking prematurely as a result, providing a respite to consumers at the risk of embedding expectations for higher future inflation.
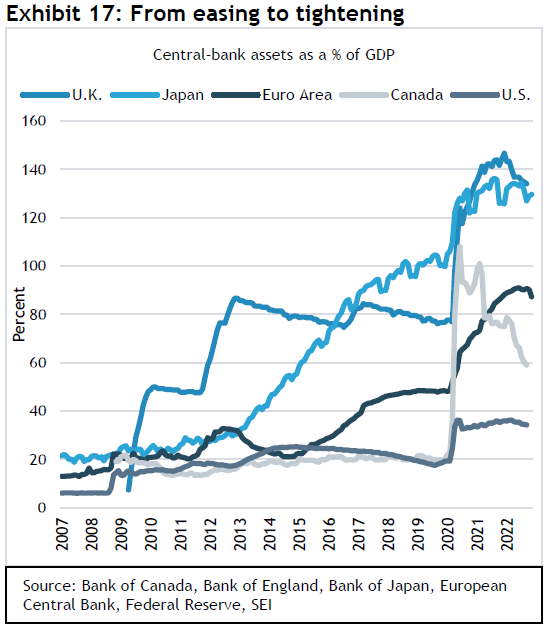
In addition to further interest-rate increases, central banks have embarked on reducing their balance sheets. Quantitative easing has been replaced by quantitative tightening. Outside of the Bank of Canada, which unwound its pandemic-related emergency purchasing program early last year, central banks have generally been reluctant to reduce their balance sheets aggressively. The BOE was even forced to rescue its overly leveraged pension industry and act as the lender of last resort at the end of September.
Central bankers fear that selling securities on top of the surge in interest rates could lead to market dislocations in unexpected places. So far, though, problems that have cropped up because of monetary-policy tightening have not proven to be systemic. If we were to see an abrupt pivot toward monetary easing, it would be due to central bankers’ concerns about a collapse in the housing market or the fallout from upending some systemically important non-bank financial institution or hedge fund. The global banking system itself appears to be in decent shape following the regulatory and capital-enhancement reforms put in place after the global financial crisis.
As we show in Exhibit 17, the portfolios of major central banks have peaked relative to the size of their economies. We expect a move toward somewhat tighter monetary conditions than those that prevailed in 2022.
When will central banks pivot in the opposite direction? We would argue there is no uniform answer. Each country’s monetary authority may act independently, focusing on the interest-rate sensitivity of their own economies and balancing how to ease inflation with as little harm to economic activity and employment as possible. The Fed is the only major central bank required by law to pursue a dual mandate of low inflation and maximum employment, which introduces an additional complication. Given the U.S. economy’s relative resiliency and lower interest-rate sensitivity, the Fed may be the last central bank to pivot.
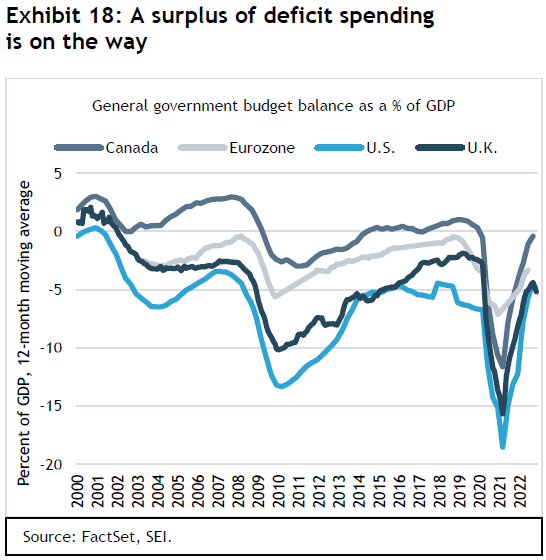
Another complication for central banks involves the integration of monetary policy with fiscal policy. During the initial phase of the pandemic and, perhaps for too long afterwards, both fiscal and monetary policy were exceptionally expansive in the major developed economies. In 2022, as central banks shifted toward a more restrictive setting, fiscal policies also shifted in a restrictive direction. This was not a huge surprise, however. Emergency pandemic spending faded and the rebounding economies out of COVID-19 lockdowns translated into higher tax revenues and reduced government support in a typically cyclical manner.
Government finances are set to deteriorate once again, however, as economies weaken and governments in Europe act to lessen the impact of high energy prices on their citizenry. Beyond the cyclical affects, aging populations are placing additional strain on government expenditures on a more permanent basis. Interest expense will also surge relative to other expenditures as low-cost debt is refinanced at considerably higher yields across the curve.
Exhibit 18 highlights the sharp improvement in the fiscal balances of Canada, the eurozone, the U.S. and the U.K. since early 2021. The red ink will almost certainly darken in 2023 and 2024, however.
This deterioration of fiscal positions comes at the same time that central banks are cutting their holdings of securities. Even the BOJ, which still runs the most expansive monetary policy among the major central banks, may shift toward a more neutral policy that will reduce its purchases of government debt in 2023 once current BOJ Governor Haruhiko Kuroda retires in April 2023.
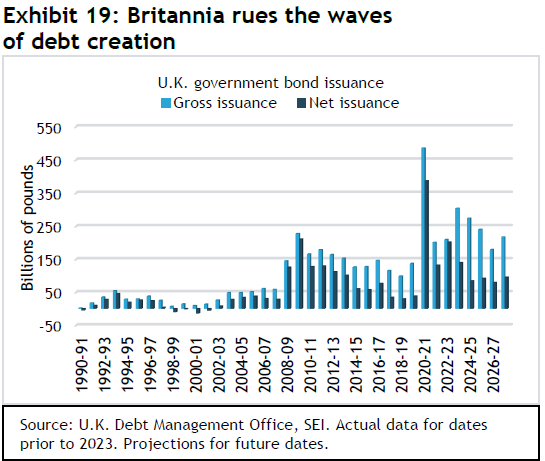
One of the more noteworthy developments in the fourth quarter was the shift in fiscal policy toward restraint undertaken by the U.K. The short-lived government of Prime Minister Liz Truss tried to pursue a growth-oriented fiscal policy highlighted by tax cuts and costly, multi-year measures to reduce the impact of soaring heating and electricity bills on households. A market riot ensued that almost brought the country’s pension industry to its knees. The government quickly pulled the proposals and the Truss administration fell in short order. The new government under Prime Minister Rishi Sunak has completed the reversal, pushing through a hike in the corporate tax rate, eliminating the inflation adjustments applied to personal tax rates and providing considerably less help on energy bills. The pain coming from government spending cuts will be conveniently delayed until after the next general election, which must be held by January 2025.
We highlight the fiscal woes of the U.K. because it shows that investors have quickly become less tolerant of expansive fiscal policies in an environment where borrowing has become more costly and central banks no longer stand at the ready to be a price-insensitive buyer of government debt. As Exhibit 19 shows, gross and net debt issuance in the U.K. is expected to remain elevated over the next several years.
The BOE’s efforts to reduce the bond holdings on its balance sheet could well add to the supply that private investors and institutions will need to absorb. U.K. gilt yields already have risen to nearly match U.S. bond yields to attract enough buyers, as we show in Exhibit 20.
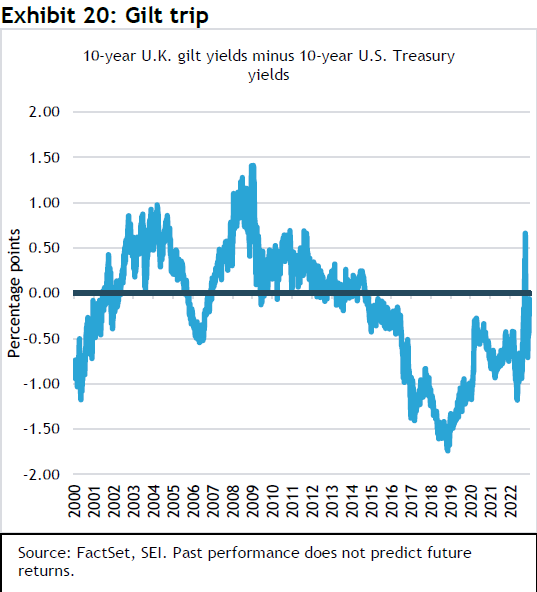
Note that 10-year gilts were priced 22 basis points below the yield on U.S. Treasury notes of the same maturity at year-end. As recently as May 2022, yields on 10-year gilts were more than 100 basis points below comparable-maturity U.S. Treasury yields. We think the yield spread will turn positive. U.K. central-government borrowing as a percentage of GDP is projected to be larger than that of the U.S. government over the next two years. U.K. inflation will likely be higher, too, both cyclically and structurally. Both factors support a higher yield spread between gilts and U.S. Treasurys. The chart shows that gilts yielded more than Treasurys in most periods between 2002 and 2014.
The U.K. is the first major developed country in recent memory to experience the wrath of the bond vigilantes.” (Bond vigilantes refers to investors that sell their bond holdings in an effort to influence government policy that is perceived to be inflationary.) It may not be the last given the broad shift away from central-bank quantitative-easing support. Since the ECB meeting in mid-December, for example, the yield on Italian 10-year bonds has widened by 30 basis points versus German bunds.
Geopolitics remains a wild card
At this time last year, we highlighted concerns in SEI’s Economic Outlook that geopolitical considerations would play a more important than usual role in the calculations of investors. We focused on three main areas of risk: Russia/Ukraine, China, and Iran. The most important flashpoint in terms of near-term probability and economic impact at the time was the Russian build-up of troops on the Ukrainian border. We speculated that an invasion could lead to a complete shutdown in gas imports to Western Europe, aggravating the existing shortage. This call turned out to be accurate; the war’s economic impact dominated the headlines.
In recent months, however, energy prices have posted surprisingly sharp declines. Oil prices are little changed from the end of last year. Recession expectations seem to be trumping supply concerns. However, the war in Ukraine looks set to drag on well into 2023 at the very least; the possibility exists for more surprises that will keep energy prices quite volatile, with current prices likely now at the low end of a wide trading range.
The second area of geopolitical concern we mentioned a year ago was the increasingly fraught relationship between the U.S. and China over trade, human rights, the origin of the coronavirus and, most worrisome from an economic perspective, Taiwan. Markets actually have not reacted too much to the rise in Sino-American tensions; it has nonetheless forced global manufacturers to protect themselves from supply-chain disruptions and possible political repercussions if China were to invade Taiwan.
In late November, U.S. President Joe Biden and Chinese President Xi Jinping sought to lower the tension between their countries at the G-20 meeting in Bali. However, behind the handshake and smiles remains a difficult relationship between the two super-power nations. The Biden administration’s efforts to restrict China’s access to the most advanced semiconductors and the equipment needed to make them suggest that the competition with China has entered a new phase.
The U.S. is becoming much more assertive in defending the existing post-World War II order. We also note that the Biden administration has made progress with shoring up its web of military alliances in Asia, and it is engaging more constructively with its European partners. The risk of outright military conflict with China may still be low, but developments continue to point toward a meaningful downgrade in relations, both militarily and economically.
The third area of risk, Iran, remains a concern but one that is unlikely to move markets in the near term. Negotiations over Iran’s nuclear weapons development are at a standstill, and the government’s strengthening military alliance with Russia has alienated the Europeans and the Americans alike. The theocratic regime, though, is preoccupied with the protests that are roiling the country following the death of a woman who was detained by the country’s so-called morality police. While this is the most serious unrest since the Arab Spring of 2010 to 2011, our default assumption is that the government maintains its grip on power.
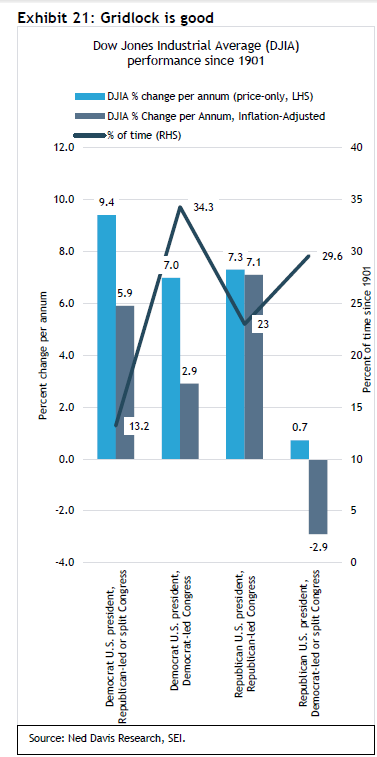
Finally, we highlighted the mid-term elections in the U.S. as an important development to watch. We correctly anticipated that the House of Representatives would flip to the Republicans and that the Senate was too close to call with any confidence. That noted, Republican gains were unimpressive in light of President Biden’s low approval ratings, the increasingly difficult economic environment, and the tendency for the party in power to lose a significant number of seats during mid-term election cycles. Political gridlock is nonetheless the most likely outcome now that the House has flipped. Exhibit 21 highlights this particular political dynamic.
Markets like gridlock. Since 1901, it has correlated with an average annual price-only return for the Dow Jones Industrial Index of 9.4% in nominal terms and 5.9% annualized when adjusted for inflation.
Washington insiders also will be positioning for the 2024 presidential election, making this a time to seek partisan political advantage. Only matters of the most vital interest will be addressed. Investors should be pleased, as history shows that the U.S. stock market performs relatively well in years during which a Democrat occupies the White House but the legislative branch is split or controlled by the opposition.
A sentimental journey
The final category in the chart we displayed near the start of this report is investor sentiment. We categorized investor spirits last year as somewhat on the optimistic side, and we echoed that sentiment. We thought economic growth in the U.S. and China would be much better than it turned out to be. We observed that Russia might invade Ukraine with a devastating impact on energy prices, but it was not our base case.
Most importantly, we underestimated the extent of the rise in interest rates and the impact it would have on stock-market valuations. Nevertheless, we did highlight at the end of 2021 the vulnerability of the most highly valued, interest-rate-sensitive areas of the market. We long believed that the real anomaly in global financial markets prior to this year was the ultra-low levels of interest rates in the face of higher inflation and above-average economic growth in much of the world. Central-bank intervention aimed at keeping short-term rates at extremely low levels certainly bore much of the blame. Structural forces—technological innovations, aging populations, and heavy debt burdens—also played a role.
Just as the global financial crisis of 2007 to 2009 ushered in a period of slow growth and persistently low inflation, we argued the pandemic and governments’ response to the health and economic challenge could result in a reversal of those seemingly structural trends. We raised the possibility that more persistent inflation pressures could force central banks to adopt more aggressive interest-rate policies in 2022 than they envisioned. That alternative scenario certainly played out.
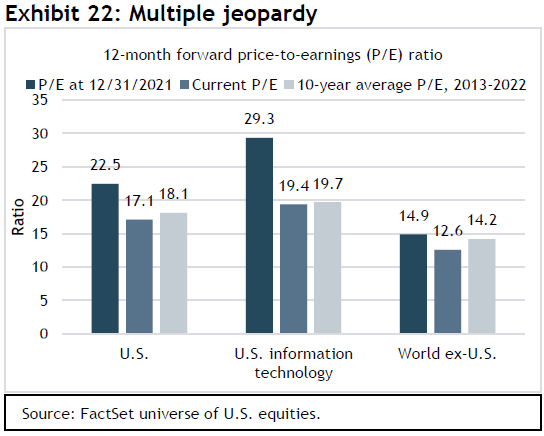
Exhibit 22 highlights the sharp contraction in price-to-earnings (PE) multiples that have occurred over the past year. At the end of 2021, the forward price-to-earnings on U.S. equities was 22.5, well above the 10-year average of 18.1. At the end of 2022, the forward PE multiple had contracted to 17.1, representing a modest discount to its longer-term average. Technology bore the brunt of this correction, tumbling from a year-end 2021 value of 29.3 to a year-end 2022 reading of 19.4—a level slightly below its average for the previous 10 years. Outside the U.S., PE multiples for international equities never reached the excessive levels found in the U.S. The PE ratio fell from 14.9 to 12.6, resulting in a 12% discount to its 10-year average.
The rise in bond yields from historically low levels and the resulting contraction in equity multiples are all part of the normalization of asset values that we have referred to as the “value restoration project.” We do not believe the project is complete. The rally in bond and equity prices in the fourth quarter may prove to be just another false start from a technically oversold condition on the premise (a mistaken one, in our view) that inflation is set to fade rapidly and central banks (the Fed especially) are at the end of their tightening cycle. This rally (which actually stalled out in mid-December) looks very much like the one seen last summer, which was snuffed out by Fed Chair Powell’s hawkish speech at the central bank’s annual Jackson Hole Symposium at the end of August.
It is our belief that inflation has peaked for the most part. However, the pace at which core inflation decelerates will likely be slower than markets anticipate due to the tight labour markets in the major economies. The fourth quarter actually witnessed an easing of financial conditions in the U.S., with equity and bond prices advancing, credit spreads narrowing, and the value of the dollar declining. This works against what the Fed and other central banks are seeking to achieve—a sufficient weakening of the labour market that will ensure a return of inflation back to target. Of course, no central banker is in a position to admit it.
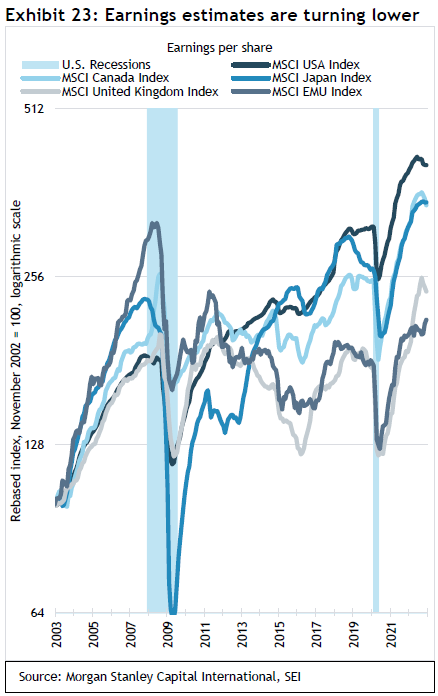
Although global corporate earnings estimates have eased, as we highlight in Exhibit 23, they do not seem consistent with the generally dour view of economists. Even a mild recession should produce an outright earnings decline of 10% or more.
The extent of any additional deterioration in stock and bond prices from current levels should be tempered due to the price correction that has already occurred over the past year and the return of valuations to historical norms. Bonds, for example, should provide the diversifying benefits expected from a balanced portfolio, something that was notably missing in 2022. The low equity multiples already applied to the earnings of many markets outside the U.S. should also provide a buffer for equity prices, even against the backdrop of the harsher economic conditions we expect to prevail in places such as Europe versus that of the U.S.
In summary, investors should be prepared for more volatility as the global economy works through its various challenges. Inflation is likely to remain at elevated levels, although we can expect some cyclical pullback as the global economy weakens and supply chains normalize. Beyond these near-term concerns, investors also need to be cognizant of the longer-term shifts that appear to be underway. Exhibit 24 highlights the drivers behind the 7-1/2 percentage-point margin expansion among the S&P 500 manufacturing companies that took place between 2010 and 2021. One-half of that expansion has resulted from the decades-long decline in interest costs. That tailwind has definitely turned into a headwind, and it will probably blow harder in the years ahead. One-fifth of the total margin expansion stemmed from the globalization of supply chains. Globalization is not going away, but it is likely to undergo a significant revamping as companies seek to improve their supply-chain diversification and resiliency. That effort will cost money and probably reduce efficiency since there is no manufacturing hub quite like China.
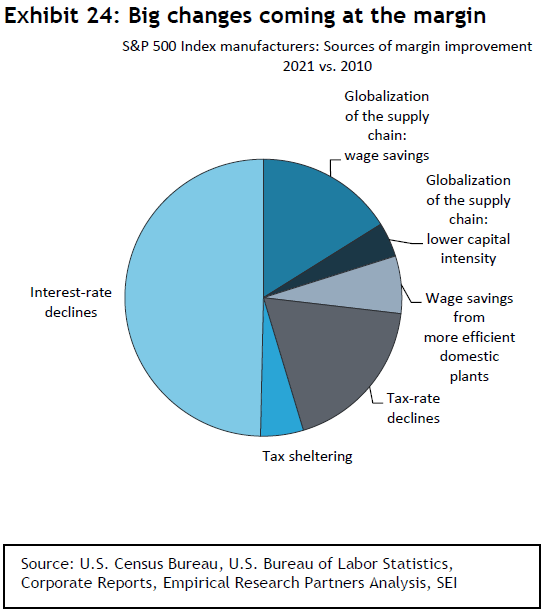
Finally, tax rates are no longer falling. As governments face increasing fiscal pressures, taxes will rise instead, as they are set to do in the U.K. The days of jurisdiction shopping for the lowest tax rates to report corporate profits also are ending, underscored by the global agreement to implement a global minimum tax of 15% for large companies. While we expect firms to find ways to adjust to this new world and eventually prosper, these headwinds strongly suggest to us that cost pressures have become structural—which means that higher inflation probably is structural, too. Markets have done much adjusting, but more are needed, periods of cyclical relief notwithstanding.
A few thoughts on China and emerging markets
It appears that the Chinese government has decided to ease the most onerous COVID-19 restrictions that have derailed economic growth in that country and disrupted global supply chains. We had suggested that, once the Communist Party Congress was out of the way and President Xi Jinping received an unprecedented third term as the party’s General Secretary, he would seek an exit from his zero-COVID-19 policy. However, the government has moved even faster than we had expected. The eruption of protests across the country is likely one catalyst for the about-face.
Although there was little doubt that the government would ruthlessly stamp out the protests if needed, it is understandable that Xi would much prefer to avoid the international outrage that would ensue if he took that route.
The other reason for easing the restrictions is purely economic. Apple’s decision to diversify some of its cellphone production to India undoubtedly was a wake-up call to Xi. There has been much talk about diversifying supply chains but relatively little action. When one of the most important tech companies in the world makes a choice to diversify away from China, others may follow.
SEI believes China’s reopening could prove to be one of the key developments of 2023. John Lau, SEI’s emerging-market equities portfolio manager, recently published a paper outlining his 2023 outlook on the asset class. He noted that Chinese equities quickly priced in the economic implications of the country’s reopening, with a near 30% rise in U.S. dollar terms in November alone. Investors should still use caution when investing in China, as there are increased risks associated with a country that is increasingly subject to the vagaries of “one-man rule.”
There is also the risk of a return to more draconian COVID-19 restrictions as infections surge. Anecdotal reports coming out of China indicate that its healthcare system is already being stressed by a surge in hospitalizations. We may never know the true extent of this latest COVID-19 surge, but if the experience of Hong Kong provides any indication, the number of deaths in a country of 1.4 billion persons could easily amount to more than one million. Still, the die has been cast. China is reopening and growth is likely to be much faster in the year ahead once herd immunity is achieved in a few months.
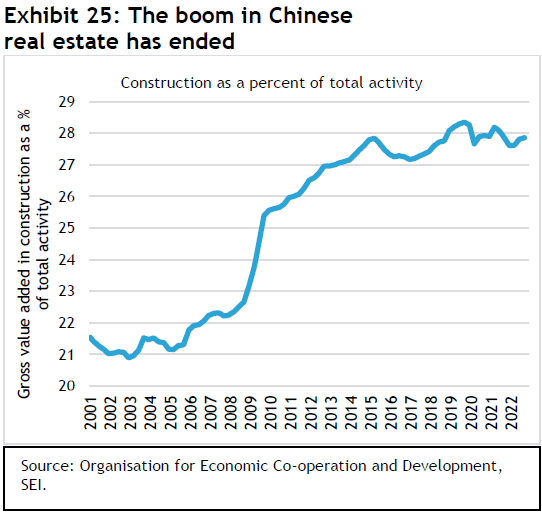
There is more than COVID-19 to worry about when it comes to China. The nation’s housing markets have been under pressure for the past 18 months following the government crackdown on excessive property speculation. As Lau observes, “For home buyers, the biggest problem now is consumer confidence. Unlike other major countries, when a Chinese family buys a new apartment, it is usually in pre-construction, but full payment is required. However, safeguards regarding escrow are questionable, so most buyers have to trust the developers with their life-savings even before construction starts. Hence, when major developers default, consumer confidence plunges and takes a long time to heal.” The Chinese government has been taking steps to nurse the real estate sector back to health, and we are looking for additional regulatory changes that will stabilize this extremely important industry. As we show in Exhibit 25, construction makes up nearly 30% of the country’s economic activity by gross value.
SEI looks for China’s economy to reaccelerate in the year ahead from last year’s very tepid 3% performance. This should help offset at least partially the impact of a global slowdown in advanced countries. It also could exert upward pressure on commodity prices, especially for energy and metals. This would benefit commodity-oriented exporters in Latin America and the Middle East, along with South Africa, Indonesia and Malaysia.
Glossary
Bull market refers to a market environment in which prices are generally rising (or are expected to do so) and investor confidence is high. It is generally defined as a gain of 20% or greater in a stock market index.
Cyclical stocks or sectors are those whose performance is closely tied to the economic environment and business cycle. Managers with a pro-cyclical market view tend to favor stocks that are more sensitive to movements in the broad market and, therefore, tend to have more volatile performance.
The Federal funds rate, set by the U.S. Federal Reserve’s (Fed) Federal Open Market Committee, is the interest rate charged to lending institutions on unsecured overnight loans. The rate is increased when the Fed wants to discourage borrowing and slow the economy and decreased when the Federal Reserve wants to spur economic growth.
Growth stocks exhibit steady earnings growth which exceeds that of the broader market.
High-yield bonds are below investment-grade (BB or lower by S&P Global Ratings and Fitch Ratings, Ba or lower by Moody’s Investors Service), indicating a higher level of risk to an investor compared to a higher-rated bond. Investors typically are compensated for assuming a greater level of risk by receiving a higher yield relative to investment-grade bonds.
Issuance is the sale of securities, typically with regard to debt instruments such as bills, notes, and bonds.
Value stocks are considered to be cheap and trade at lower prices relative to their fundamentals, such as dividends, earnings and sales.
A yield curve represents the differences in yields across a range of maturities of bonds of the same issuer or credit rating (likelihood of default). A steeper yield curve represents a greater difference between the yields. A flatter curve indicates that yields are closer together.
Glossary of Alpha Sources Definitions:
Alpha source is a term used by SEI as part of our internal classification system to categorize and evaluate investment managers in order to build diversified fund portfolios. An alpha source is the investment approach taken by an active investment manager in an effort to generate excess returns. Another way to define an alpha source is that it is the inefficiency that an active investment manager seeks to exploit in order to add value.
Momentum comprises a trend-following investment strategy that is based on acquiring assets with recent improvement in their price, earnings, or other relevant fundamentals.
Quality comprises a long-term buy-and-hold strategy that is based on acquiring shares of companies with strong and stable profitability and high barriers of entry (factors that can prevent or impede newcomers into a market or industry sector, thereby limiting competition).
Security selection is an investment strategy that employs research and judgement to uncover individual opportunities that have been mispriced by other financial market participants.
Value: A mean-reverting investment strategy that is based on acquiring assets at a discount to their fair valuation. . Mean reversion is a theory that prices and returns eventually move back towards their historical average.
Index definitions
The Bloomberg Commodity Total Return Index comprises futures contracts and tracks the performance of a fully collateralized investment in the index. This combines the returns of the index with the returns on cash collateral invested in 13-week (three-month) U.S. Treasury bills.
The Bloomberg Long Government/Credit Index tracks the performance of all medium and larger public issues of U.S. Treasury, agency, investment-grade corporate, and investment-grade (rated BBB- or higher by S&P Global Ratings/Fitch Ratings or Baa3 or higher by Moody’s Investors Service) international dollar-denominated bonds with a remaining maturity longer than 10 years. The average maturity is approximately 20 years.
The Broad Trade-Weight U.S. Dollar Index (also known as the “broad index”) is a measure of the value of the U.S. dollar relative to the currencies of a broad group of major U.S. trading partners.
The Bloomberg U.S. Aggregate Bond Index (formerly Lehman Brothers U.S. Aggregate Bond Index) is a benchmark index composed of U.S. securities in Treasury, government-related, corporate, and securitized sectors. It includes securities that are of investment-grade quality or better, have at least one year to maturity, and have an outstanding par value of at least $250 million.
The Bloomberg Long Government/Credit Index measures the investment return of all medium and larger public issues of U.S. Treasury, agency, investment-grade corporate, and investment-grade international dollar-denominated bonds with maturities longer than 10 years. The average maturity is approximately 20 years.
The Bloomberg 1-5 Year U. S. TIPS Index is an unmanaged index composed of U.S. Treasury Inflation-Protected Securities-rated investment grade and have at least at least $250 million par amount outstanding. The Commodity Research Bureau’s Spot Index tracks 22 commodities that typically are among the first influenced by changes in economic conditions.
The Core Personal Consumption Expenditure Price Index is the Federal Reserve’s (Fed) preferred measure of inflation as it excludes volatile energy and food prices.
The Consumer Price Index measures changes in the price level of a weighted-average market basket of consumer goods and services purchased by households.
The COVID-19 Stringency Index is a composite measure based on nine indicators including school closures, workplace closures, and travel bans. A score of 1 is the least restrictive status.
The Composite Index of Leading Indicators (U.S. Conference Board) is designed to predict peaks and troughs in the business cycle. The index comprises 10 economic components for which changes tend to precede changes in the overall U.S. economy.
The Dow Jones Industrial Average is a price-weighted average of 30 large, publicly traded stocks listed on the New York Stock Exchange and Nasdaq.
The ICE BofA U.S. High Yield Constrained Index measures the performance of high-yield bonds.
The JP Morgan EMBI Global Diversified Index tracks the performance of external debt instruments (including U.S. dollar-denominated and other external-currency-denominated Brady bonds, loans, Eurobonds, and local market instruments) in the emerging markets. The JPMorgan GBI-EM Global Diversified Index tracks the performance of local-currency bonds issued by emerging-market governments.
The MSCI Emerging Markets Asia Index tracks the performance of large- and mid-cap stocks representing approximately 85% of the free float-adjusted (i.e., including only shares that are available for public trading) market capitalization of China, India, Indonesia, Korea, Malaysia, the Philippines, Taiwan and Thailand.
The MSCI Emerging Markets Europe and Middle East Index tracks the performance of large- and mid-cap stocks representing approximately 85% of the free float-adjusted (i.e., including only shares that are available for public trading) market capitalization of the Czech Republic, Greece, Kuwait, Hungary, Poland, Qatar, Turkey and United Arab Emirates.
The MSCI Frontier Emerging Markets Index captures large- and mid-cap equities across more than 30 frontier emerging markets countries.
The MSCI Emerging Markets Index is a free float-adjusted (i.e., including only shares that are available for public trading) market-capitalization-weighted index that tracks the performance of global emerging-market equities.
The MSCI World ex USA Index captures large and mid-cap equities across 22 of 23 developed markets countries. It excludes the United States.
The MSCI World Index is a free float-adjusted (i.e., including only shares that are available for public trading) market-capitalization-weighted index that tracks the performance of developed markets.
The Personal Consumption Expenditures (PCE) Price Index measures the prices that consumers pay for goods and services (including food and energy prices) to reveal underlying inflation trends. The Core PCE Price Index, the primary inflation monitor used by the Federal Reserve, excludes volatile food and energy prices.
The Purchasing Managers’ Index is an indicator of economic health for manufacturing and service sectors. Its purpose is to provide information about current business conditions to company decision makers, analysts and purchasing managers.
The Russell 1000 Index includes 1000 of the largest U.S. equity securities based on market cap and current index membership; it is used to measure the activity of the U.S. large-cap equity market.
The Russell 2000 Index includes 2000 small-cap U.S. equity names and is used to measure the activity of the U.S. small-cap equity market.
The S&P 500 Index is a market-weighted index that tracks the performance of 500 of the largest publicly traded U.S. companies and is considered representative of the broad U.S. stock market.
The U.S. Dollar Index measures the value of the U.S. dollar against a weighted basket of currencies used by U.S. trading partners. The index rises when the dollar strengthens against these currencies and falls when it weakens.
Important Information
This material is not directed to any persons where (by reason of that person's nationality, residence or otherwise) the publication or availability of this material is prohibited. Persons in respect of whom such prohibitions apply must not rely on this information in any respect whatsoever. Investment in the funds or products that are described herein are available only to intended recipients and this communication must not be relied upon or acted upon by anyone who is not an intended recipient.
This material represents an assessment of the market environment at a specific point in time and is not intended to be a forecast of future events, or a guarantee of future results. While considerable care has been taken to ensure the information contained within this document is accurate and up-to-date, no warranty is given as to the accuracy or completeness of any information and no liability is accepted for any errors or omissions in such information or any action taken on the basis of this information.
SEI Investments (Europe) Limited (SIEL) acts as distributor of collective investment schemes which are authorised in Ireland pursuant to the UCITS regulations and which are collectively referred to as the “SEI Funds” in these materials. These umbrella funds are incorporated in Ireland as limited liability investment companies and are managed by SEI Investments Global Limited, an affiliate of the distributor. SEI Investments (Europe) Limited utilises the SEI Funds in its asset management programme to create asset allocation strategies for its clients. Any reference in this document to any SEI Funds should not be construed as a recommendation to buy or sell these securities or to engage in any related investment management services. Recipients of this information who intend to apply for shares in any SEI Fund are reminded that any such application must be made solely on the basis of the information contained in the Prospectus (which includes a schedule of fees and charges and maximum commission available). Commissions and incentives may be paid and if so, would be included in the overall costs.) Please refer to our latest Prospectus (which includes information in relation to the use of derivatives and the risks associated with the use of derivative instruments), Key Investor Information Document, Summary of UCITS Shareholder rights (which includes a summary of the rights that shareholders of our funds have) and the latest Annual or Semi-Annual Reports for more information on our funds, which can be located at Fund Documents.’ And you should read the terms and conditions contained in the Prospectus (including the risk factors) before making any investment decision.
Data refers to past performance. Past performance is not a reliable indicator of future results. Investments in SEI Funds are generally medium- to long-term investments. The value of an investment and any income from it can go down as well as up. Returns may increase or decrease as a result of currency fluctuations. Investors may get back less than the original amount invested. SEI Funds may use derivative instruments which may be used for hedging purposes and/or investment purposes. This material represents an assessment of the market environment at a specific point in time and is not intended to be a forecast of future events.
In addition to the usual risks associated with investing, the following risks may apply: Bonds and bond funds are subject to interest rate risk and will decline in value as interest rates rise. High-yield bonds involve greater risks of default or downgrade and are more volatile than investment-grade securities, due to the speculative nature of their investments. International investments may involve risk of capital loss from unfavourable fluctuation in currency values, from differences in generally accepted accounting principles or from economic or political instability in other nations. Emerging markets involve heightened risks related to the same factors as well as increased volatility and lower trading volume. Narrowly focused investments, securities focusing on a single country, and investments in smaller companies typically exhibit higher volatility.
The opinions and views in this commentary are of SIEL only and are subject to change. They should not be construed as investment advice.
This information is issued by SEI Investments (Europe) Limited (SIEL) 1st Floor, Alphabeta, 14-18 Finsbury Square, London EC2A 1BR, United Kingdom. SIEL is authorised and regulated by the Financial Conduct Authority (FRN 191713).
Issued in South Africa by SEI Investments (South Africa) (Pty) Limited FSP No. 13186 which is a financial services provider authorised and regulated by the Financial Sector Conduct Authority (FSCA). Registered office: 3 Melrose Boulevard, 1st Floor, Melrose Arch 2196, Johannesburg, South Africa.
This commentary is intended for information purposes only and the information in it does not constitute financial advice as contemplated in terms of the Financial Advisory and Intermediary Services Act.
SEI sources data directly from FactSet, Lipper, and BlackRock unless otherwise stated.


