The Year Ahead: Moderate Growth, Rising Volatility (Long Version)
It is impossible to look at the global economy through any lens but one tinted by COVID-19. This time last year, we expressed optimism that 2021 would witness a continuation of the global recovery that began the previous spring. We were especially hopeful that the vaccines could be manufactured and distributed fairly quickly (at least for high-income countries) and would prove as effective in practice as they did in their trials. We also assumed that the majority of people with access would get the shots, despite the vaccines’ rapid development and widespread scepticism and resistance in parts of the US and in many other countries.
As it turned out, the vaccines have indeed proven effective, but new variants (especially Delta, and now Omicron) resulted in the need for booster shots much more quickly than expected. In addition, vaccination rates have varied greatly across countries. Some high-income countries managed to administer at least two doses to approximately 70% of their populations by the end of the year, although the proportion who received booster shots is much lower. Within the high-income group, the vaccination rate in the US is at the lower end of the scale, at 61.5%. Upper-middle-income countries are in the same range as the high-income nations, with China, Malaysia and Brazil actually reporting higher vaccination rates than the US. Rates fall precipitously for lower middle-income and low-income countries, where only 35% and 4.2% of the population, respectively, are fully vaccinated1.
The tragic epidemic last spring caused by the Delta variant in India (a major production hub for vaccines that are delivered to lower-income countries) reduced the number shots available for export. Advanced economies, meanwhile, chose to widen the distribution of the vaccines to their younger populations and begin the process of adding booster shots, further reducing supplies that might otherwise be used to inoculate the rest of the world. In all, only 800 million doses, 8.5% of the total administered worldwide, were made available to poorer countries last year2. This was less than half the total initially projected by the World Health Organization.
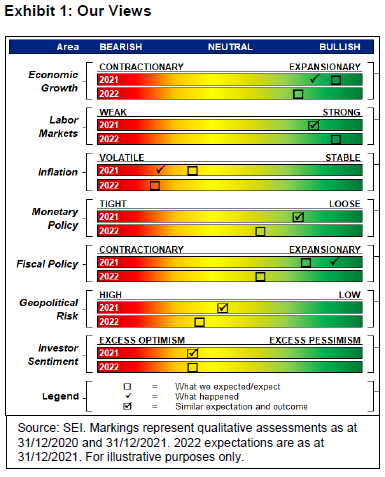
Exhibit 1 on the next page provides a stylized depiction of our views for 2021 and 2022 on a variety of topics important to investors. Our original forecasts for 2021, made at the end of 2020, are represented by the boxes in the top bars for each category; the actual outcome for the year is represented by a check mark. To be sure, this is not a quantitative exercise, but the chart at least gives an indication whether our expectations were in the ballpark. These forecasts pertain to the US, but they would not have been all that different for other developed countries.
US economic growth in 2021, for example, fell a bit short of our expectations. This was mostly owing to the surge of the Delta variant. The goods shortage, especially for autos and other durable goods, was also an important factor behind the slowdown. Inflation-adjusted gross domestic product (GDP) advanced just 2.3% at a seasonally adjusted annual rate during the third quarter, following hefty gains of 6.3% and 6.7% in the prior two respective quarters. Data for the fourth quarter, however, indicate a fairly strong end to the year. For 2021 as a whole, the economy is likely to record a solid increase of about 5.5%.
Other advanced countries also experienced exceptional gains in inflation-adjusted GDP. The latest consensus reading for the GDP outcome in the UK calls for a 7% gain for the past year as a whole. Canada is expected to be up around 5%. The eurozone also probably rose about 5% for the full year, led by gains of more than 6% in France and Italy. Germany lagged its neighbours last year, recording economic growth of only about 3%, a victim of the car-parts shortage and the disruption to domestic consumption caused by a COVID-19 surge.
Emerging economies as a group grew at a pace about one percentage point faster than the advanced countries, but their individual rates varied substantially. India led the way (9.5%), followed by China (8%). Brazil and South Africa each recorded increases of around 5% and Russia at a bit more than 4%.
We anticipate deceleration in US GDP growth in 2022, with the gain in overall economic activity around 4% (appreciably above the economy’s long-term growth potential of 2%). We also expect other countries to continue to post above-average advances as they recover from two years’ worth of lockdowns and supply shortages.
To some extent, the world is unfortunately still held hostage by COVID-19. Social distancing and work-at-home mandates will continue to have a negative impact on many economies throughout the world over the next few months, especially in Europe. Our expectation for global GDP growth, however, assumes that the world will continue to manage through the periodic setbacks in the battle against the disease. With the major exception of China, which continues to pursue its zero-COVID-19 policy, most countries are unlikely to shut down their economies as fiercely or for as long as they did in 2020. The pubs are still open in the UK; the slopes are still open to skiers in Austria; and it is still possible to spend a few days enjoying the warmth of the Caribbean (although international travel is not easy).
Exhibit 2 tracks the percentage of countries posting month-to-month increases in their respective composite leading indicators (CLIs), as measured by the Organisation for Economic Co-operation and Development (OECD). This measure hit 100% in June and August 2020—when the world was enjoying a synchronized recovery from the depths of the pandemic-induced recession—and remained high, at around 88%, as recently as June 2021. Yet economic momentum has since been fading rapidly. The most recent data (as at November 2021) show only 43% of the countries posting positive month-over-month readings.
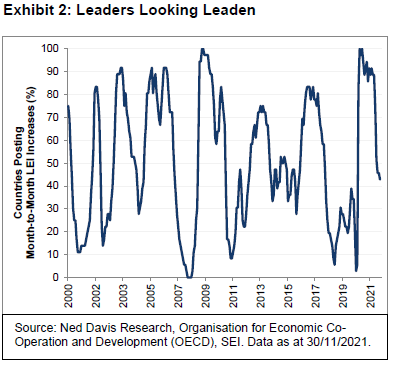
This doesn’t mean the world economy is quickly heading toward another recession, however. Almost three-quarters of the countries in this sample still have CLI readings above 100%, meaning that they should continue to grow at an above-trend pace in the months immediately ahead. Overall economic growth is still robust, but it is certainly beginning to decelerate toward more normal levels.
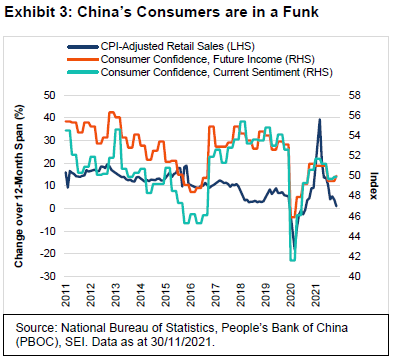
China’s performance in 2022 is one of the key unknowns that will influence global economic growth. Although the country posted a strong gain in GDP last year, momentum faded in the second half as the property market came under intense pressure. On the positive side, the government has begun to ease monetary policy and is providing some help to home buyers. Taxes are also being cut for individuals. Consensus expectations call for a soft landing of the Chinese economy, with GDP growing by about 5% in 2022 versus 8% in the past year. However, there will likely be additional COVID-related disruptions through the first half of the year, and the recent decline in home prices will certainly not help matters. As we highlight in Exhibit 3, consumer sentiment among China’s urban residents weakened sharply in the third quarter of 2021; retail sales adjusted for changes in consumer prices were barely positive in November on a year-over-year basis.
Labour’s day has come
Last year at this time, SEI was confident that the labour market in advanced economies would improve significantly throughout 2021. Even though unemployment had already tumbled from its peak in the spring of 2020, the unemployment rates in the US and in Canada were still high relative to previous cycles at the end of that year. Exhibit 4 highlights the unemployment rates for the US, Canada, the UK and the euro area. It also includes the so-called U-6 unemployment rate for the US—which counts (on top of the total unemployed figure) individuals who want a job but aren’t actively seeking one as well as individuals who are working part-time but would rather be working full-time.
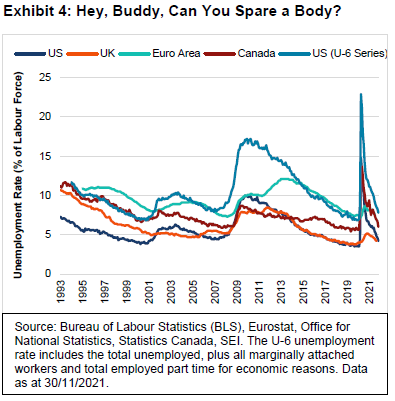
During the initial stages of the pandemic, the U-6 unemployment rate skyrocketed to a peak of 22.9%. As at November 2021, it had fallen back to 7.8% (just one percentage point away from its pre-pandemic low).
Although the UK and Europe also recorded increased unemployment in early 2020, the deterioration was far more muted due to fiscal-policy decisions. Governments in the region provided support to businesses in order to keep employees on corporate payrolls. In North America, this sort of support was more limited. Money was directed instead to individuals in the form of transfer payments and enhanced unemployment benefits. The European model provides more stability, enabling companies to keep experienced workers who can be brought back to work quickly as business recovers. The North American model is more dynamic. If the pandemic leads to permanent shifts in the demand for certain goods and services, workers are more likely to gravitate to those parts of the economy that benefit from such shifts while leaving wounded industries behind.
The year ahead promises to be another one of extremely tight labour markets (especially in the US). We think more people will return to the workforce as COVID fears fade, but there likely will still be a tremendous mismatch of demand and supply. Exhibit 5 on the following page tracks job openings versus the number of people unemployed, including discouraged workers not actively seeking work as well as the under-employed.
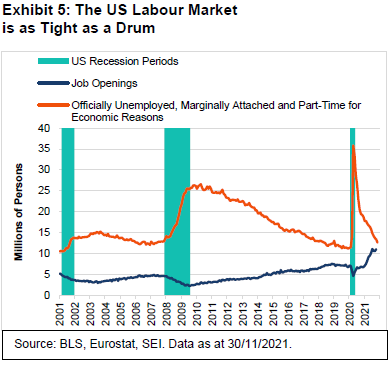
Even using the broadly inclusive definition of unemployment, the US labour market remains tight. Currently, there are 12.6 million persons theoretically available to fill 11 million job openings—the smallest gap since 2001. By comparison, at the end of the global financial crisis in 2009, there were more than 26 million people looking for (or at least saying they wanted) a job, but only 2.5 million job openings to accommodate them.
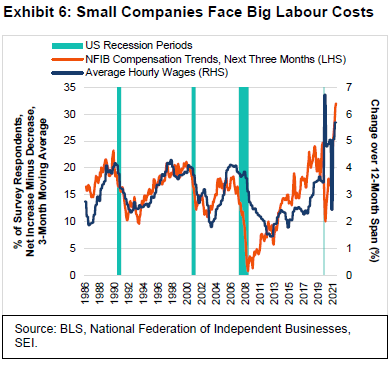
In the short term, we expect wages to continue their sharp climb as businesses bid for workers. Exhibit 6 examines compensation trends among small business enterprises and overlays the 12-month change in average hourly earnings—illustrating a fairly tight correlation between the two. At present, a net 32% of survey respondents expect to raise wages over the next three months. This is the highest percentage ever recorded in the history of this compensation survey, which goes back to 1986. Unsurprisingly, wage gains have also climbed at their fastest pace in decades over the past 12 months. Underscoring the shift in bargaining power from companies to employees are anecdotal reports such as Amazon pushing up local wage rates in order to staff its distribution centres and Deere & Company agreeing to a generous wage contract that reinstitutes quarterly cost-of-living adjustments.
The OECD publishes quarterly data on total labour compensation for the largest economies, which we highlight in Exhibit 7. Year-over-year changes are highly variable, so we smooth out the fluctuations by taking a 12-month moving average and tracking the annualized percentage change over a three-year period. This also serves to reduce the impact of the pandemic waves over the past two years. Even when one makes these adjustments, it is clear that the US is undergoing a much sharper compensation acceleration than the other five countries tracked in the exhibit. The UK also is in the midst of a pronounced upswing in its labour-compensation trend. We think Brexit and the departure of foreign workers back to the Continent are aggravating the country’s labour shortage. Meanwhile, Canada and Germany have both seen compensation growth come off the peak but remain somewhat elevated versus historical trends. Compensation gains in France and Japan have been significantly lower than in other countries.
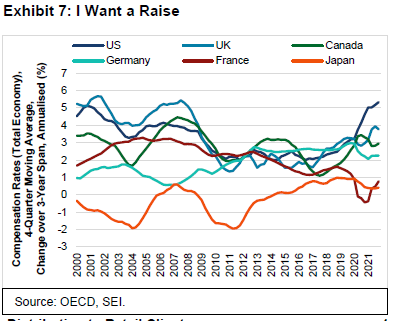
The disparity in compensation trends among six of the richest industrialized nations3 also means that policy responses are likely to diverge. Economic policy in the US will need to be tightened considerably to rein in inflation. The UK and Canada also will need to lean against the inflationary trends that could otherwise become embedded in their economies. Europe and Japan, however, already have flagged their intentions to maintain a high level of fiscal and monetary accommodation through 2022.
The Fed finally transitions away from transitory
This time last year, the prevailing wisdom was that the uptick in inflation would prove transitory. Economists were focused on the base effects; they weren’t concerned about the underlying trend. At SEI, while we accepted the idea that the pandemic was temporarily driving up prices in certain sectors of the economy, we also expressed some reservations that the inflation trend may not be as benign as the US Federal Reserve (Fed) and many investors were forecasting. The central bank certainly was more focused on the level of unemployment; Fed Chair Jerome Powell and his colleagues stated clearly that they would be willing to let the economy and inflation run a little hot in an effort to provide job opportunities for those who traditionally have had a tougher time finding steady work. We also noted that suppressing interest rates via quantitative easing would help federal and state governments by keeping interest expenses low even as the absolute level of debt issuance surged.
While our beginning-of-the-year forecast did not anticipate such a sharp acceleration in the inflation rate, we were at least positioning portfolios for upside inflation surprises. In our January paper The Return of Reflation: Time to Move?, we pointed out that growth and inflation were likely to accelerate. Just a few months later, however, we coined the term “persistently transitory” in our mid-year Economic Outlook to describe the inflation pressures that were still building. The $1.9 trillion COVID-19 relief package passed in March and the emergence of the Delta variant later in the spring appeared to set the stage for a prolonged imbalance between demand and supply. Increasing concern about the shortage of semiconductor chips flagged by auto manufacturers was a clear warning that supply-chain issues were getting worse, not better.
It took a while, but is seems that just about everyone now sees inflation continuing at elevated levels this year and into 2023. At the end of November, Fed Chair Powell suggested that it was probably a good time to retire the word “transitory” when referring to inflation. However, that doesn’t mean the central bank has given up on the idea that inflation will eventually return to its 2% target. Investors apparently tend to agree. As we show in Exhibit 8, the expected five-year inflation rate five years from now (the so-called called 5-year/5-year forward inflation expectation rate) is currently pegged at about 2.25%. That’s at the higher end of the range since 2015, but still considerably lower than typical readings prior to 2015. This market-based measure may be distorted by Fed purchases of Treasury Inflation-Protected Securities (TIPS) as part of its quantitative-easing program. Yet economists expect CPI inflation to rise at a 2.9% pace over the next five years and 2.2% over the following five years—not far from market-implied expectations.
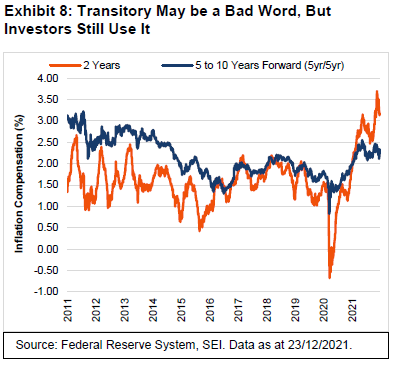
Predicting a bad inflation outcome for 2022 isn’t exactly much of a risk. Note in Exhibit 8 that market-based expectations for CPI inflation over the next two years have risen significantly higher since October and currently averages 3.2%. Where we depart from the crowd on inflation is in the years beyond 2022. SEI is sceptical that the central bank will be sufficiently proactive as it struggles to find the proper balance between having an economy run above its long-term potential in the interests of achieving full and inclusive employment versus the need to lean against inflation pressures that are starting to look more entrenched. This will be the Fed’s biggest challenge in 2022 and beyond.
On the next page, Exhibit 9 provides a long-term view of the federal-funds rate versus core inflation (which excludes food and energy), as measured by the Personal Consumption Expenditures (PCE) price index. For most of the past 50 years, the fed-funds rate has traded above the inflation rate, sometimes spectacularly so—by three percentage points as recently as early 2007. The global financial crisis upended this long-standing relationship between the Fed’s key policy rate and inflation. For most of the past 13 years, the fed-funds rate has consistently lagged the year-over-year gains in the PCE price index. This gap widened dramatically in 2021.
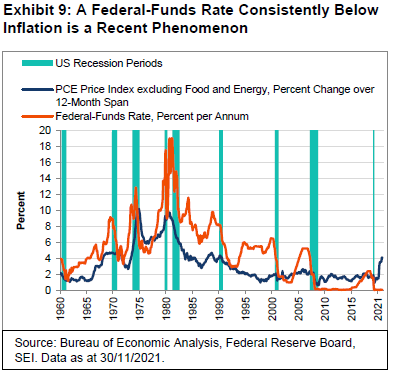
The Fed’s latest Survey of Economic Projections, released in mid-December, showed that the central bank’s governors and regional bank presidents are shifting their expectations higher for both the fed-funds rate and the inflation rates. Within the Federal Open Market Committee (FOMC), the median projected trajectory of the fed-funds rate now calls for three interest rate increases in 2022, three more in 2023 and an additional two in 2024. Whether these projections prove accurate is somewhat beside the point, although they do suggest the direction of travel. That noted, we do not think that the FOMC’s outlook for inflation and economic growth is internally consistent. Although the central bank’s policymakers anticipate another strong gain in real GDP in 2022, amounting to 4%, they project that the core inflation rate will fall to 2.7% this year and to 2.3% in 2023. Since the economy will be even closer to full employment than it is now, we find it hard to understand why price pressures should ease so dramatically. Even though goods inflation will eventually revert as supply-chain issues are resolved, the labour shortages we highlighted earlier will likely persist and keep inflation appreciably above the Fed’s expectations (and those of most investors).
Among the other major central banks, the Bank of Canada (BoC) and the Bank of England (BOE) are under the most pressure to pivot toward tighter monetary policy. The BOE raised its bank rate in mid-December by 15 basis points (0.15 percentage points) to 0.25%, a small step but the first among the most important central banks. The European Central Bank (ECB) and the Bank of Japan (BOJ) appear unlikely to follow suit, although they also are reducing their asset purchases. Exhibit 10 tracks the balance sheets of the big central banks since the start of the global financial crisis in 2007. Over the past decade, the BOJ has been the most consistent buyer of securities. In contrast, the BOE has pursued quantitative easing in an episodic fashion. Its UK government bond holdings now equal 140% of nominal GDP, about the same percentage as those of Japan.
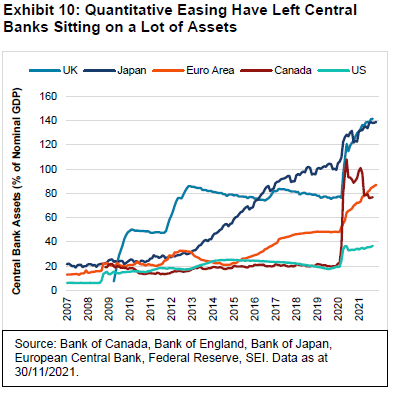
The BoC was the most aggressive of the major central banks in responding to the pandemic, raising its assets from about 25% of GDP in February 2020 (the same level as the Fed’s balance sheet at the time) to a peak of 108% of GDP by June of that year. It is the only country to have since pared back its balance sheet, not only relative to the size of its economy but in absolute terms as well. Nonetheless, relative to GDP, the BoC balance remains in the same vicinity as that of the ECB.
Even those central banks that are most likely to taper their asset purchases and raise their policy rates in the months ahead (the Fed, the BOE and the BoC) will likely do so cautiously. In our opinion, central bankers and investors alike seem to view the global economy as being in such a fragile state that even the US could fall into recession if policy rates move up by as little as two percentage points over the next two or three years. They no doubt remember what happened when the central bank methodically raised the fed-funds rate in 2017 and 2018: the stock market had a panic attack late in 2018 that drove the S&P 500 Index down by almost 20% in a matter of weeks. The ECB, meanwhile, doesn’t want to set off another European periphery debt crisis by prematurely raising its policy rate like it did in 2011. The BOE also wants to tread lightly given the near-term impact of the Omicron virus on the UK economy and, in the longer-run, the still-uncertain outlook caused by Brexit. By contrast, emerging economies don’t have the luxury to wait and see whether inflation ebbs. Policy rates have already shot up in a number of emerging markets, as seen in Exhibit 11.
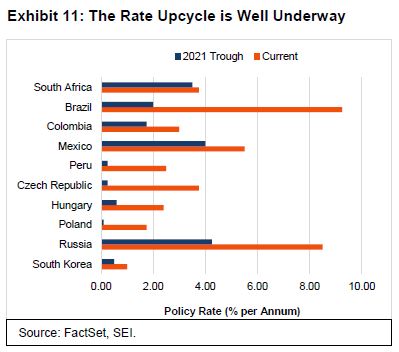
All of the countries shown in the Exhibit 11 began to raise interest rates during in 2021. In Brazil, which reported a slight decline in GDP in the third quarter and may well report another drop for the fourth quarter, the central bank has already pushed up its policy rate to 9.25% from 2% in an effort to get ahead of its worsening inflation problem. Rate increases have been pushed through in several other Central and South American countries. Central and Eastern Europe also have recorded a series of policy-rate increases this year. The pace of tightening is picking up, with 11 emerging countries having instituted policy-rate hikes in December alone.
It remains to be seen whether this pre-emptive tightening of monetary policy will forestall a 2013-style taper tantrum as the Fed embarks on its own rate-tightening cycle in the US. Although emerging-market currencies have generally lost ground against the US dollar during the past six months, the depreciation hasn’t become a rout (with the exceptions of Turkey and the usual economic basket cases—Argentina and Pakistan). Still, the shift in Fed policy should represent a formidable headwind for emerging-market economies in 2022.
As mentioned previously, we will be keeping a close eye on developments in China. The country’s growth rate has been slipping in recent months, hit hard by the slump in the property markets and the regional lockdowns caused by the government’s zero-COVID-19 policy. There are some signs, however, that economic policy is shifting to an easier setting. Unlike the central banks of other developing economies, the People’s Bank
of China (PBOC) actually cut a key interest rate in December by a modest amount. This follows a reduction in reserve-requirement ratios aimed at increasing the liquidity available to the economy.
It will take a while for any beneficial impact to be felt on China’s domestic economy, and even longer for the world at large. As Exhibit 12 indicates, China’s credit cycle appears to be making a turn toward the upside, but world trade tends to accelerate only about two years later. Unfortunately, annual trade growth could flatten at around 2% this year given the lagging relationship with China’s credit cycle.
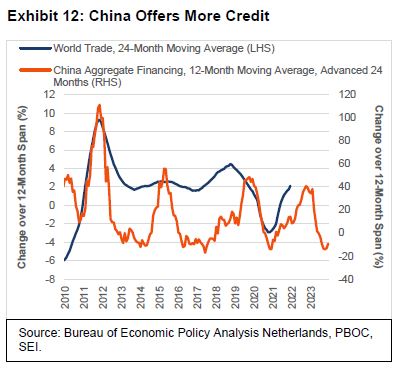
Emerging-market equity performance should improve before trade volumes increase because the lag is shorter by at least a year. Besides, investors have already priced a lot of bad news into the market given the rising trend of inflation and interest rates in most countries, the on-going battle with COVID-19, and the uncertainties surrounding Chinese economic growth. The next few months may prove to be a hard slog for the asset class. The introduction of the Omicron variant into China could lead to more disruptions to consumption, production and shipping patterns. One of the great ironies of China’s zero-COVID-19 policy is that its very success has left the population vulnerable to widespread infection. There is little natural immunity. Although the vaccination rate is high, there are questions regarding how effective China’s home-grown vaccines will prove to be against the newest variant.
Looking over the fiscal cliff
In addition to the start of a new monetary tightening cycle, some economists are concerned about the next “fiscal cliff” facing various countries, the US in particular. While there will be a negative fiscal impulse in the sense that the extraordinary stimulus of the past two years will not be repeated, we believe the impact should be less contractionary than feared. Exhibit 13 highlights national governments’ cumulative fiscal responses to the pandemic over the past two years, measured as a percentage of 2020 GDP.
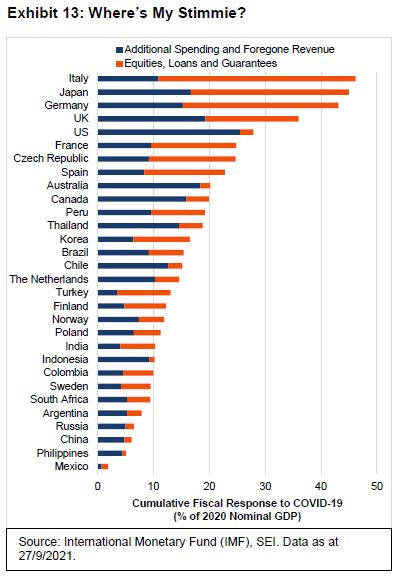
The US was the most aggressive country in terms of providing direct fiscal support (emergency spending, income support and tax breaks), amounting to 25.5% of GDP. This total includes the emergency package passed last March but not the recently enacted bipartisan infrastructure bill. Other countries that reported direct fiscal support of at least 15% of GDP include (in descending order) the UK, Australia, Japan, Canada and Germany.
When factoring in the indirect stimulus measures that a country may take (such as equity injections, loans, asset purchases, debt assumption and loan guarantees), Italy, Japan, Germany and the UK each provided more support relative to the size of their economies than the US. In some countries, since the global recession (and subsequent liquidity squeeze) was mercifully short, the financial lifelines extended to businesses were ultimately not needed—and the cost of these support measures turned out to be considerably less than originally announced. For example, the current level of contracted guarantees in Italy is only about one-fourth of what was made available back in the spring of 2020.
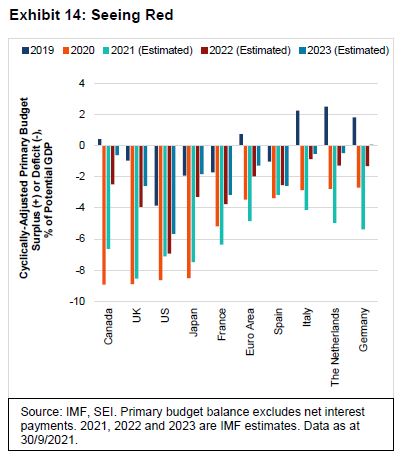
While the US Congressional Budget Office reckons that the deficit will contract by nearly nine percentage points of GDP in the fiscal year ending September 2022, the fiscal cliff doesn’t look quite as scary against the backdrop of the US economy’s current economic strength. Adding in the strengthened fiscal positions of the country’s state and local governments further reduces the perceived impact of the fiscal cliff since they have been some of the biggest beneficiaries of the federal government’s largesse. Exhibit 14 looks at the changes in general government fiscal balances (central and local) of the world’s major economies, excluding net interest payments, across the major economies. The data are cyclically adjusted so that it is easier to see whether shifts in a given country’s deficit is the result of discretionary policy moves or simply the work of automatic economic stabilizers such as lower tax revenues and increased standard unemployment payments that kick in during a downturn.
Viewed against potential GDP, the US was running a relatively hefty deficit of almost 4% in the year prior to the pandemic; by contrast, the Netherlands, Italy, Germany and Canada had primary fiscal-balance surpluses. On the following page, all of the major countries in Exhibit 14 recorded steep deteriorations during 2020, with Canada, the UK and Japan recording the biggest declines in their fiscal position based on policy changes. In 2021, the cyclically adjusted deficit continued to deepen in the euro area; Germany actually recorded a widening of its deficit to the tune of 2.7% of GDP.
Despite the US federal government’s additional stimulus measures early last year, the country’s general government accounts saw a narrowing of the deficit owing to the sharp improvement in the finances of state and local governments. The International Monetary Fund (IMF) anticipates that every major country besides the US and Spain will see substantial fiscal improvements in 2022. Perhaps economists should be concerned about the negative fiscal impulses in the UK, Canada, Germany and Japan as they all face a potential fiscal tightening equivalent to 4% of GDP in the New Year. By comparison, the IMF predicts that the cyclically adjusted deficit in the US will contract by less the 0.5% of GDP.
We remain optimistic that growth in the major economies will be buoyed by the strong position of households. In the US, household cash and bank deposits are still almost $2.5 trillion above the pre-pandemic trend as at the end of September. This total is equivalent to almost 14% of disposable personal income and almost 15% of personal consumption. Meanwhile, excess saving in the UK has reached £166 billion, equal to 10.6% of annual personal disposable income. Excess savings in euro-area bank balances are €400 billion, which isn’t quite as high but still amounts to 5% of after-tax income. It is hard to believe that this global stock of savings will not be drawn down upon to some extent once the pandemic subsides and people regain confidence in the future.
Will geopolitics matter more in 2022?
Investors always need to deal with uncertainty. It is not often, however, that geopolitics becomes a focus that exerts a big impact on markets, either positive or negative. Exhibit 15 presents a measure called the Geopolitical Risk Index (GPR), developed by researchers at the Fed. The most recent spike in risk occurred two years ago, at the beginning of the pandemic. It quickly faded once governments responded with extraordinary fiscal- and monetary-policy initiatives. The 9/11 terrorist attack in 2001 and the subsequent invasion of Iraq, on the other hand, saw risk levels elevated for a more prolonged period. These are the times when the global economy can be affected in a more important way, and that is when investors pay attention.
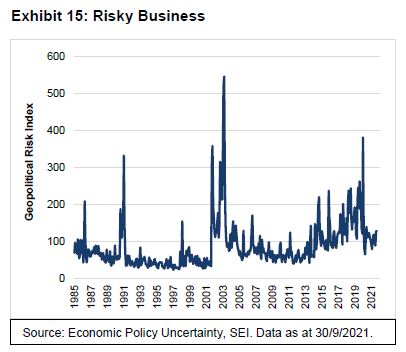
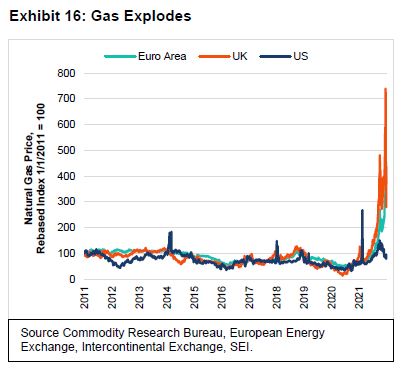
The GPR has ebbed to relatively low levels, but tensions may be on the rise. SEI is focused on three main areas of risk. The most important flashpoint in terms of near-term probability and economic impact is the Russian build-up of troops on the Ukrainian border. While an invasion of Ukraine might not evoke a military response by NATO, it will certainly lead to major economic consequences for Russia and Europe. On the next page, Exhibit 16 highlights the extraordinary rise in natural gas prices experienced in Europe and the UK compared to the US. While natural gas prices have ebbed in recent weeks, they remain high in the UK and on the Continent. An invasion of Ukraine by Russian troops could lead to a complete shut-off of gas imports from Russia to Western Europe, aggravating the existing energy shortage. It also could disrupt shipments of oil, which would have an impact across the globe.
The next is the on-going tug-of-war for influence and military advantage between China and the US. In recent years, investors have largely ignored rising tensions over a variety of hot-button issues (trade, human rights, Taiwan, the origins of the coronavirus, etc.).
The most worrisome flashpoint would be over Taiwan. Given Taiwan’s dominant position in advanced semiconductor manufacturing, an invasion would have dire consequences for the global economy. Guarding against such an event is a priority for the Biden administration and has broad bipartisan support in Washington. It also has helped to push along the process of deepening diplomatic ties with countries in the region and repairing relationships that frayed during the Trump administration. We would make the case that an actual invasion (if it ever happens) is probably still years away.
The third major area of concern is the Middle East and the negotiations with Iran over its nuclear development program. The country has taken a hardline stance and progress toward a new agreement has been stymied. Two things are clear: Iran is now much closer to having a nuclear bomb, and Israel still will not tolerate such a major change in the region’s balance of power. This is another one of those grey swan situations, like the US/China/Taiwan stand-off. The risk of war may be low, but developments continue to head in a direction that could someday have catastrophic consequences.
Outside of these main issues, there are the more mundane developments that could deliver surprises that have market impact. The French presidential election in April could be significant for European risk assets if Macron loses his re-election bid. While we doubt that the eurozone will face stress from the outcome, there could be a market reaction if the winning candidate is perceived to be too far to the right or left, either ideologically or economically.
In Latin America, the Brazilian general elections in October will be one to watch. President Jair Bolsonaro’s main opponent is former President Luiz Inácio Lula da Silva. When Lula won in 2002, investors feared that Brazil’s economy and stock market would both tank. Instead, they embarked on historic advances as the nation caught the globalization wave generated by China’s integration into the world economy. Brazil may not be so lucky after this election. No matter who wins, the administration will face numerous challenges including economic stagnation, a still-rising already-high inflation rate, and an erosion of investor confidence in the country’s ability to turn itself around.
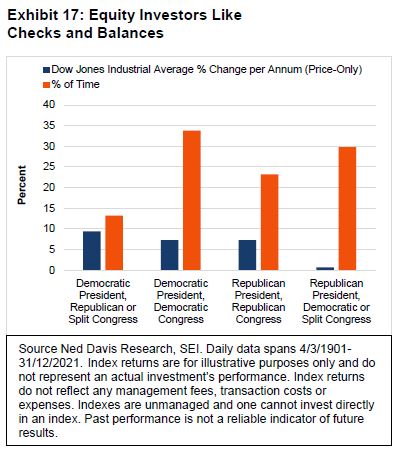
Last but not least, we would highlight the November mid-term elections in the US as a mundane yet potentially impactful event. At present, it appears that the House of Representatives will witness a change of control; it is just a matter how big of a win the Republicans will see. The Senate also could swing back into Republican hands, but that is a harder call to make. In any event, political gridlock in Washington is not going away anytime soon. Exhibit 17 highlights the fact that risk assets tend to perform well when there is a Democrat in the White House and the legislative branch is either split between the two parties or is controlled by the Republicans. Since 1901, the average price gain for the Dow Jones Industrial Average (DJIA) amounts to 9.4% per annum under this scenario.
Where’s the Exuberance?
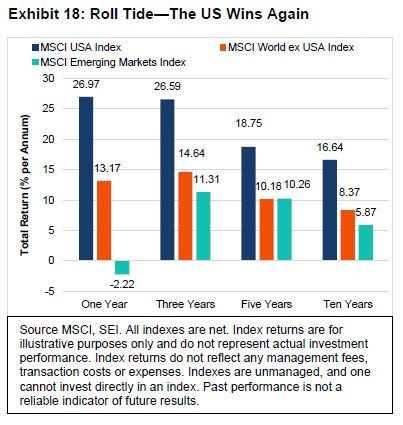
As we show in Exhibit 18, US equities, as measured by the MSCI USA Index (total return), have handily outperformed other developed and emerging equity markets over the past one-, three-, five- and 10-year time frames. We had hopes at the beginning of last year that a global profits recovery, higher inflation and rising interest rates would encourage investors to move out of high-priced growth stocks and into more attractively valued areas. We believed this rotation would benefit international stock markets at the expense of the US. This point of view got off to a good start, but emerging markets began losing ground relative to US equities on a year-to-date basis in March, while the MSCI World ex USA Index (total return) started lagging in June. We also note that our expectation of US dollar weakness did not pan out either as the currency climbed 7% for the year. The tailing off of relative performance versus US equities coincided with the emergence of the Delta variant in India, which then spread throughout the world in the months thereafter.
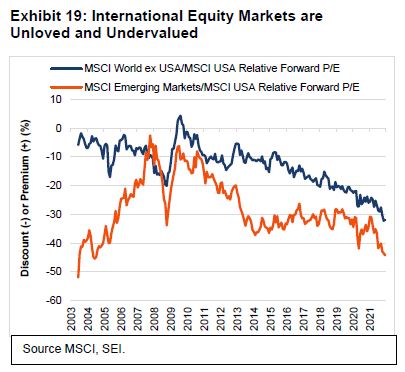
International investors can be forgiven for being somewhat frustrated. Earnings growth in 2021 for the companies that make up the MSCI World ex USA Index was exceptionally strong (+55.6%, according to Thomson Reuters I/B/E/S). The same can be said for the MSCI Emerging Markets Index companies (+56.2%). They both exceeded the earnings gain for MSCI US Index companies (+51.1%). As a consequence, the relative valuation of international markets versus the US has become only more attractive in the past year as we show in Exhibit 19. But old habits die hard, and the emergence of the Omicron variant has further delayed a long overdue rotation to cheaper, more cyclical stocks that are also less correlated to bond prices.
Equity markets stumbled in December owing to nervousness over the latest surge in COVID-19 cases. This wave, too, will pass. In fact, the Omicron variant is so transmissible that it may crest in a matter of weeks in the US and other countries in the northern hemisphere. It has already peaked in South Africa, where the variant was first discovered in November.
In any event, we are maintaining our optimistic view that global growth will reaccelerate as this latest COVID-19 wave fades. And, unlike last year at this time, a large percentage of people in advanced economies are either vaccinated or have gained some natural immunity through previous infection. There also should be significantly more vaccine doses available for populations in less-developed countries in the year ahead.
Although there have been pockets of speculative behaviour in some areas of the financial world—meme stocks, SPACs, cryptocurrencies and NFTs, for example—we do not see the sort of speculative fervour that would point to a serious equity correction in 2022. The economy would have to slow precipitously for reasons other than the temporary impact stemming from COVID-19 mobility restrictions; the trend in earnings would need to flat-line or turn negative.
Exhibit 20 updates the so-called “Blue Angels” chart for the S&P 500 stock price index, a concept created by economist Ed Yardeni. It compares the actual level of the S&P 500 Index (price only) against would-be levels of the Index at different price-to-forward earnings ratios (P/E). Yardeni calls this chart the Blue Angels because the ratio lines “fly” in parallel formation like the famed US squadron of the same name, while the S&P 500 Index (depicted here as the blue line with the diamond markers) cuts through the “contrails” of the various forward P/E ratio levels. We like this chart because it not only shows how expensive the stock market is at any given moment relative to its history, but it also highlights the current trajectory of forward operating earnings (as projected by bottom-up security analysts); climbing contrails point to rising earnings estimates, thereby supporting a higher stock price at a given P/E ratio.
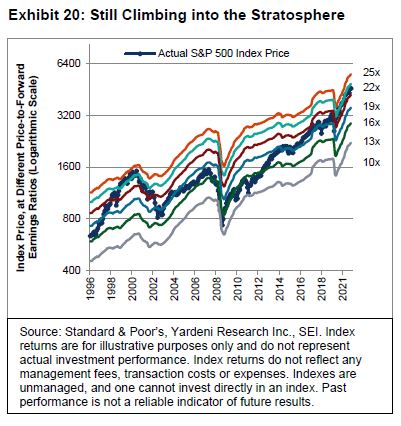
The forward earnings trend obviously has been quite strong, with analysts’ estimates of year-ahead earnings rising almost 36%% in the past 12 months. Since the S&P 500 price-only index has appreciated by “only” 27%, the P/E ratio has fallen, from 22.4 times forward earnings this time last year to a year-end 2021 reading of 21 times. Compared against the history of the past 25 years, this is still a high multiple—only the P/E ratios recorded during the tech bubble of 1999 and 2000 were in the same ballpark. Nonetheless, it is only when earnings estimates flatten and decline that the equity market begins to struggle. This happened during the technology bust of 2000, the global financial crisis of 2008, the growth scare of 2015 and, of course, the pandemic-induced lockdown in March 2020.
The trajectory of S&P 500 earnings growth probably will slow next year, but a gain in the 8%-to-12% range seems consistent with our macroeconomic call for continued above-average growth and inflation. How that will be reflected in stock prices is less certain. The P/E ratio could fall further in 2022 if investors become more concerned about the sustainability of the expansion, or if they revise their inflation and interest-rate expectations to the upside. Our own expectation is for an “average” year, where large-cap equities manage a 10% total return. That forecast is almost certain to be off the mark, however. It’s best to view it as a central tendency around a large margin of error.
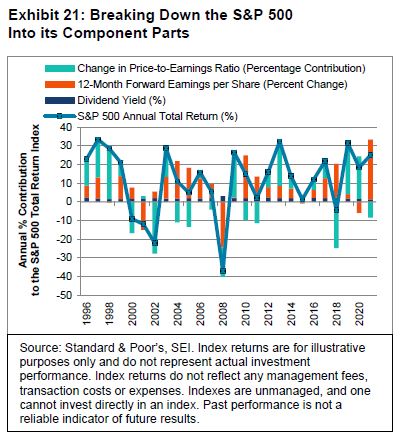
The simple truth is that there are too many moving parts when forecasting the behaviour of markets. Exhibit 21 breaks down the annual performance of the S&P 500 into its component parts—forward earnings, the change in the P/E ratio and the dividend yield. The dividend yield is a small contributor to the stock market’s total return in any given year and it doesn’t change very much. Earnings and multiples are big contributors and both can change dramatically from one year to the next. It’s hard enough to forecast earnings, especially in recent years; it is next to impossible to project the changes in the multiple applied to a given year’s earnings.
In our view at SEI, the real anomaly in the financial markets is the ultra-low levels of interest rates in the face of higher inflation and above-average growth in much of the world. Central-bank intervention aimed at keeping short-term rates at extremely low levels certainly bears some of the blame. Structural forces—technological innovations, aging populations, and heavy debt burdens—also seem to play a role. Just as the global financial crisis of 2007 to 2009 ushered in a period of slow growth and persistently low inflation, the pandemic and governments’ response to the challenge could be reversing those seemingly structural trends. Stronger economic growth and more persistent inflation pressures may force central banks to adopt more aggressive interest-rate policies than they currently envision.
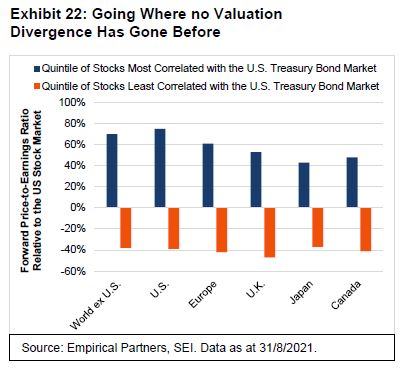
In last quarter’s Economic Outlook we presented a chart created by Empirical Research Partners. We present it again in Exhibit 22. The long bull market in bonds spawned a boom in those parts of the equity market that benefited the most from rising bond prices. As Exhibit 22 shows, this is not just a US–centric phenomenon. It spans all geographic regions. The 20% of the equity market with the highest positive correlation to US Treasury bond returns sports a forward P/E ratio amounting to a 40%-to-70% premium over the US stock market’s P/E. Meanwhile, the bottom 20% in terms of its correlation to bond prices trades at a 40% discount to the US stock market’s forward P/E. Even a partial reversion to the mean in relative valuation would have a significant impact on the share prices of many companies that benefited the most in the last two years.
We have pencilled in a 50-to-75 basis-point rise in 10-year Treasury bond yields for 2022. That gain should not derail the bull market in equities. It may be enough to catalyse a shift away from the most highly valued, interest-rate-sensitive areas of the market into the broader grouping of stocks that have been neglected for the past several years.
It should be no surprise that the expansions and contractions of the earnings multiple generally account for the bulk of the change in stock prices over a year’s time. However, over longer time horizons, these gyrations tend to offset each other. Fundamentals, as measured by growth in profits, have been the long-term driver of equity prices. Equities and other risky assets are generally not well correlated with the fundamentals in the short run; investors’ expectations can shift much more rapidly and far more dramatically than the fundamentals. Time will tell whether 2022 turns out to be one of those years.
What actions are our portfolio managers taking?
Within US equities, SEI’s active large-cap strategies are positioned similarly to the beginning of 2021, with an emphasis on higher-quality cyclical value, which we continue to favour over growth. While inflation and rising interest rates may be good short-term catalysts for value stocks, we also believe there is solid logic behind the decision to hold them on a long-term basis. The two largest positions in our active US small-cap strategies are quality and value. We have been adding to quality, which has done well but still looks cheap on a relative basis. We have also seen some rotation into quality at the margins. With overall valuations stretched, we believe quality is a good place to be at this point in the cycle.
There has been no fundamental shift in outlook for our international equity portfolios, and we continue to maintain our preference for value as valuation dispersions remain elevated. Quality and momentum-driven stocks also look attractive from a valuation perspective. We have moderated our growth positioning as momentum characteristics have shifted over the last 12 months. Our active strategies have seen a small rotation out of consumer discretionary names (slowing momentum) and into energy (attractive valuations). The pandemic outlook warrants caution, but we believe low-risk, high-quality businesses should benefit in the uncertain environment. We are underweight mega-cap consumer staples, health care and luxury consumer goods stocks on valuation grounds, and hold a bias toward more cyclical sectors such as industrials and media. Valuation dispersions at the stock level remain elevated, with value opportunities more reasonably balanced across different sectors.
Our emerging-market equities strategies also like value and mostly maintained their positioning from the prior period. Momentum and quality appear more reasonably priced than in previous quarters. We remained overweight information technology (especially semiconductors) as more countries rely on technology; we were also overweight the industrials sector (attractive opportunities in the current expansion). Our strategies were underweight internet-related stocks, healthcare and biotech on valuation concerns. At the country level, our largest exposures were an overweight to Korea and underweights to Chinese real estate and Brazil.
In global fixed-income markets, we remain pro-cyclically positioned for the potential of a global reflationary environment. Yields are still low, and we expect inflation to be sticky for the foreseeable future. In this environment, we believe credit-sensitive assets have the potential to outperform. Within corporate credit, we have a preference for lower-quality and shorter-maturity issues, which limits our sensitivity to rates. Our most active positioning is an underweight to core markets.
Our outlook on high-yield has not changed. New issuance is strong, with 2021 the largest calendar year of issuance, and refinancing is about 60% of new issuance. Interest rates and inflation are the primary concerns. We remain underweight BB rated bonds, overweight B and overweight CCC. We are overweight basic industry on the sector’s attractive relative value, and we are underweight to the telecommunications and services sectors. Leisure is also underweight as a result of caution due to impacts from COVID-19.
In the emerging-market portfolios, we’re about 2% short the US dollar as local currency looks attractive. Inflation and US rate policy going forward are the drivers. We’re long low-beta currencies (Zambia and others) and short Brazil, Turkey and South Africa, putting us close to the benchmark in terms of beta. We’re not stepping into the Chinese yuan, as it has been strong this year. We are short the Turkish lira. Emerging-market investment-grade spreads are tight versus developed-market investment-grade spreads. Local rates have been good for us. It is one of the few sweet spots for real yield. We did not own any high-yield names in Chinese real estate.
Important Information
This material is not directed to any persons where (by reason of that person's nationality, residence or otherwise) the publication or availability of this material is prohibited. Persons in respect of whom such prohibitions apply must not rely on this information in any respect whatsoever. Investment in the funds or products that are described herein are available only to intended recipients and this communication must not be relied upon or acted upon by anyone who is not an intended recipient.
This material represents an assessment of the market environment at a specific point in time and is not intended to be a forecast of future events, or a guarantee of future results. While considerable care has been taken to ensure the information contained within this document is accurate and up-to-date, no warranty is given as to the accuracy or completeness of any information and no liability is accepted for any errors or omissions in such information or any action taken on the basis of this information.
SEI Investments (Europe) Limited (SIEL) acts as distributor of collective investment schemes which are authorised in Ireland pursuant to the UCITS regulations and which are collectively referred to as the “SEI Funds” in these materials. These umbrella funds are incorporated in Ireland as limited liability investment companies and are managed by SEI Investments Global Limited, an affiliate of the distributor. SEI Investments (Europe) Limited utilises the SEI Funds in its asset management programme to create asset allocation strategies for its clients. Any reference in this document to any SEI Funds should not be construed as a recommendation to buy or sell these securities or to engage in any related investment management services. Recipients of this information who intend to apply for shares in any SEI Fund are reminded that any such application must be made solely on the basis of the information contained in the Prospectus (which includes a schedule of fees and charges and maximum commission available). Commissions and incentives may be paid and if so, would be included in the overall costs.) A copy of the Prospectus can be obtained by contacting your Financial Advisor, SEI Relationship Manager or by using the contact details shown below.
Data refers to past performance. Past performance is not a reliable indicator of future results. Investments in SEI Funds are generally medium- to long-term investments. The value of an investment and any income from it can go down as well as up. Returns may increase or decrease as a result of currency fluctuations. Investors may get back less than the original amount invested. SEI Funds may use derivative instruments which may be used for hedging purposes and/or investment purposes. This material represents an assessment of the market environment at a specific point in time and is not intended to be a forecast of future events.
In addition to the usual risks associated with investing, the following risks may apply: Bonds and bond funds are subject to interest rate risk and will decline in value as interest rates rise. High-yield bonds involve greater risks of default or downgrade and are more volatile than investment-grade securities, due to the speculative nature of their investments. International investments may involve risk of capital loss from unfavourable fluctuation in currency values, from differences in generally accepted accounting principles or from economic or political instability in other nations. Emerging markets involve heightened risks related to the same factors as well as increased volatility and lower trading volume. Narrowly focused investments, securities focusing on a single country, and investments in smaller companies typically exhibit higher volatility.
The opinions and views in this commentary are of SIEL only and are subject to change. They should not be construed as investment advice.
This information is issued by SEI Investments (Europe) Limited (SIEL) 1st Floor, Alphabeta, 14-18 Finsbury Square, London EC2A 1BR, United Kingdom. SIEL is authorised and regulated by the Financial Conduct Authority (FRN 191713).
Issued in South Africa by SEI Investments (South Africa) (Pty) Limited FSP No. 13186 which is a financial services provider authorised and regulated by the Financial Sector Conduct Authority (FSCA). Registered office: 3 Melrose Boulevard, 1st Floor, Melrose Arch 2196, Johannesburg, South Africa.
This commentary is intended for information purposes only and the information in it does not constitute financial advice as contemplated in terms of the Financial Advisory and Intermediary Services Act.
SEI sources data directly from FactSet, Lipper, and BlackRock unless otherwise stated.


