Winds of Change
September 2020 saw the beginning of a rotation out of the narrow concentration of U.S. growth and technology-focused stocks (as measured by the Russell 1000 Growth Index) that have outperformed the broader equity markets over the last several years and into a broader group of beaten-down assets (as measured by the Russell 1000 Value Index) that are more economically sensitive. This rotation has been supported by a broadening earnings recovery, favorable developments on the COVID-19 vaccine front, and expanded fiscal support. Improving growth and inflation expectations have further sparked market reversals from U.S. technology stocks toward a wider range of equities—particularly international and emerging markets as well as small-cap and value stocks; this environment has also boosted inflation-related assets (such as commodities and Treasury inflation-protected securities). From a top-down perspective, market and economic conditions also appear supportive of a continued rotation as markets reprice expectations for higher corporate earnings and a return to typical economic activity amid increasing COVID-19 vaccination rates and the impact of fiscal relief.
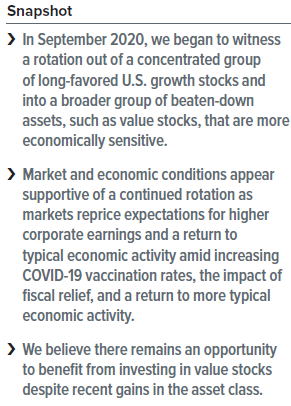
A change in leadership
Investor sentiment toward cyclical and value stocks has strengthened since September 2020 at the expense of growth stocks, driven by building optimism for faster vaccine rollouts, significant fiscal stimulus, and economic recovery. Following this positivity, the impact of rising inflation expectations and interest rates have worked to pressure the valuations of growth stocks; as the earnings of growth companies are priced further into the future than value stocks, higher rates will discount the present value of those future earnings to a greater extent. Exhibit 1 shows the recent reversal in market leadership.
How much of an opportunity?
As economically sensitive and cyclical areas of the economy continue to gain traction, we believe the recovery in valuations of these sectors should have plenty of room to run. Growth stocks, which inherently carry higher valuations compared to the broader market, have seen premiums on several metrics rise to levels well above longer-term averages. While some of this disparity has unwound in recent months, we believe the current environment remains attractive for value stocks fostered by several catalysts.
Valuations remain attractive
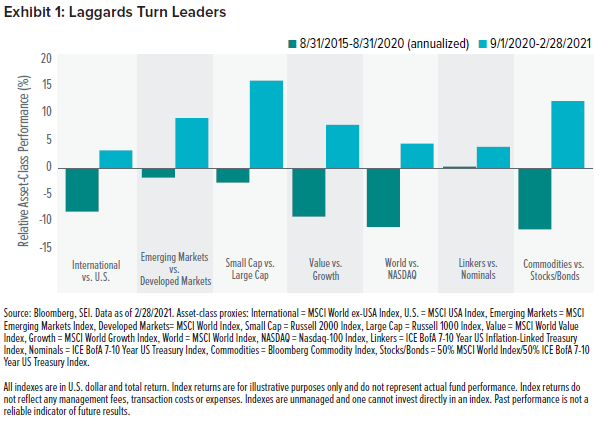
Valuations alone, whether frothy or underpriced, aren’t always a catalyst for performance—but we believe they are an essential consideration. Long-term relationships between a stock’s price and the fundamentals of its business usually hold up for good reason and should not vary by large degrees for extended periods; history shows that eventual reversions toward the mean among these long-term relationships are likely. In our view, today’s valuation spreads within the U.S. equity market present an attractive relative-return opportunity.
Exhibit 2 highlights this opportunity by looking at the possible convergence of some common metrics to longer-term averages. For example, if the current ratio of price-to-earnings for the Russell 3000 Value Index relative to the Russell 3000 Growth Index were to return to its historical average, the Russell 3000 Value Index would outperform the Russell 3000 Growth Index by about 28%. Other ratios show the potential for even greater outperformance.
Despite recent strength in value stocks over the last few months, if we continue to see a repricing in the sentiment between growth and value to these longer-term relationships, the relative-return opportunity for value should remain attractive.
Vaccines foster economic recovery
In addition to valuations, we expect the wider distribution of vaccines and normalizing of economic activity will help sustain the gradual strengthening of investor sentiment toward value and economically sensitive cyclical stocks. Growing vaccine adoption and an optimistic rollout timeline have already boosted expectations that government-imposed restrictions may soon be lessened.
Government stimulus helps
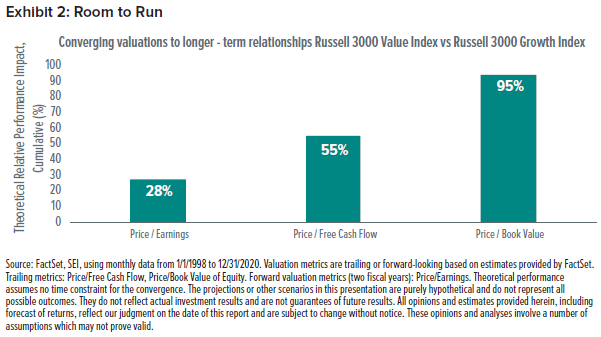
We have also seen an unprecedented amount and coordination of monetary and fiscal policies around the world, particularly in the U.S. Generous stimulus packages have provided incentives for consumers to increase spending and raise economic activity. Although the yield on longer-term Treasurys has shot higher in response, Exhibit 3 shows that it remains near the lower end of historical levels.
Despite the Federal Reserve signaling that it expects to keep short-term rates at record lows for the next several years, and assuming the economy continues to strengthen over the next six months, we expect longer-term interest rates to move higher as well—a move that would continue to favor the recent change in market leadership.
Investing vs. speculation
Investors may be tempted to chase trends or pursue narrow market-leadership segments when conditions in the markets change. We believe a balanced portfolio—shaped by diversification, risk mitigation and active positioning—is better equipped to withstand changing markets and performance trends over time. By taking a steady approach to achieving your financial goals you may not need to change your strategy every time the market moves up or down.
Glossary
Diversification refers to an investment strategy designed to balance risk and reward in a portfolio by spreading investments across a range of asset classes.
Fiscal stimulus refers to government policies designed to drive economic growth by cutting taxes or increasing government spending.
Monetary policy refers to the management of money supply and interest rates used by central banks.
Price/Book Value of Equity compares the market capitalization of a company to it’s the value of its net assets.
Price/Earnings compares the share price of a company to its per-share earnings.
Price/Free Cash Flow compares the market capitalization of a company to cash that the company has left over after it pays operating expenses and capital expenditures.
Treasury yield refers to the interest rate paid by the U.S. government on its debt obligations
Index Definitions
Bloomberg Commodity Index: tracks the prices of futures contracts on physical commodities on the commodity markets. The index is designed to minimize concentration in any one commodity or sector.
ICE BofA 7-10 Year US Inflation-Linked Treasury Index: measures the performance of U.S. dollar-denominated inflation-linked sovereign debt publicly issued by the U.S. government with an average remaining maturity between 7 and 10 years.
ICE BofA 7-10 Year US Treasury Index: measures the performance of U.S.Treasury bonds with an average remaining maturity between 7 and 10 years.
MSCI Emerging Markets Index: measures the performance of global emerging-market equities.
MSCI USA Index: measures the performance of the large- and mid-cap segments of the U.S. market.
MSCI World Index: measures the equity market performance of developed markets.
MSCI World ex-USA Index: measures the equity market performance of developed markets outside the U.S.
MSCI World Growth Index: measures the equity market performance of large- and mid-cap securities exhibiting overall growth style characteristics across developed-market countries.
MSCI World Value Index: measures the equity market performance of large- and mid-cap securities exhibiting overall value style characteristics across developed-market countries.
Nasdaq-100 Index: measures the equity market performance of the 100 largest, most actively traded U.S. companies listed on the Nasdaq stock exchange (with the exception of financial-industry stocks).
Russell 1000 Index: measures the activity of the U.S. large-cap equity market.
Russell 1000 Growth Index: measures the performance of the large-cap growth segment of the U.S. equity universe.
Russell 1000 Value Index: measures the performance of the large-cap value segment of the U.S. equity universe.
Russell 2000 Index: measures the activity of the U.S. small-cap equity market.
Russell 3000 Index: measures the performance of the 3000 largest 3000 U.S.-traded stocks.
Russell 3000 Growth Index: measures the performance of the broad growth segment of the U.S. equity universe.
Russell 3000 Value Index: measures the performance of the broad value segment of the U.S. equity universe.
Important Information
This material represents an assessment of the market environment at a specific point in time and is not intended to be a forecast of future events or a guarantee of future results. Positioning and holdings are subject to change. All information as of the date indicated. There are risks involved with investing, including possible loss of principal. This information should not be relied upon by the reader as research or investment advice, (unless you have otherwise separately entered into a written agreement with SEI for the provision of investment advice) nor should it be construed as a recommendation to purchase or sell a security. The reader should consult with their financial professional for more information.
Statements that are not factual in nature, including opinions, projections and estimates, assume certain economic conditions and industry developments and constitute only current opinions that are subject to change without notice. Nothing herein is intended to be a forecast of future events, or a guarantee of future results.
Certain economic and market information contained herein has been obtained from published sources prepared by other parties, which in certain cases have not been updated through the date hereof. While such sources are believed to be reliable, neither SEI nor its affiliates assumes any responsibility for the accuracy or completeness of such information and such information has not been independently verified by SEI.
There are risks involved with investing, including loss of principal. The value of an investment and any income from it can go down as well as up. Investors may get back less than the original amount invested. Returns may increase or decrease as a result of currency fluctuations. Past performance is not a reliable indicator of future results. Investment may not be suitable for everyone.
This material is not directed to any persons where (by reason of that person’s nationality, residence or otherwise) the publication or availability of this material is prohibited. Persons in respect of whom such prohibitions apply must not rely on this information in any respect whatsoever.
The information contained herein is for general and educational information purposes only and is not intended to constitute legal, tax, accounting, securities, research or investment advice regarding the strategies or any security in particular, nor an opinion regarding the appropriateness of any investment. This information should not be construed as a recommendation to purchase or sell a security, derivative or futures contract. You should not act or rely on the information contained herein without obtaining specific legal, tax, accounting and investment advice from an investment professional.
Information in the U.S. is provided by SEI Investments Management Corporation (SIMC), a wholly owned subsidiary of SEI Investments Company (SEI).
Information provided in Canada by SEI Investments Canada Company, the Manager of the SEI Funds in Canada.
Information issued in the UK by SEI Investments (Europe) Limited, 1st Floor, Alphabeta, 14-18 Finsbury Square, London EC2A 1BR which is authorised and regulated by the Financial Conduct Authority. Investments in SEI Funds are generally medium- to long-term investments.
SIEL has appointed SEI Investments (Asia) Limited (SEIAL) of Suite 904, The Hong Kong Club Building, 3 Jackson Road, Central, Hong Kong as the sub-distributor of the SEI UCITS funds. SEIAL is licensed for Type 4 and 9 regulated activities under the Securities and Futures Commission (“SFC”)
This information is being made available in Hong Kong by SEIAL. The contents of this document have not been reviewed by any regulatory authority in Hong Kong. You are advised to exercise caution in relation to the offer. If you are in any doubt about any of the contents of this document, you should obtain independent professional advice.
This information is made available in Latin America FOR PROFESSIONAL (non-retail) USE ONLY by SIEL.
Any questions you may have in relation to its contents should solely be directed to your Distributor. If you do not know who your Distributor is, then you cannot rely on any part of this document in any respect whatsoever.
Issued in South Africa by SEI Investment (South Africa) (Pty) Limited FSP No. 13186 which is a financial services provider authorised and regulated by the Financial Sector Conduct Authority (FSCA). Registered office: 3 Melrose Boulevard, 1st Floor, Melrose Arch 2196, Johannesburg, South Africa.


