Will This Bull Run Forever?
The latest bull-market cycle began during the worst phase of the economic cycle, as is often the case. Many countries were locking down their economies as deaths from COVID-19 were rising in uncontrolled fashion in the northeastern US and throughout Europe. When it became clear that massive monetary and fiscal support was on its way, markets responded immediately in anticipation of a successful rescue effort.
What has perhaps been more surprising is the relentlessness of the global stock-market rally over the past 18 months, with the S&P 500 Index setting the pace. As illustrated in Exhibit 1, despite ongoing challenges—such as the repeated waves of new COVID-19 infections around the world; the persistent shortages of goods and labour; ever-surging inflation rates; and the imminent fading of government economic relief—the bull market has continued its advance. In fact, the S&P 500 Index managed to avoid even a minor dip of 5% until the last trading session of September, when it posted a 5.06% drop from its all-time closing high achieved 2 September 2021. It had been almost a full year since this measure of the stock market last recorded a drop of 5% or more.
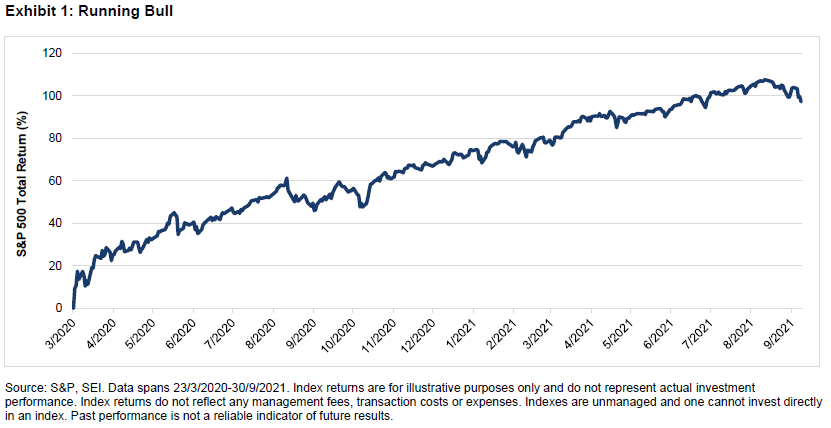
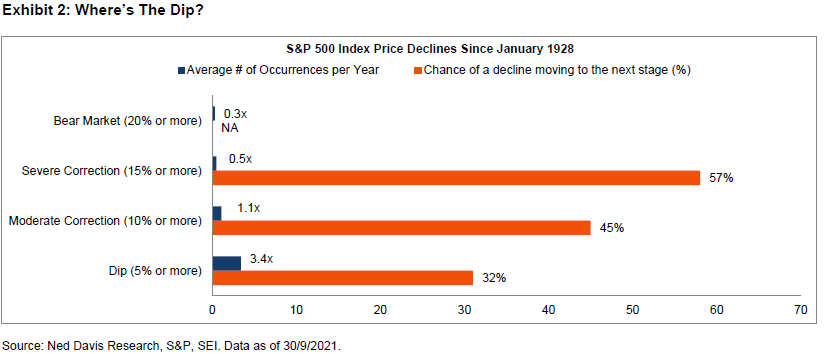
Exhibit 2 highlights the history of price declines in the S&P 500 Index since 1928. Over this time span, a price dip of 5% or more has occurred three-to-four times in an average year. And less than one-third of those dips turned into a more serious downturn. Remarkably, since the brief bear market associated with the onset of the pandemic in the early months of 2020, the S&P 500 Index hasn’t experienced even a moderate correction of 10% or more (which typically take place about once a year)
Severe corrections (15% or more) usually occur once every two years. The last time the S&P 500 Index dropped that much was during the February-to-March 2020 slide. Prior to that, there were only two severe corrections in the previous 10 years: between October and December 2018 and in the August-to-September 2011 period. As Exhibit 2 shows, 45% of moderate corrections have turned into severe ones, and 57% of severe corrections have morphed into bear markets of 20% or more. Bear markets have occurred, on average, once every 40 months since 1928. However, there have been only six downturns since 1979 that qualified as bear markets under this definition—amounting to one bear market every seven years. Perhaps we should start calling bear markets the “Seven-Year Glitch.”
Underneath the currently placid surface of the market, one can nevertheless find signs of investor nervousness. Exhibit 3 on the following page examines the total-return performance of the S&P 500 Index by style relative to the overall S&P 500 Index (total return) over the past five years. (These style-specific indexes are published by S&P Dow Jones, a division of S&P Global1.)
The growth and momentum investment styles have made a big comeback relative to the overall S&P 500 Index since the middle of May 2021—approximately when the Delta variant of COVID-19 was wreaking havoc in India and just one week before the UK entered a two-month surge in caseloads. Other countries including the US soon followed the same dismal trajectory in infection rates. In a natural reaction to the prospect of more lockdowns and delayed returns to normal life, investors revisited those companies that benefitted the most during 2020—namely the work-at-home, big technology stocks and other high-multiple companies that do well when interest rates fall.
It’s no coincidence that rally in both growth and momentum stocks coincided with these events. Although the S&P 500 Growth Index and S&P 500 Momentum Index represent distinct investing styles, over 40% of their total market capitalisations are both dominated by information technology stocks—which represent a huge portion of those companies that investors flocked to as the Delta variant surged.
Meanwhile, the S&P 500 Value Index, which holds far fewer information technology stocks, has given up nearly all the relative ground it gained between September 2020 and March 2021.
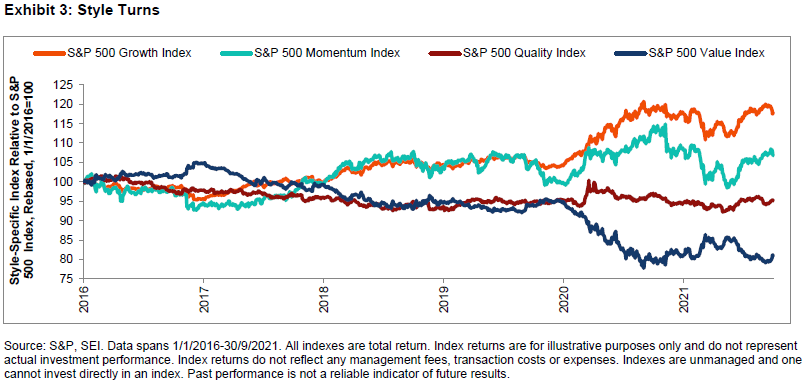
Source: S&P, SEI. Data spans 1/1/2016-30/9/2021. All indexes are total return. Index returns are for illustrative purposes only and do not represent actual investment performance. Index returns do not reflect any management fees, transaction costs or expenses. Indexes are unmanaged and one cannot invest directly in an index. Past performance is not a reliable indicator of future results.
What’s next?
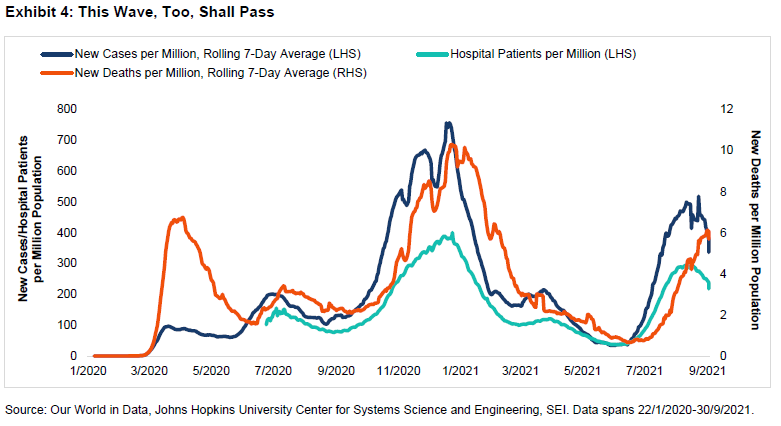
The shift in investor interest back toward the growth-oriented large-cap stocks is understandable. Exhibit 4 on the next page shows how sharply the seven-day average of daily new cases, hospitalisations and deaths per million population have climbed in the US over recent months. The number of cases in the US appears to be cresting, but there is no guarantee that it will continue. We are, after all, heading into that time of year when respiratory illnesses take hold because school is back in session and people are moving indoors and gathering together for the holidays. On a positive note, vaccinations are picking up again, the most vulnerable parts of the population are now receiving booster shots, and younger children should gain access to the vaccine before the end of the year.
We therefore do not expect the recent bounce-back in the growth and momentum styles at the expense of value and cyclical stocks to be a long-lasting one. In our view, economic growth in the US and globally should continue over the next year or two at a rate that meaningfully exceeds the sluggish pace of the years that followed the 2007-to-2009 global financial crisis.
This does not mean that we expect the bull market to advance in an uninterrupted fashion forever. We have been humbled enough times in the past not to put a date on a pullback or predict the level of a future decline. But we do believe that temporary pullbacks are a normal and expected part of the market cycle, and we would not be surprised to see the current one extend a bit further. Keep in mind that severe corrections and bear markets are typically associated with significant economic disruption, which we do not anticipate occurring anytime soon. In any event, we do not believe that short-term market fluctuations—even corrections of more than 10%—are a valid reason to abandon a well-constructed asset allocation that serves as the foundation of a long-term investment portfolio. If anything, we think such dips should serve as reminders that maintaining a disciplined approach in all market environments should help investors stay on the path to achieving their long-term investment objectives.
Important Information
Data refers to past performance. Past performance is not a reliable indicator of future results.
Investments in SEI Funds are generally medium- to long-term investments. The value of an investment and any income from it can go down as well as up. Investors may get back less than the original amount invested. Returns may increase or decrease as a result of currency fluctuations. Additionally, this investment may not be suitable for everyone. If you should have any doubt whether it is suitable for you, you should obtain expert advice.
No offer of any security is made hereby. Recipients of this information who intend to apply for shares in any SEI Fund are reminded that any such application may be made solely on the basis of the information contained in the Prospectus. This material represents an assessment of the market environment at a specific point in time and is not intended to be a forecast of future events, or a guarantee of future results. This information should not be relied upon by the reader as research or investment advice regarding the funds or any stock in particular, nor should it be construed as a recommendation to purchase or sell a security, including futures contracts.
In addition to the normal risks associated with equity investing, international investments may involve risk of capital loss from unfavourable fluctuation in currency values, from differences in generally accepted accounting principles or from economic or political instability in other nations. Bonds and bond funds are subject to interest rate risk and will decline in value as interest rates rise. High yield bonds involve greater risks of default or downgrade and are more volatile than investment grade securities, due to the speculative nature of their investments.
Narrowly focused investments and smaller companies typically exhibit higher volatility. SEI Funds may use derivative instruments such as futures, forwards, options, swaps, contracts for differences, credit derivatives, caps, floors and currency forward contracts. These instruments may be used for hedging purposes and/or investment purposes.
While considerable care has been taken to ensure the information contained within this document is accurate and up-to-date, no warranty is given as to the accuracy or completeness of any information and no liability is accepted for any errors or omissions in such information or any action taken on the basis of this information.
This information is issued by SEI Investments (Europe) Limited, 1st Floor, Alphabeta, 14-18 Finsbury Square, London EC2A 1BR which is authorised and regulated by the Financial Conduct Authority. Please refer to our latest Full Prospectus (which includes information in relation to the use of derivatives and the risks associated with the use of derivative instruments), Key Investor Information Documents and latest Annual or Semi-Annual Reports for more information on our funds. This information can be obtained by contacting your Financial Adviser or using the contact details shown above.
SEI sources data directly from FactSet, Lipper, and BlackRock, unless otherwise stated.
The opinions and views in this commentary are of SEI only and should not be construed as investment advice.


