Why in the world should I own emerging-market debt?
The strategic case for emerging-market debt (EMD) remains strong, despite challenged performance in recent years. Historically, EMD has offered a compelling risk premium and diversified equity risk, while providing exposure to emerging-market economies. Given these attributes, we believe that strategic allocations to EMD can improve a portfolio’s expected risk-adjusted return.
Total return drivers for EMD
Total returns for fixed-income asset classes can be decomposed into:
- Risk-free return
- Term premium (the compensation investors require for taking on risk that interest rates may change over time)
- Risk premium (the compensation investors require for taking on default risk and other risks)
Investors can take on term premium and/or risk premium to seek a return above the risk-free rate. Exhibit 1 illustrates this trade off from a historical perspective, comparing three major fixed-income asset classes: investment-grade corporates (IG), EMD, and high-yield corporates (HY).
HY typically earns the highest risk premium of the three asset classes (reflecting the highest default risk of the bunch), followed by EMD, and then IG. Meanwhile, IG and EMD tend to have longer maturities compared to HY and therefore earn higher term premiums. This makes intuitive sense; IG corporations and emerging-market (EM) governments are more likely to operate as going concerns in the distant future compared to HY corporate counterparts. Therefore, there is more appetite from market participants to buy longer-dated bonds from IG corporate and EMD issuers.
These characteristics highlight how EMD can complement IG and HY allocations in portfolios. Like HY, EMD demands a large risk premium, which investors can harvest to earn returns in excess of IG bond returns. On the other hand, EMD tends to be higher duration than HY, which means EMD can disproportionally benefit when yield curves are steep or when yields decline.
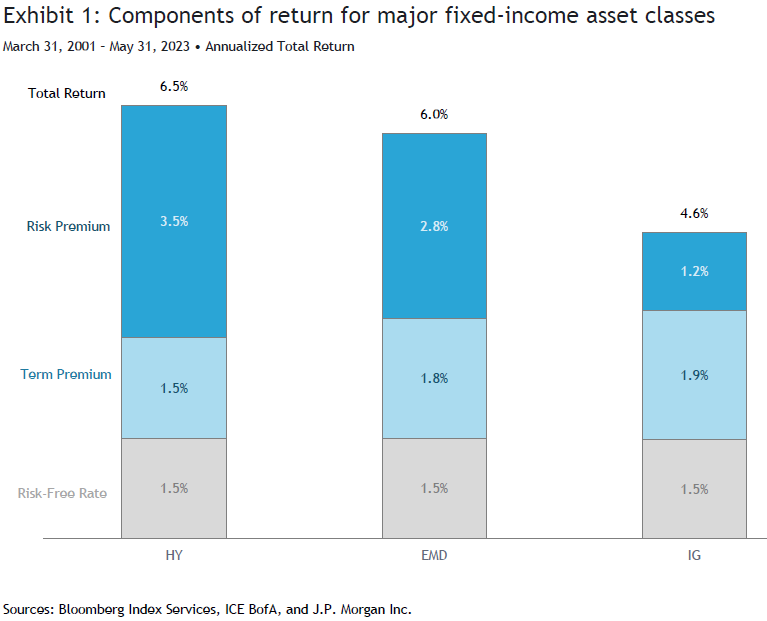
Notes: "HY" is the Bloomberg U.S. Corporate High Yield Index; "EMD" is a 50%/50% composite of the J.P. Morgan EMBI Global Diversified Index/J.P. Morgan GBI-EM Global Diversified Index; "IG" is the Bloomberg U.S. Corporate Investment Grade. March 2001 was chosen as the start date because it is the start of the 2001 recession. Therefore, this analysis includes two full business cycles plus the current business cycle. The "Risk-Free Rate" is the return on the ICE BofA 3-Month U.S. Treasury Bill Index. The "Term Premium" is the return on duration-matched U.S. Treasuries; returns are based on the BofA ICE 2-Year, 3-Year, 5-Year, 7-Year, and 10-Year U.S. Treasury Indexes and are linearly interpolated for durations in between. The "Risk Premium" is the excess of the HY, EMD, or IG index return less the Risk-Free Rate plus the Term Premium.
Index returns are for illustrative purposes only and do not represent actual fund performance. Index returns do not reflect any management fees, transaction costs or expenses. Indexes are unmanaged and one cannot invest directly in an index. Past performance does not guarantee future results.
For the J.P. Morgan GBI-EM Global Diversified Index, performance prior to 6/1/2005 is backtested. Back-tested performance, which is hypothetical and not actual performance, is subject to inherent limitations because it reflects application of an Index methodology in hindsight. No theoretical approach can take into account all of the factors in the markets in general and the impact of decisions that might have been made during the actual operation of an index. Actual returns may differ from, and be lower than, back-tested returns. Past performance is no guarantee of future results.
Diversification
As shown in Exhibit 1, the risk-free rate and term premium were significant components of total return for EMD. Because these components are not perfectly correlated to equity market returns, exposure to them helped diversify equity risk in portfolios. Additionally, direct regional exposure to EM economies differentiates EMD from other fixed-income asset classes like developed-market (DM) sovereign and corporate bonds.
Emerging-market economies often differ from DM counterparts in various ways, such as demographics, consumer demand, and industry exposure. These metrics all feed into economic growth and inflation, which ultimately drive interest rates and, to some extent, currency valuations. These differences typically contribute to a low correlation between the returns of EM and DM bonds. For instance, Exhibit 2 shows that the rolling 60-month correlation between EM and DM sovereign bonds over the past decade has stayed in the 0 to 0.5 range with an average of just 0.2.
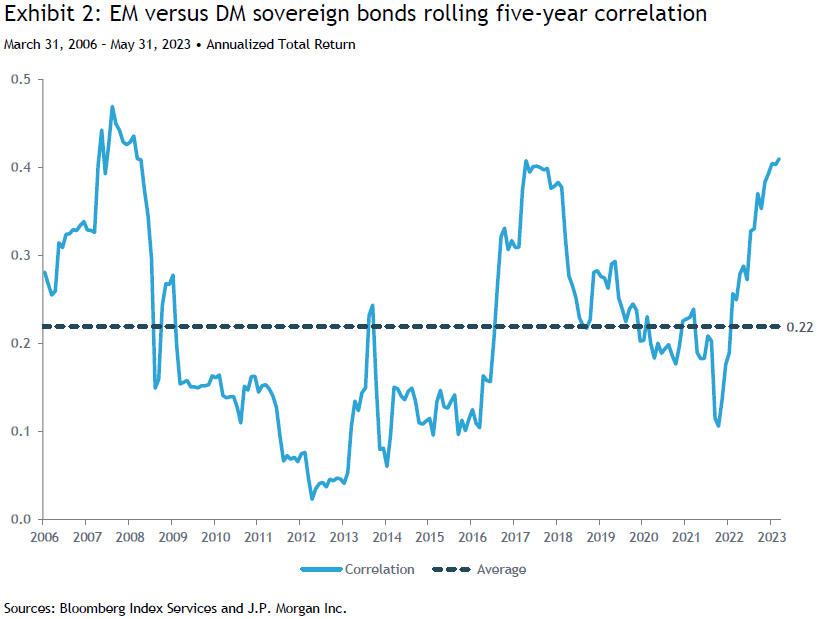
Notes: "EM sovereigns" are represented by a 50%/50% composite of the J.P. Morgan EMBI Global Diversified Index/J.P. Morgan GBI-EM Global Diversified Index; "DM sovereigns" are represented by the Bloomberg Global Treasury Index (Hedged USD). Returns data start on March 2001 because it is the start of the 2001 recession. Therefore, this analysis includes two full business cycles plus the current business cycle. Data are monthly.
Long-term performance
Over the long term, we believe investors can improve portfolio returns via the risk premia associated with EMD. Of course, as is the case with any financial asset, EMD will not enhance portfolio returns every single year and may even detract from portfolio performance at times—as has frequently occurred in the past decade.
For instance, consider two portfolios:
- A “simple” 60/40 stock/bond portfolio.
- The same simple portfolio with a 5% allocation to EMD, funded from stocks and bonds in equal proportion.
As shown in Exhibit 3, the portfolio with EMD outperformed the simple 60/40 portfolio every year from 2001 through 2012. This EMD outperformance coincided with a widening in the EM versus DM GDP growth rate differential and a weaker US dollar.
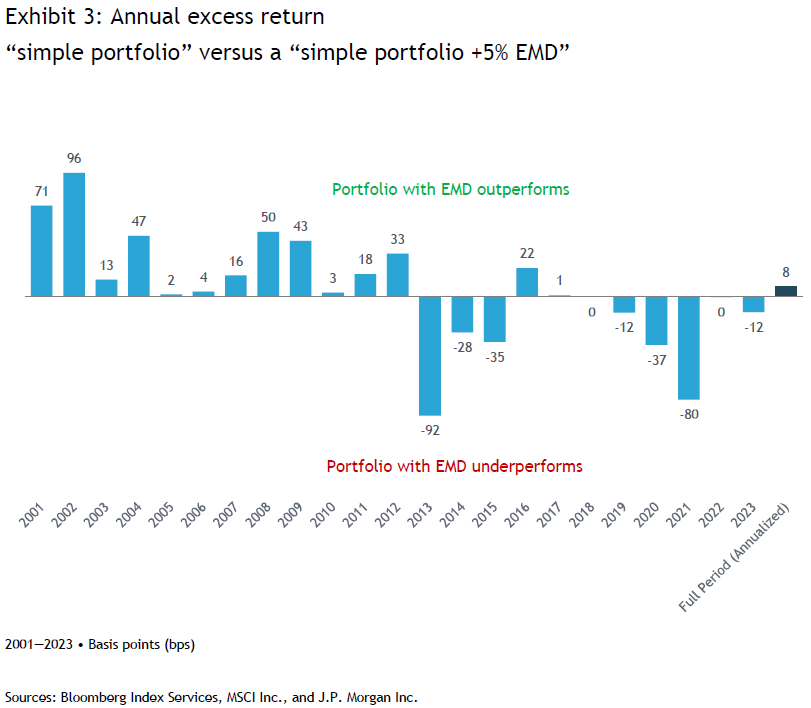
Notes: The "simple portfolio" is a 60%/40% MSCI ACWI (USD)/Bloomberg Global Aggregate Bond Index (USD Hedged). The "simple portfolio +5% EMD" adds a 5% allocation to EMD, funded 50% from MSCI ACWI and 50% from Bloomberg Global Aggregate Bond Index. Past performance is no guarantee of future results.
The global financial crisis ushered in a new cycle, wherein easy monetary policy in DM economies supported DM-based asset valuations. Meanwhile, the EM-versus-DM growth differential narrowed and the U.S. dollar strengthened. These trends contributed to EMD underperforming or performing in line with the 60/40 in every year except one from 2013 up through this year to date. Yet ultimately, an investor who stuck with a strategic allocation to EMD would have still come out on top, generating 8 bps of outperformance per year (about 160 bps cumulatively) versus the 60/40 over the full period.
We believe EMD is worth the risk
The questions around EMD aren’t unique or surprising given recent performance. Over any given timeframe, investors will be able to point to some part of their portfolios and experience regret, whether for not having owned more of an outperforming asset class or having owned any of an underperforming asset class. It’s human nature. It’s also a misguided exercise.
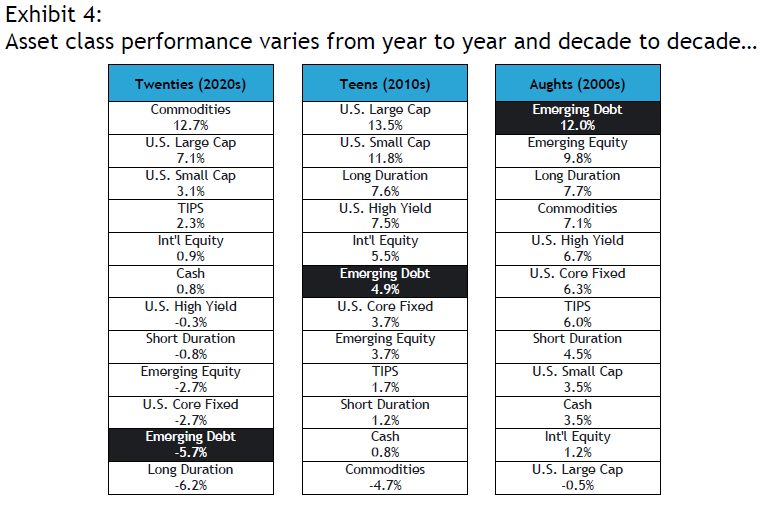
Annualized returns. “Aughts” = 1/1/2000 to 12/31/2009. “Teens” = 1/1/2010 to 12/31/2019. “Twenties”: 1/1/2020 to 12/31/2022. Asset-class proxy indexes: US Large = Russell 1000, US Small = Russell 2000, Int’l Equity = MSCI EAFE, EM Equity = MSCI Emerging Markets, Core Fixed = Bloomberg Barclays Aggregate Index, High Yield = Bloomberg Barclays US Corporate High Yield Total Return Index, EM Debt = 100% JP Morgan EMBI Global Diversified until 2003 and 50% JP Morgan EMBI Global Diversified/50% JP Morgan GBI EM Global Diversified thereafter, TIPS = Bloomberg Barclays 1-5 Year US TIPS Index, Commodities = Bloomberg Commodity Index, Long Duration = Bloomberg Barclays US Long Government/Credit Index, Short-Duration = ICE BofAML 1-3 Year US Treasury Index, Cash = ICE BofAML USD 3-Month Deposit Offered Rate Constant Maturity Index. Sources: Index providers, SEI. Past performance is not a guarantee of future results.
Investors must often remind themselves not to fall into the hindsight trap. If a portfolio and its components make sense at a given point in time, before the future is known, then they make sense. As investors, we are always going to experience regrets of some kind. How we think about and manage the related emotions is critical to success.
As for EMD, despite the current cycle of challenged performance, we continue to view it as an effective way to diversify risk premia and, therefore, believe it warrants an allocation in strategic portfolios when risk budgets allow. We can’t guarantee when or even if the EMD performance cycle will turn around. We acknowledge that nobody knows for certain which asset classes will perform best over a particular time horizon, which is why diversification is so important. Investors can better manage their risk by diversifying their investments across a wide range of assets and geographies. Maintaining EMD allocations helps to ensure that investors’ exposure is not overly concentrated in both DM economies and equity risk moving forward.
Important information
Diversification may not protect against market risk. There is no assurance the goals of the strategies discussed will be met.
This material represents an assessment of the market environment at a specific point in time and is not intended to be a forecast of future events or a guarantee of future results. Positioning and holdings are subject to change. Statements that are not factual in nature, including opinions, projections and estimates, assume certain economic conditions and industry developments and constitute only current opinions that are subject to change without notice. Nothing herein is intended to be a forecast of future events, or a guarantee of future results. All information as of the date indicated. There are risks involved with investing, including possible loss of principal. This information should not be relied upon by the reader as research or investment advice, (unless you have otherwise separately entered into a written agreement with SEI for the provision of investment advice) nor should it be construed as a recommendation to purchase or sell a security. The reader should consult with their financial professional for more information.
Certain economic and market information contained herein has been obtained from published sources prepared by other parties, which in certain cases have not been updated through the date hereof. While such sources are believed to be reliable, neither SEI nor its affiliates assumes any responsibility for the accuracy or completeness of such information and such information has not been independently verified by SEI.
There are risks involved with investing, including loss of principal. The value of an investment and any income from it can go down as well as up. Investors may get back less than the original amount invested. Returns may increase or decrease as a result of currency fluctuations. Past performance is not a reliable indicator of future results. Investment may not be suitable for everyone. Diversification may not protect against market risk.
This material is not directed to any persons where (by reason of that person's nationality, residence or otherwise) the publication or availability of this material is prohibited. Persons in respect of whom such prohibitions apply must not rely on this information in any respect whatsoever.
The information contained herein is for general and educational information purposes only and is not intended to constitute legal, tax, accounting, securities, research or investment advice regarding the strategies or any security in particular, nor an opinion regarding the appropriateness of any investment. This information should not be construed as a recommendation to purchase or sell a security, derivative or futures contract. You should not act or rely on the information contained herein without obtaining specific legal, tax, accounting and investment advice from an investment professional.
Information in the U.S. is provided by SEI Investments Management Corporation (SIMC), a wholly owned subsidiary of SEI Investments Company (SEI).
Information issued in the UK by SEI Investments (Europe) Limited, 1st Floor, Alphabeta, 14-18 Finsbury Square, London EC2A 1BR which is authorised and regulated by the Financial Conduct Authority. Investments in SEI Funds are generally medium- to long-term investments.
SIEL has appointed SEI Investments (Asia) Limited (SEIAL) of Suite 904, The Hong Kong Club Building, 3 Jackson Road, Central, Hong Kong as the sub-distributor of the SEI UCITS funds.
The contents of this document have not been reviewed by any regulatory authority in Hong Kong. You are advised to exercise caution in relation to the offer. If you are in any doubt about any of the contents of this document, you should obtain independent professional advice
This information is made available in Latin America FOR PROFESSIONAL (non-retail) USE ONLY by SIEL.
Any questions you may have in relation to its contents should solely be directed to your Distributor. If you do not know who your Distributor is, then you cannot rely on any part of this document in any respect whatsoever.
Issued in South Africa by SEI Investments (South Africa) (Pty) Limited FSP No. 13186 which is a financial services provider authorised and regulated by the Financial Sector Conduct Authority (FSCA). Registered office: 3 Melrose Boulevard, 1st Floor, Melrose Arch 2196, Johannesburg, South Africa.


