Quarterly Market Commentary: Global markets power through persistent volatility.
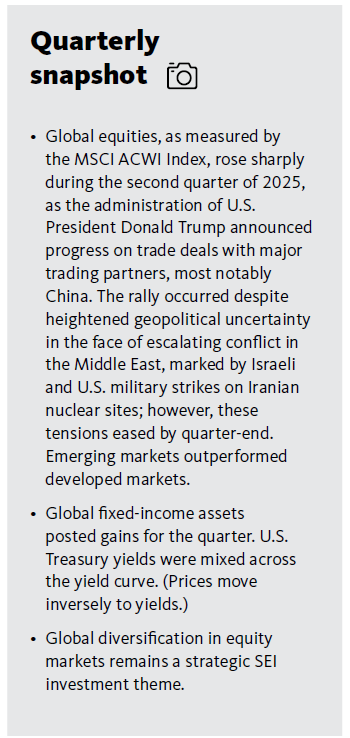
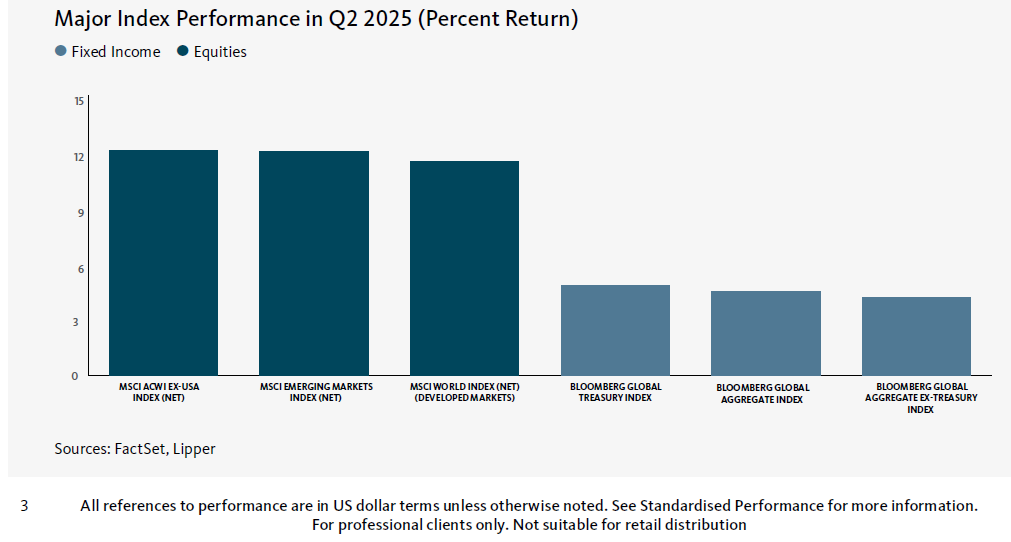
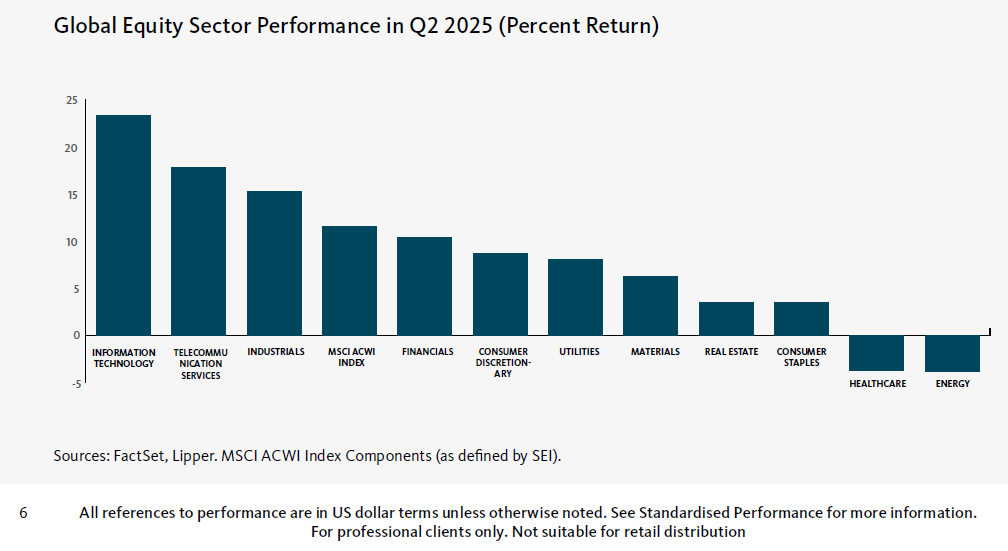
Global equities, as measured by the MSCI ACWI Index, rose sharply during the second quarter of 2025, as the administration of U.S. President Donald Trump announced progress on trade deals with major trading partners, most notably China. The rally occurred despite heightened geopolitical uncertainty in the face of escalating conflict in the Middle East, marked by Israeli and U.S. military strikes on Iranian nuclear sites; however, these tensions eased by quarter-end. The U.S. broad-market S&P 500 Index and the tech-heavy Nasdaq Composite Index climbed 10.9% and 18.0%, respectively, for the quarter, closing the period at record highs.
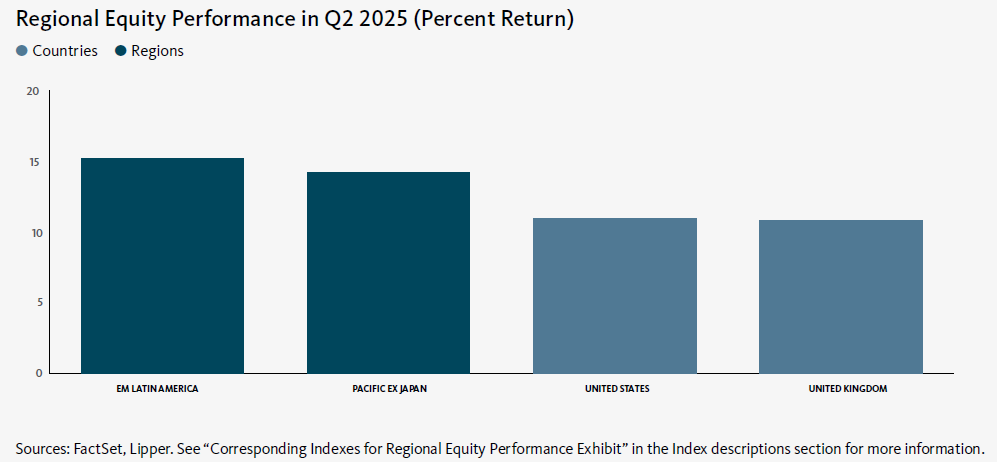
Emerging markets outperformed developed markets in the second quarter. The Latin America region (excluding Brazil) was the top performer within the emerging markets for the quarter due mainly to strength in Mexico. Hungary led the robust performance in Eastern Europe. Conversely, the Saudi Arabia market lost ground during the period. The Pacific region and the European Union countries were the strongest performers within the developed markets for the quarter. Hong Kong and Australia led the rally in the Pacific markets, while the Netherlands and Spain were the main contributors to the upturn in European Union stocks. The Nordic countries recorded positive returns for the period, but were the primary developed-market laggards.1
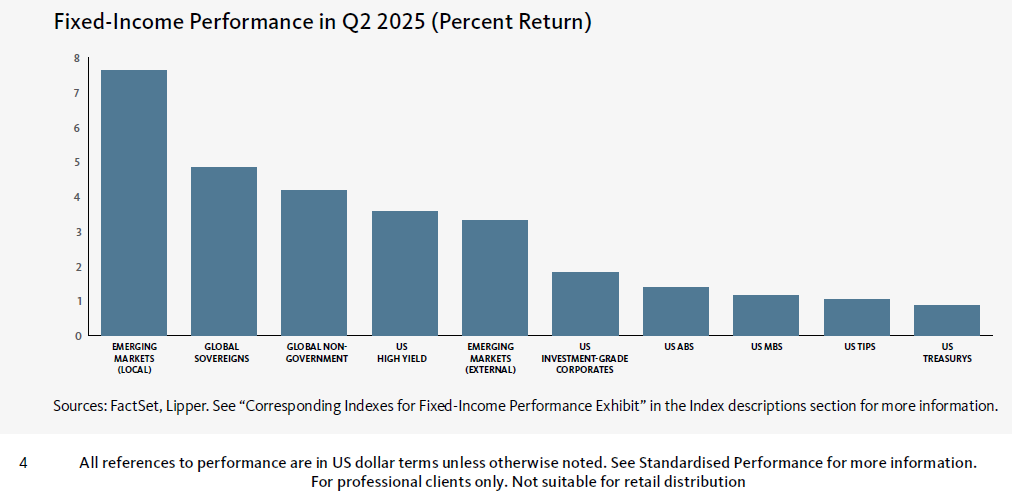
Global fixed-income assets, as measured by the Bloomberg Global Aggregate Bond Index, gained 4.5% (in U.S. dollars) for the second quarter. High-yield bonds led the U.S. fixed-income market, followed by investment-grade corporate bonds and U.S. Treasury securities. Mortgage-backed securities (MBS) recorded losses during the quarter. U.S. Treasury yields were mixed across the yield curve. Yields on 2-, 3-, and 5-year Treasury notes dipped by corresponding margins of 0.17%, 0.21%, and 0.17% to 3.89%, 3,89%, and 3.96%, respectively, while the 10-year Treasury yield edged up 0.1% to 4.24%. The yield curve inverted (3-month yields exceeded 10-year yields) during the quarter.2
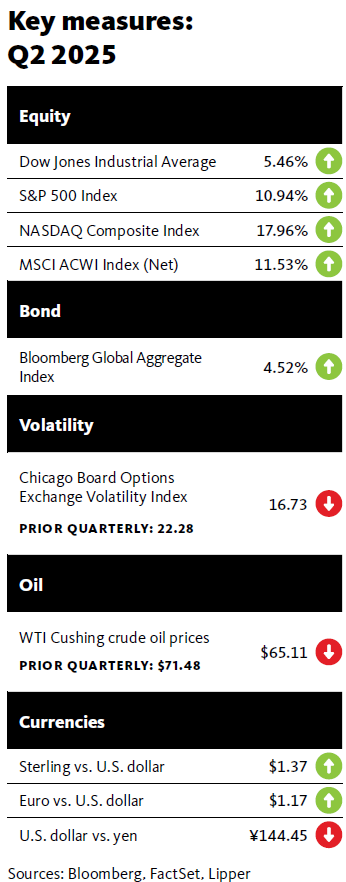
Global commodity prices, as represented by the Bloomberg Commodity Index, were down 3.1% in the second quarter. Oil prices fell sharply in June after moving higher earlier in the quarter, as the announcement of a ceasefire between Israel and Iran eased geopolitical concerns, and investors anticipated a rise in inventories globally. Spot prices for West Texas Intermediate (WTI) and Brent crude oil prices fell 8.9% and 10.7%, respectively, during the quarter. The 5.0% rise in the gold price over the period was attributable to an increase in demand for safe-haven assets spurred by the Israel-Iran military conflict and continued central bank purchases. The New York Mercantile Exchange (NYMEX) natural gas price fell 15.2% in response to a decline in global demand and increasing inventory in the U.S. The 0.2% uptick in the wheat price for the quarter resulted mainly from forecasts that unusually warm summer temperatures and extreme weather could reduce stockpiles in North America, Asia, and Europe.
On the geopolitical front, on 13 June (Iran local time), Israel launched targeted strikes on Iran’s nuclear program and military leadership in an effort to hamper the Iranian government’s efforts to enrich uranium over concerns that it could be used in the production of nuclear weapons. Major General HosseinSalami, the leader of Iran’s Islamic Revolutionary Guard Corps, was among those killed in the attacks. Later in the day, the Israeli military announced that it had detected “dozens” of missiles launched from Iran toward Israel. In its announcement of the attack, the Israel Defense Force (IDF) said, “The Aerial Defense Array [Israel’s missile and air defense system] is currently identifying and intercepting launches.” On 22 June (Iran local time), the U.S. conducted targeted military strikes on several of Iran’s nuclear facilities. U.S. military forces dropped 14 Massive Ordnance Penetrators (dubbed “bunkerbuster bombs”) on the Fordow and Natanz nuclear sites in Iran, and fired additional precision-guided weapons at the Isfahan nuclear site. The Trump administration said that the attacks severely damaged the nuclear facilities.
U.S. trade policy remained a focal point for the global financial markets for much of the quarter. On 2 April (which the Trump administration dubbed “Liberation Day” for U.S. trade policy), the U.S. government announced a blanket minimum tariff of 10% for all imports, and imposed so-called reciprocal tariffs on multiple countries (with the exception of goods from Canada and Mexico covered under the U.S.-Mexico-Canada Agreement). However, shortly thereafter, Trump announced a 90-day suspension of these reciprocal tariffs, with exception of China. The action followed a brief period of significant volatility in the U.S. Treasury market. The yield on the 10-year U.S. Treasury note rose sharply on fears that the tariffs could have a negative impact on the economy and reignite inflation. Bond prices and yields move inversely. The yield subsequently retreated after the announcement of the tariff suspension.
Under a tentative agreement with the U.K., which Trump and U.K. Prime Minister Keir Starmer announced on 8 May, U.K. steel and aluminum imports will be exempt from the 25% tariff and levies on autos manufactured in the U.K. will be reduced from 25% to 10% for the first 100,000 imported vehicles. The agreement stipulates that the U.K. will purchase Boeing jets worth $10 billion and ease restrictions on imports of ethanol from the U.S. Imported goods from the U.K. will still be subject to the global 10% tariff implemented in early April. Trump announced in late May that he was a delaying the imposition of the levies from 1 June to 9 July after the EU agreed to accelerate negotiations. He said that European Commission President Ursula von der Leyen requested an extension of the tariff deadline while trade negotiations continued. On 26 June, U.S. Commerce Secretary Howard Lutnick announced that the U.S. and China had completed a trade agreement that the countries negotiated last month during talks in Geneva, Switzerland. Lutnick also said that the U.S. was close to finalizing trade agreements with 10 other countries. The ongoing tariff dispute remains highly volatile and in constant flux.
Economic data
U.S.
The Department of Labor reported that the consumer-price index (CPI) ticked up 0.1% in May, down marginally from the 0.2% rise in April and slightly below expectations. Housing and food costs each increased 0.3% for the month. Conversely, the energy index declined 1.0% in May due to a steep drop in gasoline prices. The CPI advanced 2.4% year-over-year—marginally higher than the 2.3% increase in April and in line with expectations. Costs for utility gas service and electricity climbed 15.3% and 4.5%, respectively, over the previous 12-month period. Gasoline and fuel oil prices declined by corresponding margins of 12.0% and 8.6%. Core inflation, as measured by the CPI for all items less food and energy, rose 2.8% year-over-year in May, unchanged from the annual increase in April. Food prices were up 2.9% over the previous 12-month period, while energy costs fell 3.5%.
According to the third estimate from the Department of Commerce, U.S. gross domestic product (GDP) decreased at an annual rate of 0.5% in the first quarter of 2025—sharply lower than the 2.4% rise in the fourth quarter of 2024, and down from the government’s second estimate of a 0.2% dip. The economic contraction in the first quarter was attributable mainly to a surge in imports (a subtraction from GDP) as businesses rushed to purchase goods before the Trump administration’s import tariffs took effect in early April. GDP also was hampered by a drop in government spending. Conversely, nonresidential fixed investment (purchases of equipment and software, and nonresidential structures) and consumer spending each rose for the quarter.
U.K.
The Office for National Statistics (ONS) reported that inflation in the U.K., as measured by the CPI, increased 0.2% in May, sharply lower than the 1.2% rise in April. The CPI advanced at an annual rate of 3.4% in May, down marginally from the 3.5% year-over-year increase for the previous month. Furniture and household goods, and clothing and footwear posted the largest gains in May, while transportation costs declined. Prices for housing and household services, and education prices were up 7.7% and 7.5%, respectively, over the previous 12-month period, while clothing and footwear priced dipped 0.3%. Core inflation, which excludes volatile food, energy, and alcohol and tobacco prices, increased at an annual rate of 3.8% in May, decelerating from the 3.8% year-over-year upturn in April.3
The ONS also announced that U.K. GDP increased 0.7% in the first quarter of 2025, up from the 0.1% growth rate in the fourth quarter of 2024. Output in the production, services, and construction sectors rose 1.3% and 0.7%, and 0.3%, respectively, over the quarter.4
Eurozone
Eurostat pegged the inflation rate for the eurozone at 2.0% for the 12-month period ending in June, slightly higher than the 1.9% annual upturn in May. Costs in the services sector rose at an annual rate of 3.3% in June, edging up from the 3.2% increase in May. Prices for food, alcohol and tobacco increased 3.1% year-over-year in June versus the 3.2% annual rise for the previous month. In contrast, energy prices fell 2.7% year-over-year. Core inflation, which excludes volatile energy and food prices, increased at an annual rate of 2.3% in June, unchanged from the year-over-year increase in May.5
Eurostat also reported that eurozone GDP rose 0.6% the first quarter of 2025, representing improvement over the 0.3% growth rate for the fourth quarter of 2024. Eurozone GDP increased 1.5% over the previous 12-month period. The economies of Ireland and Iceland were the strongest performers for the first quarter, expanding 9.7% and 2.7%, respectively. In contrast, GDP in both Denmark and Luxembourg declined 0.5% during the quarter.6
SEI’s view
Global financial markets scaled a wall of worry in the second quarter of 2025—geopolitics took center stage from tariff turbulence, while equity markets rallied sharply from the post “Liberation Day” lows. Delays on implementing broad-based tariffs and progress with certain negotiations, including China, gave investors confidence to buy the early April equity dip and push the broad-market S&P 500 Index to an all-time high to close the quarter. Even the lack of progress with the Russia/Ukraine war and the escalation of the conflict between Israel and Iran, including the U.S. bombing of Iranian nuclear sites, were not enough to derail the risk rally. In contrast to equities, oil and volatility markets failed to hold gains from the price spike following news of the U.S. involvement given the subdued Iranian response, open shipping lanes in the Strait of Hormuz, and a clear desire from the Trump administration to limit further actions.
Geopolitical risk obviously remains elevated, with the latest focus on the Israel-Iran war and America’s entry into the fray. Outside of the energy complex, there has been little reaction on the part of financial markets. The jump in crude oil prices seemed rather constrained and have fallen back to pre-war levels. Even the possibility of a rogue operation by Iran’s Islamic Revolutionary Guard Corps aimed at disrupting shipping through the Strait of Hormuz would be irrational and self-defeating. Roughly 95% of Iran’s oil exports is loaded onto tankers docked at Kharg Island, near the northern end of the Persian Gulf. Iran cannot afford to disrupt its neighbors’ exports without disrupting its own. In addition, China, one of Iran’s strategic partners, receives almost half of its imported oil from the Middle East; Iran cannot afford to lose any allies. Remarkably, investors have managed to take all this uncertainty in stride.
There has been a good deal of volatility, particularly for equities, but a broad grouping of assets is in positive territory for the year to date. International stocks, as measured by the MSCI World ex USA Index, climbed 19.0% for the first six months of 2025. U.S. large-cap stocks (as represented by the Russell 1000 Index) are up 6.1% thus far in 2025, but were down by more than 15% in April on a year-to-date basis following the unveiling of so-called reciprocal tariffs. The small-cap Russell 2000 Index has been down much of the year but has come back from an even steeper loss of almost 21% and is down just 1.8% for the year-to-date.
Regarding monetary policy, more interest-rate cuts are probably ahead, but the pace of easing in Canada and the eurozone should slow since policy rates are approaching the same level as the current inflation rate. The U.S. and the U.K., on the other hand, probably have more room to cut their respective policy rates, but SEI expects both central banks to be cautious in doing so. At a time when the outlook is so uncertain, all the major central banks are probably more data-dependent than ever. Among the potentially inflationary developments all central banks need to consider: the generally expansive fiscal policies pursued by their governments, the potential for retaliatory tariff hikes that increase prices on targeted goods, and the potential impact of the Israeli-Iranian war on energy prices (now less concerning). Economies appear to be heading in a stagflationary direction, making monetary policy choices more difficult.
SEI believes that recessionary risk has risen considerably. While our base case remains that the global economy will avoid recession in 2025, we recognize a slowing in both the hard and soft data. The much-ballyhooed European stimulus will be more of a 2026-and-beyond story, and the Fed is solidly in wait-and-see mode with tariff uncertainty still unfolding, so it is less than clear if the second half of 2025 will look more like the first or second quarter.
Global diversification in equity markets remains a strategic SEI investment theme, along with our preference for active portfolio management. Despite the “Magnificent Seven” mega-cap tech stocks, which trade at an average of nearly 30 times future earnings, dominating performance during the second quarter after faltering to start the year, we continue to expect broader participation from U.S. equity sectors and capitalizations in the latter half of 2025.
Within the fixed-income markets, credit spreads remain relatively tight yet yields and income are attractive. We continue to prefer securitized credit over corporate debt given the favourable risk-adjusted yields. In our view, asset classes such as collateralized loan obligations (CLOs) look particularly attractive at this stage of the cycle.
Glossary of Financial Terms
Yield is the income returned on an investment, such as the interest received from holding a security. The yield is usually expressed as an annual percentage rate based on the investment’s cost, current market value, or face value.
Yield curve represents differences in yields across a range of maturities of bonds of the same issuer or credit rating (are (which is used to assess the risk of default of companies or countries). A steeper yield curve represents a greater difference between the yields. A flatter curve indicates that short- and long-term yields are closer together.
Index definitions
All indexes are quoted in gross performance unless otherwise indicated.
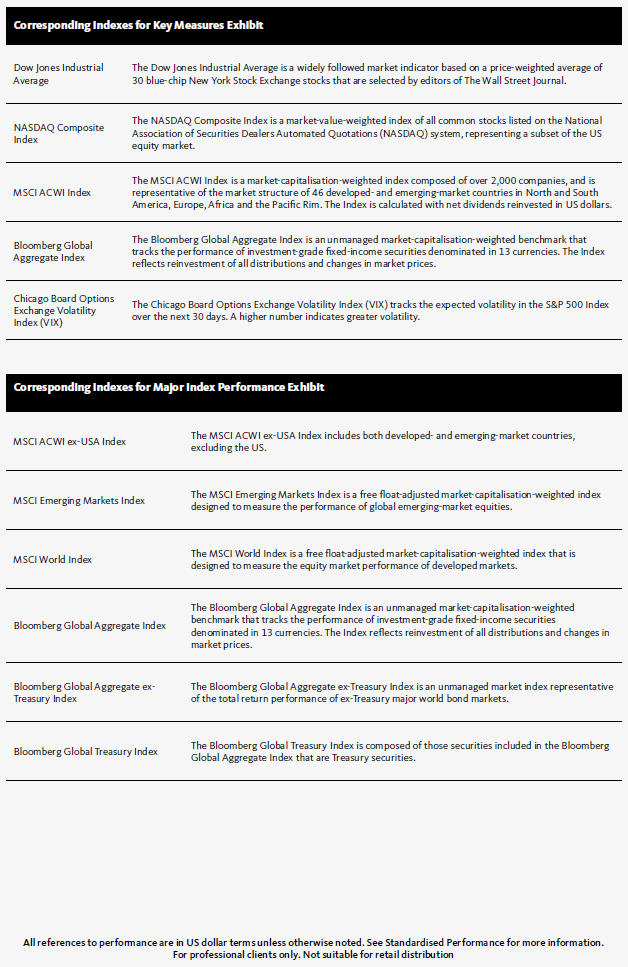
The MSCI ACWI Index is a market capitalization-weighted index that tracks the performance of over 2,000 companies, and is representative of the market structure of 48 developed and emerging-market countries in North and South America, Europe, Africa, and the Pacific Rim. The index is calculated with net dividends reinvested in U.S. dollars.
The S&P 500 Index is a market-weighted index that tracks the performance of the 500 largest publicly traded U.S. companies and is considered representative of the broad U.S. stock market.
The Nasdaq Composite Index is a market capitalization-weighted index that tracks the performance of all domestic and international companies listed on the Nasdaq Stock Market. Technology stocks comprise nearly 50% of the index’s weighting.
The Bloomberg Global Aggregate Bond Index is a market capitalization-weighted index that tracks the performance of investmentgrade (rated BBB- or higher by S&P Global Ratings/Fitch Ratings or Baa3 or higher by Moody’s Investors Service) fixed-income securities denominated in 13 currencies. The index reflects reinvestment of all distributions and changes in market prices.
The S&P US Mortgage Backed Securities Index tracks the performance of U.S. dollar-denominated, fixed-rate and adjustable-rate/ hybrid mortgage pass-through securities issued by Ginnie Mae (GNMA), Fannie Mae (FNMA) and Freddie Mac (FHLMC).
The ICE BofA U.S. Treasury Index tracks the performance of the direct sovereign debt of the U. S. government.
The ICE BofA U.S. Corporate Index includes publicly issued, fixed-rate, nonconvertible investment-grade (rated BBB- or higher by S&P Global Ratings and Fitch Ratings or Baa3 or higher by Moody’s Investors Service) dollar-denominated, U.S. Securities and Exchange (SEC)-registered corporate debt having at least one year to maturity.
The ICE BofA U.S. High Yield Constrained Index is a market value-weighted index of all domestic and Yankee high-yield bonds, including deferred interest bonds and payment-in-kind securities, with maturities of one year or more and a credit rating of BB+ or lower by S&P Global Ratings and Fitch Ratings or Ba1 or lower by Moody’s Investors Service, but are not in default.
The Bloomberg Commodity Index tracks the performance of futures contracts on physical commodities. The index comprises 24 of the most traded commodity futures contracts across six sectors.
Consumer-price indexes measure changes in the price level of a weighted-average market basket of consumer goods and services purchased by households. A consumer price index is a statistical estimate constructed using the prices of a sample of representative items whose prices are collected periodically.
The MSCI World ex USA Index tracks the performance of the large- and mid-cap segments of equity markets across 22 of 23 developed- market countries--excluding the U.S.
The Russell 1000 Index tracks the performance of 1000 of the largest U.S. equity securities based on market capitalization. The index is a subset of the Russell 3000 Index, which comprises the 3,000 largest U.S. companies, and includes approximately 1,000 of the largest securities based on a combination of their market cap and current index membership.
The Russell 2000 Index tracks the performance of the small-cap segment of the U S. equity market. The index is a subset of the Russell 3000 Index, which comprises the 3,000 largest U.S. companies, and includes approximately 2,000 of the smallest securities based on a combination of their market cap and current index membership.
Important Information
This material represents an assessment of the market environment at a specific point in time and is not intended to be a forecast of future events or a guarantee of future results. Positioning and holdings are subject to change. All information as of the date indicated.
This information should not be relied upon by the reader as research or investment advice, (unless you have otherwise separately entered into a written agreement with SEI for the provision of investment advice) nor should it be construed as a recommendation to purchase or sell a security. The reader should consult with their financial professional for more information. Statements that are not factual in nature, including opinions, projections and estimates, assume certain economic conditions and industry developments and constitute only current opinions that are subject to change without notice. Nothing herein is intended to be a forecast of future events, or a guarantee of future results.
Certain economic and market information contained herein has been obtained from published sources prepared by other parties, which in certain cases have not been updated through the date hereof. While such sources are believed to be reliable, neither SEI nor its affiliates assumes any responsibility for the accuracy or completeness of such information and such information has not been independently verified by SEI.
There are risks involved with investing, including loss of principal. The value of an investment and any income from it can go down as well as up. Investors may get back less than the original amount invested. Returns may increase or decrease as a result of currency fluctuations. Past performance is not a reliable indicator of future results. Investment may not be suitable for everyone.
This material is not directed to any persons where (by reason of that person's nationality, residence or otherwise) the publication or availability of this material is prohibited. Persons in respect of whom such prohibitions apply must not rely on this information in any respect whatsoever.
The information contained herein is for general and educational information purposes only and is not intended to constitute legal, tax, accounting, securities, research or investment advice regarding the strategies or any security in particular, nor an opinion regarding the appropriateness of any investment. This information should not be construed as a recommendation to purchase or sell a security, derivative or futures contract. You should not act or rely on the information contained herein without obtaining specific legal, tax, accounting and investment advice from an investment professional. While considerable care has been taken to ensure the information contained within this document is accurate and up-to-date, no warranty is given as to the accuracy or completeness of any information and no liability is accepted for any errors or omissions in such information or any action taken on the basis of this information.
Index returns are for illustrative purposes only, and do not represent actual account performance. Index returns do not reflect any management fees, transaction costs or expenses. Indexes are unmanaged and one cannot invest directly in an index. Not all strategies discussed may be available for your investment.
Information issued in the UK by SEI Investments (Europe) Ltd, 1st Floor, Alphabeta, 14-18 Finsbury Square, London EC2A 1BR which is authorised and regulated by the Financial Conduct Authority.
The contents of this document have not been reviewed by any regulatory authority in Hong Kong. You are advised to exercise caution in relation to the offer. If you are in any doubt about any of the contents of this document, you should obtain independent professional advice.
This information is made available in Latin America and the Middle East FOR PROFESSIONAL (non-retail) USE ONLY by SIEL.
Any questions you may have in relation to its contents should solely be directed to your Distributor. If you do not know who your Distributor is, then you cannot rely on any part of this document in any respect whatsoever.
Issued in South Africa by SEI Investment (South Africa) (Pty) Limited FSP No. 13186 which is a financial services provider authorised and regulated by the Financial Sector Conduct Authority (FSCA). Registered office: 3 Melrose Boulevard, 1st Floor, Melrose Arch 2196, Johannesburg, South Africa.
SIEL is not licensed under Israel’s Regulation of Investment Advising, Investment Marketing and Portfolio Management Law, 5755-1995 (the “Advice Law”) and does not carry insurance pursuant to the Advice Law. This document and any of the SEI Funds mentioned herein have not been approved by the Israeli Securities Authority (the “ISA”).
This material is intended for information purposes only and the information in it does not constitute financial advice as contemplated in terms of the Financial Advisory and Intermediary Services Act.
For professional clients only. Not suitable for retail distribution.


