Value Stocks: Why we Still Own Them
US value stocks (represented by the Russell 1000 Value Index) significantly outperformed US growth stocks (represented by the Russell 1000 Growth Index) from the peak of the tech bubble in March 2000 through the market top in October 2007 that preceded the global financial crisis. This edge has since eroded in what has largely been a decade-plus of outperformance by growth stocks. The combination of historically-low interest rates, muted inflation, moderate gross domestic product growth, and the explosive performance of technology companies has propelled growth companies, culminating in their rapid ascent over the past two years.
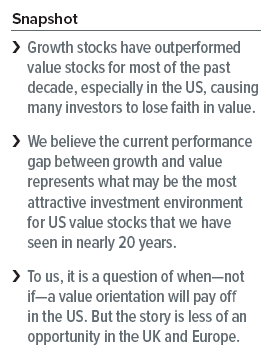
Meanwhile, US value has performed so poorly relative to US growth over the past decade that only about 5% of previous 10-year periods have been worse (defined as a two-standard-deviation event), according to our analysis. With only a few short-term wins since 2008 and staggering overall underperformance, many investors are losing faith in value.
Yet, even with its past decade of significant underperformance, the US value asset class has still outperformed its growth counterpart by an average of about 0.98% over rolling 10-year periods from December 1978 through March 2019 (Exhibit 1). This is why we maintain exposure to value stocks as part of our portfolio construction process.
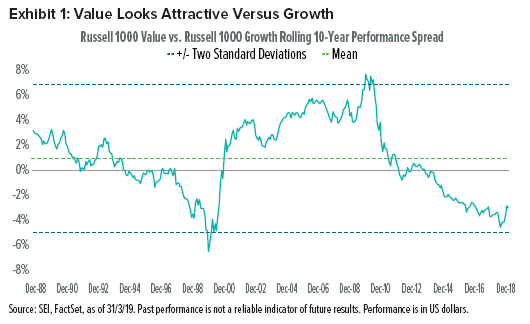
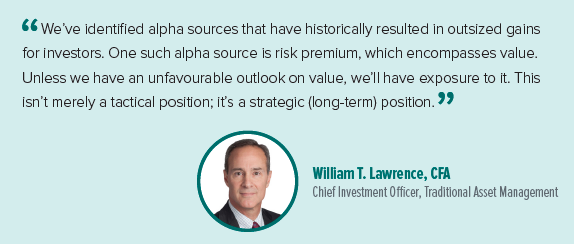
Furthermore, we believe the current performance gap between US growth and value represents what may be the most attractive investment environment for value stocks that we have seen in nearly 20 years. In our opinion, it is a question of when—not if—a value orientation will pay off.
Historically, value typically mean reverts (or outperforms) relative to growth after periods of prolonged underperformance. Accordingly, our US equity funds favour value managers—overweighting positions in value stocks in recognition of attractive earnings, cash flows, dividends and assets.
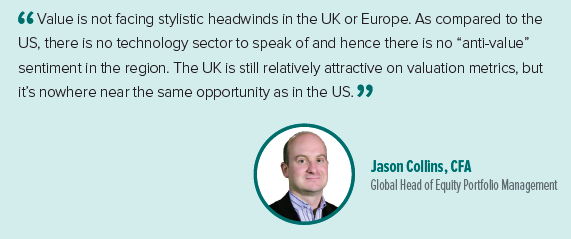
In the UK and Europe, the story is quite different. The technology sector is responsible for much of the growth outperformance in the US, but the sector is considerably smaller than in the UK and Europe. In fact, value has actually outperformed growth over the past three years in the UK and Europe.
Why do Mean Reversions Happen—and What do They Look Like?
Benjamin Graham—widely considered the father of value investing—said that “in the short run, the market is a voting machine; but in the long run, it is a weighting machine.”
He argued that short-term popularity should not be confused with long-term value; that, eventually, a company’s intrinsic value will be reflected in the price of its shares. Mean reversion is the vehicle by which that value recognition occurs.
Data from famed academic and author Ken French1 show that prolonged periods (defined as rolling five-year time horizons) in which US value underperforms have historically been followed by significant outperformance by value over the following three years. Although recent returns may imply otherwise, US value has rebounded and outperformed in more than 70% of these scenarios since 1927.
It’s not just the frequency, but also the magnitude of the gains generated by these formerly unloved stocks. In about one-third of observations, US value stocks outperformed by an average of 7% to 15% annually. In nearly 15% of instances, US value’s outperformance exceeded an annualised 15%.
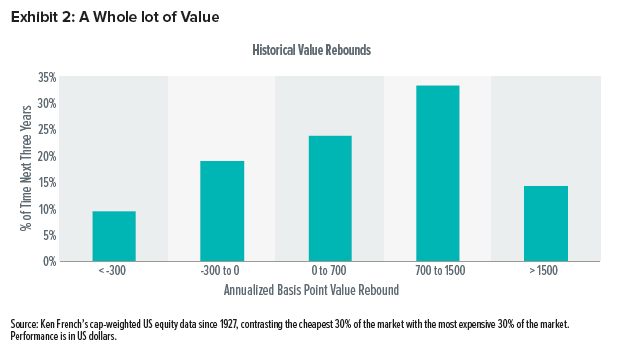
While the returns in Exhibit 2 appear quite attractive, they also came after periods of underperformance. The current environment is one of the longest and most significant periods of underperformance for US value on record.
Value’s Uncomfortable Truth
Most investors believe buying low and selling high is a strategy that will generate long-term gains. But purchasing stocks when they’re down tends to feel unnatural and uncomfortable. Holding cheap value stocks while growth-oriented technology stocks continue to soar also frustrates many investors. When it comes to value investing, however, patience really is a virtue.
Our portfolios are diversified across a number of factors, including value, momentum, stability, size and quality. Yet we’ve had a value orientation for several years. Admittedly, the value tilt (which is more pronounced in our US portfolios than in our UK and European portfolios) has detracted over the past decade. But history shows that investing in value when it’s hardest to embrace the asset class generally provides the biggest subsequent payoffs.
So When will it Happen?
Everyone wants to know when value will return to favour and which catalyst will cause the turn.
The short answer is that value trades are notoriously hard to time, and investors risk missing out on potentially impressive gains by being late to the trade.
That said, we think a number of potential catalysts could turn sentiment in favour of value, including:
- Rising U.S. interest rates (extremely low now)
- Higher commodity prices
- Increased inflation
- Faster economic growth
- Sector differentials (energy over health care has led to recent value outperformance; financials have also started beating technology)
- Technology stocks failing to meet investors’ lofty expectations
This is not an all-encompassing list of potential catalysts. It’s also possible the catalyst that ultimately causes the turn toward value has yet to even be identified.
Being early to the trade eliminates the need to guess the correct catalyst; investors must simply be patient enough to wait for the market to turn. We acknowledge this may be a challenging mental exercise, given US value’s underperformance in the past 10 years.
A Behavioural Bias
SEI is a pioneer in behavioural finance, and this field of study continues to influence our thinking today.
Consider recency bias. This describes an investor’s ability to remember items that appear at the end of a long list of complex data rather than those that appear earlier.
Evaluating conditions in the financial markets often involves reviewing long lists of complex information. Most investors do not have systems in place to automatically capture important data points going back many years or decades. Even those who do have such systems may not place sufficient weight on older data points.
There are many examples of recency bias throughout the history of financial markets. The last prominent example took place in early 2000. After four years of a raging bull market in technology, media and telecommunications stocks lifted the market to new highs, investors—professional and amateur—believed that it was “different this time;” despite having experienced past boom and bust cycles, many expected the soaring tech-bubble stocks to keep rising unabated. As we know now, this was not the case, as the tech bubble deflated in a tragic spectacle.
Looking back even further, the “nifty fifty” saw a few dozen companies drive US market gains in the 1960s and early 1970s. Yet these same companies lagged the market in the 1980s.
Every market environment is different, but parallels with the current US market are easy to spot. The FAANG stocks (Facebook, Amazon, Apple, Netflix and Google) look quite expensive. These firms, along with a handful of other high-flying tech stocks, have led the bulk of gains in the S&P 500 Index in recent years. Meanwhile, unloved value stocks have once again been left behind. It’s worth noting that value stocks went on quite a run after the tech bubble burst. It’s easy to imagine a similar environment if market leadership shifts.
Investors can fight recency bias by remembering that long-term relationships usually hold up for good reason. For example, the relationship between the cash flow that a firm can deliver and the stock price it supports should not vary by large degrees for long periods of time. Eventually, history shows it will revert toward the mean. Investors need to ask whether it’s truly different this time. We don’t believe that is the case.
A Look Into our Portfolios
FAANG stocks are concentrated in the information technology and communications sectors, so it’s not a surprise that we are underweight those sectors in most portfolios. But our portfolios are also underweight some sectors that have been dubbed value by index provider Russell.
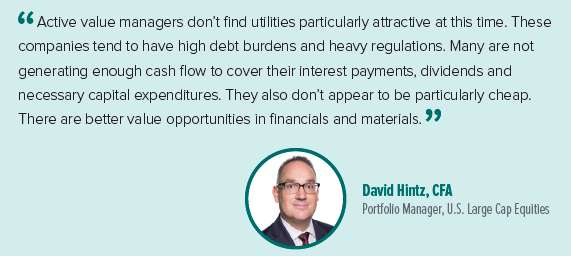
For example, utilities are most often classified as value by index providers. Yet we don’t find them particularly attractive on a valuation basis. They also lack the growth characteristics of FAANG stocks.
With regard to US value, our most prominent overweight tends to be in the financials sector. These companies often trade with attractive price-to-book ratios, and currently have low price-to-earnings ratios along with rising dividends. Bank earnings are benefiting from recent increases in short-term U.S. interest rates. Although it appears the US Federal Reserve may be finished hiking rates for the time being, the steady rate increases from late 2016 through late 2018 have resulted in the highest short-term U.S. rates in over a decade.
Our portfolio construction is not predicated on market timing. We believe that trying to perfectly time trades to capture market inflection points is a futile exercise. Instead, we assess where it makes the most sense to invest the next incremental dollar, and make our decisions accordingly.
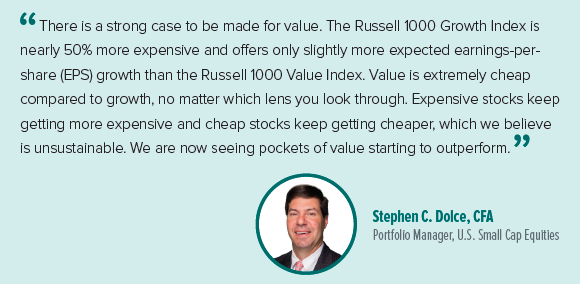
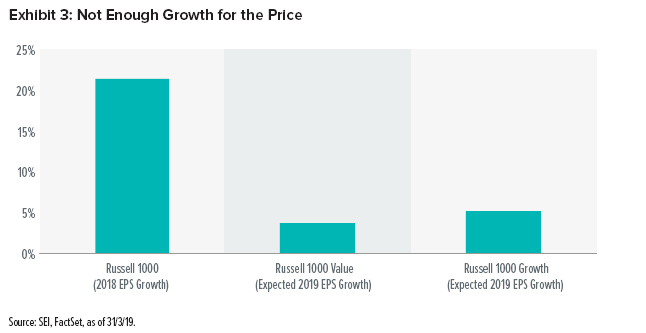
In an environment where growth is scarce (Exhibit 3), investors will often pay a premium for the asset class. We don’t believe the expected incremental growth of the Russell 1000 Growth Index over the Russell 1000 Value Index is worth a significant premium. While most of our portfolios are not explicitly dedicated to value strategies, we have a preference for value stocks as they offer distinctly attractive valuations.
Why we Keep the Faith
We know investors are losing faith in value. But value investing requires patience in order to be rewarded.
We also stand by our research indicating that value generates long-term outperformance relative to broad equity markets. Almost by definition, value companies tend to be smaller from a capitalisation perspective as their stock prices are trading at a discount (in terms of their fundamental valuations relative to broad equity markets). Investing in smaller companies is also a hallmark of active management, and our managers certainly exhibit smaller-sized holdings than their benchmarks.
After assessing the current market environment, we remain firm in our belief—based on our research and empirical evidence—that, historically, value offers attractive long-term outcomes. We intend to maintain our stance until a shift in sentiment lifts value—which, in our opinion, is inevitable.
Definitions
Price-to-Book Ratio: A stock’s capitalization divided by its book value, where book value is the value of an asset as it appears on a balance sheet, equal to cost minus accumulated depreciation. The value is the same whether the calculation is done for the whole company or on a per-share basis.
Price-to-Earnings Ratio: Equal to market capitalization divided by after-tax earnings. The higher the price-to-earnings ratio, the more the market is willing to pay for each dollar of annual earnings.
Standard Deviation: Statistical measure of historical volatility. A statistical measure of the distance a quantity is likely to lie from its average value. It is applied to the annual rate of return of an investment, to measure the investment’s volatility (risk). Standard deviation is synonymous with volatility, in that the greater the standard deviation the more volatile an investment’s return will be. A standard deviation of zero would mean an investment has a return rate that never varies.
Index Definitions
The Russell 1000 Index includes 1,000 of the largest U.S. equity securities based on market cap and current index membership; it is used to measure the activity of the U.S. large-cap equity market.
The Russell 1000 Growth Index measures the performance of the large-cap growth segment of the U.S. equity universe. It includes those Russell 1000 Index companies with higher price-to-book ratios and higher forecasted growth values.
The Russell 1000 Value Index measures the performance of the large-cap value segment of the U.S. equity universe. It includes those Russell 1000 Index companies with lower price-to-book ratios and lower expected growth values.
Important Information
Past performance is not a reliable indicator of future results. Investments in SEI Funds are generally medium- to long-term investments. The value of an investment and any income from it can go down as well as up. Investors may get back less than the original amount invested. Returns may increase or decrease as a result of currency fluctuations. Additionally, this investment may not be suitable for everyone. If you should have any doubt whether it is suitable for you, you should obtain expert advice.
No offer of any security is made hereby. Recipients of this information who intend to apply for shares in any SEI Fund are reminded that any such application may be made solely on the basis of the information contained in the Prospectus. This material represents an assessment of the market environment at a specific point in time and is not intended to be a forecast of future events, or a guarantee of future results. This information should not be relied upon by the reader as research or investment advice regarding the funds or any stock in particular, nor should it be construed as a recommendation to purchase or sell a security, including futures contracts.
In addition to the normal risks associated with equity investing, international investments may involve risk of capital loss from unfavourable fluctuation in currency values, from differences in generally accepted accounting principles or from economic or political instability in other nations. Bonds and bond funds are subject to interest rate risk and will decline in value as interest rates rise. High yield bonds involve greater risks of default or downgrade and are more volatile than investment grade securities, due to the speculative nature of their investments. Narrowly focused investments and smaller companies typically exhibit higher volatility. SEI Funds may use derivative instruments such as futures, forwards, options, swaps, contracts for differences, credit derivatives, caps, floors and currency forward contracts. These instruments may be used for hedging purposes and/or investment purposes.
While considerable care has been taken to ensure the information contained within this document is accurate and up-to-date, no warranty is given as to the accuracy or completeness of any information and no liability is accepted for any errors or omissions in such information or any action taken on the basis of this information.
The views and opinions shown in this commentary are of SEI only and are subject to change. They should not be construed as investment advice.
This information is issued by SEI Investments (Europe) Limited, 1st Floor, Alphabeta, 14-18 Finsbury Square, London EC2A 1BR which is authorised and regulated by the Financial Conduct Authority. Please refer to our latest Full Prospectus (which includes information in relation to the use of derivatives and the risks associated with the use of derivative instruments), Key Investor Information Documents and latest Annual or Semi-Annual Reports for more information on our funds. This information can be obtained by contacting your Financial Adviser or using the contact details shown above.
SEI sources data directly from FactSet, Lipper, and BlackRock, unless otherwise stated.


