The U.S. Yield Curve Inverts, Will a Recession and Equity Bear Market Follow?
On March 22, 2019, the 3-month U.S. Treasury bill paid a higher interest rate than the ten-year U.S. Treasury note. The last time this happened was in 2007. When short-term yields are higher than long-term yields, the yield curve is said to be inverted.
The inversion is getting a great deal of attention, and for good reason: yield-curve inversions often precede recessions. While we understand concerns about recession, we think the doom and gloom outlook is too pessimistic. The economy remains strong. And a recession doesn’t necessarily result in a bear market for stocks.
Inverted Yields Slow Economic Growth…
A yield-curve inversion is one of the more accurate leading indicators of an impending recession. The only time an inversion did not lead to a recession was in 1966. However, economic growth did see a dramatic slowdown at that time.
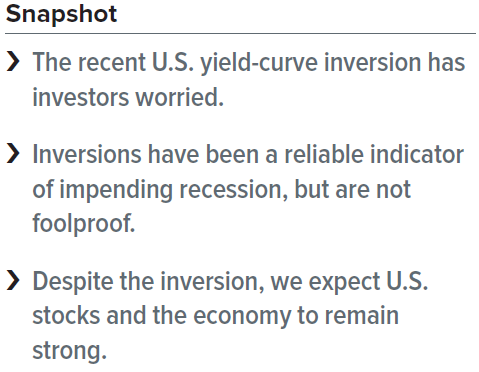
Exhibit 1 shows that the spread between 3-month and ten-year Treasurys (which started from a very wide point in 2009) has been narrowing during most of the last decade’s expansion. History shows that by the time the yield curve either narrows to 0.25% or inverts, a recession could begin within the next 12 to 18 months.
…But Don’t Always Bring Out the Equity Bears
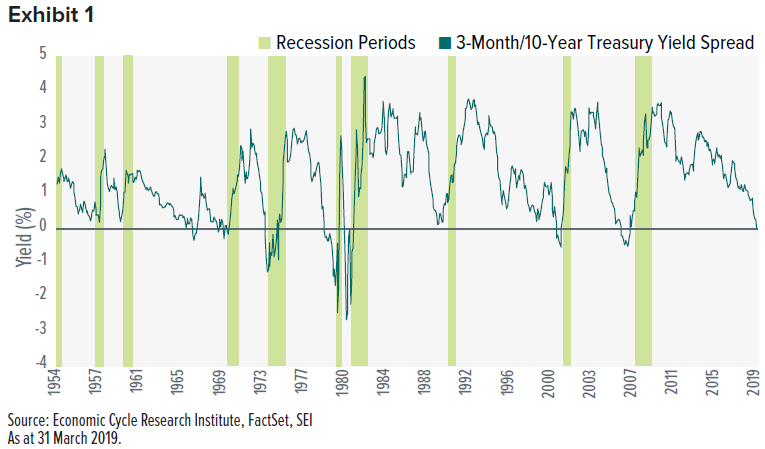
The stock market is also a leading indicator. A bear market in stocks usually starts before an economic downturn, while the next bull market begins before the recession ends. What is the relationship of a yield-curve inversion to stock-market performance? Exhibit 2 shows the price-only performance of the S&P 500 Index over two years after an inversion. We included a near-inversion in June 1989 because of the recession in August 1990. This recession happened when oil prices spiked after Iraq invaded Kuwait, kicking off the Gulf War.
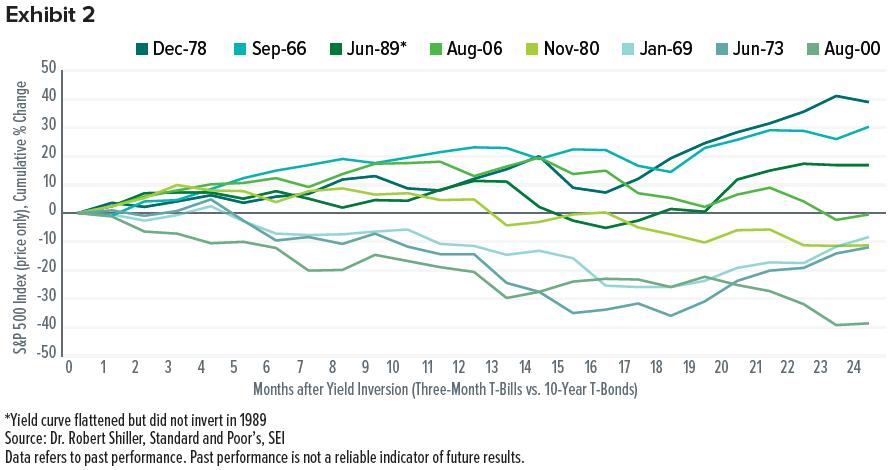
Exhibit 2 shows there is no hard-and-fast rule about how stocks react when the yield curve inverts. Stocks slumped right after an inversion in only three instances: 1969, 1973 and 2000. After all other inversions, the S&P 500 Index gained between 4.5% and 19.5% over the following 12 months.
In the 12 months following an inversion, stock prices have tended to fall as a recession takes hold. But that’s not always the case and the declines are not always long lasting. Two out of the five bear markets shown had already hit bottom and were recovering within two years of the inversion.
No Two Inversions are the Same
Every instance of inversion is unique. Deeper recessions usually cause sharper shareprice declines (as was the case in 1973). Expensive stock markets (like the 1998-2000 technology bubble) are more vulnerable. Market booms can lead to market busts. There can be a very big gap between an initial inversion and the emergence of a bear market. For example, a significant bear market did not happen within two years of August 2006’s inversion. Yet we all remember how bad things got in September 2008 with the collapse of Lehman Brothers.
Our View
In our view, the U.S. economy still looks solid, especially against other developed economies. Most economists predict that U.S. economic growth will be slower in 2019 versus 2018. Expectations of a sharp slowdown (2.1% projected growth in the latest Federal Reserve forecast) seem overly pessimistic to us.
Why are we so optimistic? Because we see that the signs of stress that built up in the fourth quarter 2018 have dissipated. The St. Louis Financial Stress Index has backtracked toward the middle of its range of the past five years (Exhibit 3). Even in the fourth quarter 2018, financial stress was still lower than it has been for most of the past 25 years.
The average value of the stress index is designed to be zero. It’s hard for us to get worried about recession until the reading moves at least above the zero line.
We expect U.S. equities to remain in demand. Yes, international stocks are long overdue for a period of improved relative performance versus the U.S. But this doesn’t mean a bear market will happen in the U.S. anytime soon.
Definitions
S&P 500 Index: The S&P 500 Index is a market-capitalization weighted index that consists of 500 publicly traded large U.S. companies that are considered representative of the broad U.S. stock market.
St. Louis Financial Stress Index: The St. Louis Financial Stress Index measures the degree of financial stress in the markets and is constructed from 18 weekly data series: seven interest rate series, six yield spreads and five other indicators. Each of these variables captures some aspect of financial stress. Accordingly, as the level of financial stress in the economy changes, the data series are likely to move together. The average value of the index, which begins in late 1993, is designed to be zero. Thus, zero is viewed as representing normal financial market conditions. Values below zero suggest below-average financial market stress, while values above zero suggest above-average financial market stress.
Important Information
Data refers to past performance. Past performance is not a reliable indicator of future results. Investments in SEI Funds are generally medium- to long-term investments. The value of an investment and any income from it can go down as well as up. Investors may get back less than the original amount invested. Returns may increase or decrease as a result of currency fluctuations. Additionally, this investment may not be suitable for everyone. If you should have any doubt whether it is suitable for you, you should obtain expert advice.
No offer of any security is made hereby. Recipients of this information who intend to apply for shares in any SEI Fund are reminded that any such application may be made solely on the basis of the information contained in the Prospectus. This material represents an assessment of the market environment at a specific point in time and is not intended to be a forecast of future events, or a guarantee of future results. This information should not be relied upon by the reader as research or investment advice regarding the funds or any stock in particular, nor should it be construed as a recommendation to purchase or sell a security, including futures contracts.
In addition to the normal risks associated with equity investing, international investments may involve risk of capital loss from unfavourable fluctuation in currency values, from differences in generally accepted accounting principles or from economic or political instability in other nations. Bonds and bond funds are subject to interest rate risk and will decline in value as interest rates rise. High yield bonds involve greater risks of default or downgrade and are more volatile than investment grade securities, due to the speculative nature of their investments. Narrowly focused investments and smaller companies typically exhibit higher volatility. SEI Funds may use derivative instruments such as futures, forwards, options, swaps, contracts for differences, credit derivatives, caps, floors and currency forward contracts. These instruments may be used for hedging purposes and/or investment purposes.
While considerable care has been taken to ensure the information contained within this document is accurate and up-to-date, no warranty is given as to the accuracy or completeness of any information and no liability is accepted for any errors or omissions in such information or any action taken on the basis of this information.
This information is issued by SEI Investments (Europe) Limited, 1st Floor, Alphabeta, 14-18 Finsbury Square, London EC2A 1BR which is authorised and regulated by the Financial Conduct Authority in the United Kingdom. Please refer to our latest Full Prospectus (which includes information in relation to the use of derivatives and the risks associated with the use of derivative instruments), Key Investor Information Documents and latest Annual or Semi-Annual Reports for more information on our funds. This information can be obtained by contacting your Financial Adviser or using the contact details shown above.
SEI sources data directly from FactSet, Lipper, and BlackRock, unless otherwise stated.
Information provided by SEI Investments Management Corporation, a wholly owned subsidiary of SEI Investments Company (SEI). Neither SEI nor its subsidiaries is affiliated with your financial advisor.


