Quarterly market commentary: Stocks rise on easing Mideast tensions and an AI rally.
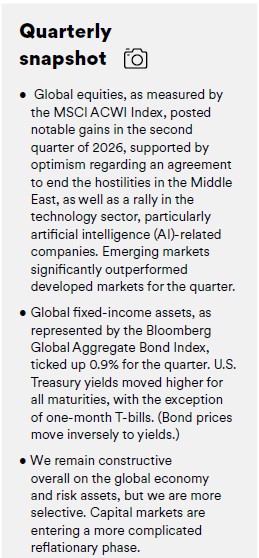
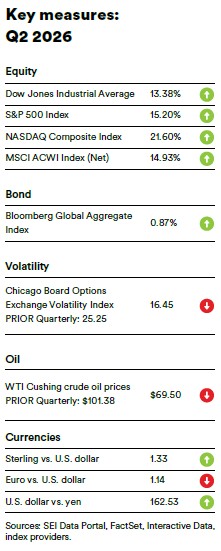
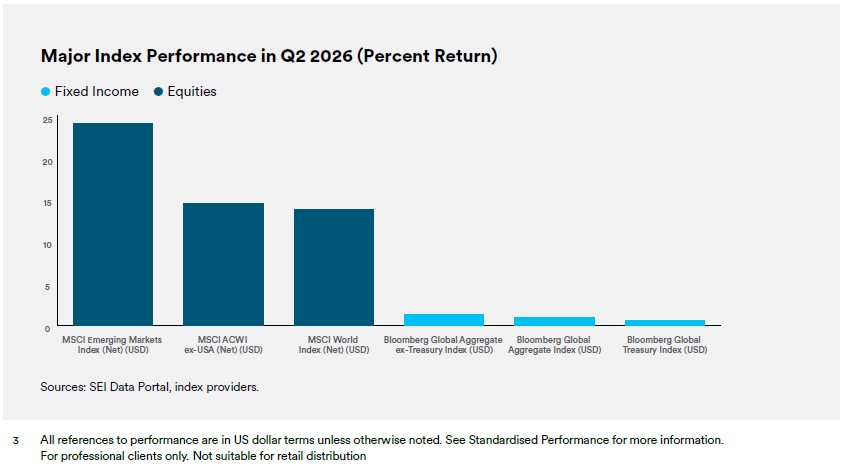
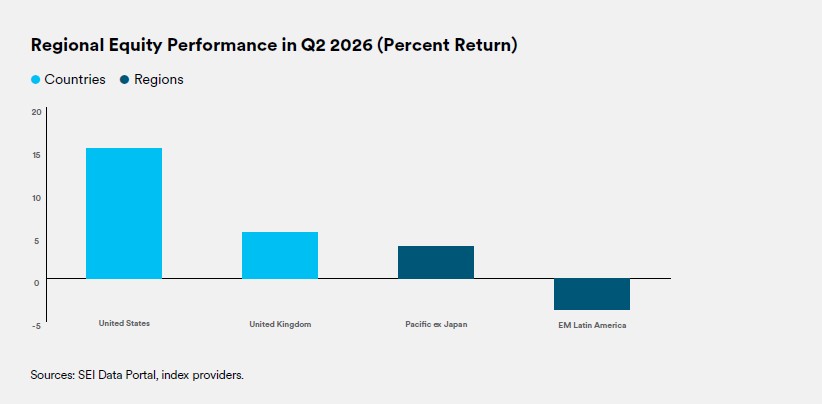
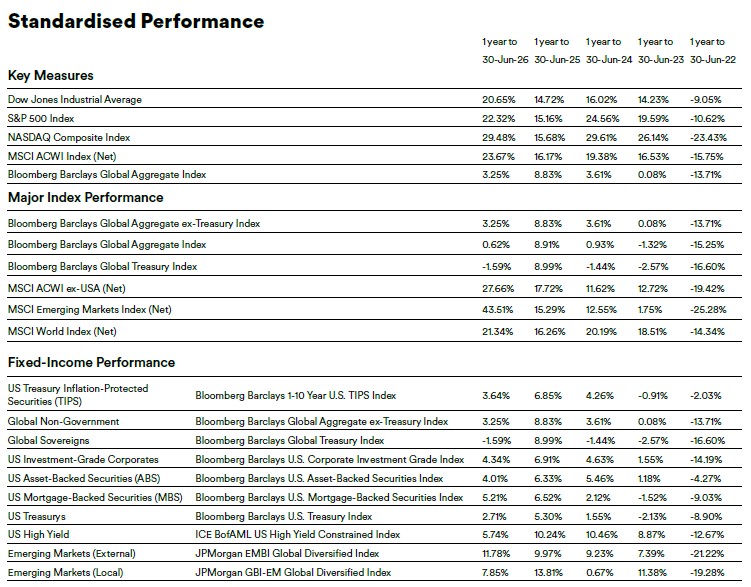
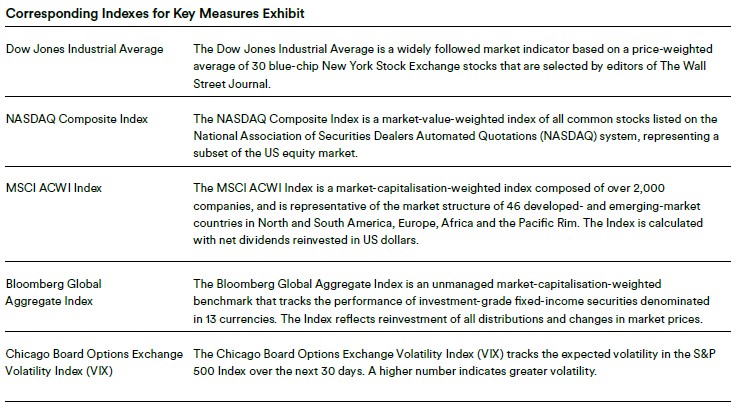
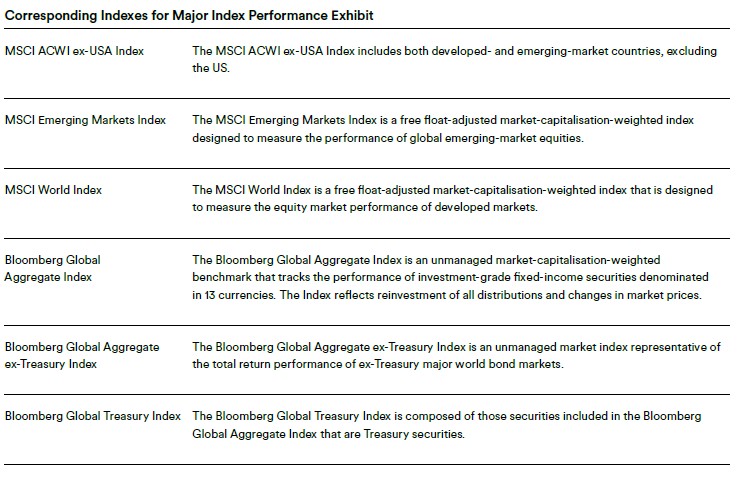
Global equities, as measured by the MSCI ACWI Index, posted notable gains in the second quarter of 2026, supported by optimism regarding an agreement to end the hostilities in the Middle East, as well as a rally in the technology sector, particularly artificial intelligence (AI)-related companies. Emerging markets significantly outperformed developed markets for the quarter.
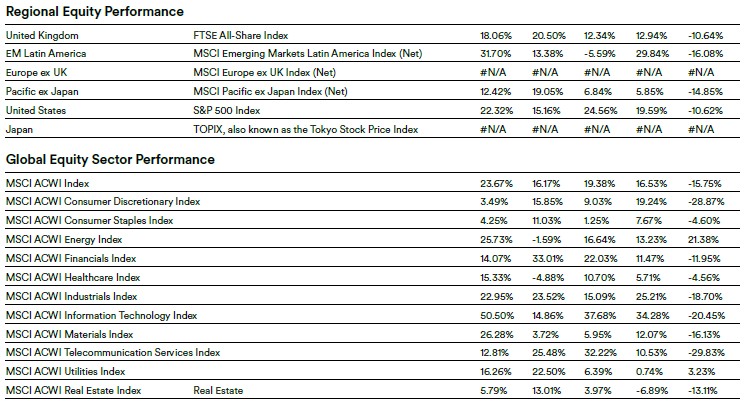
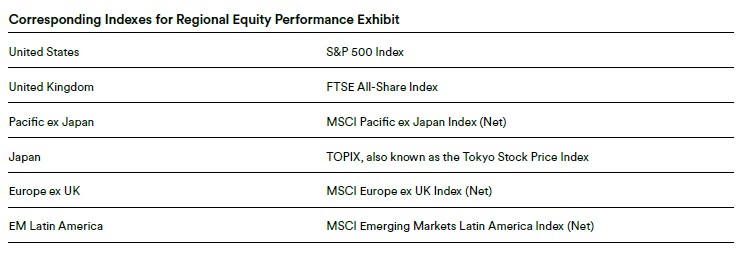
The Far East and Asia were the top performers among emerging markets over the quarter, as both regions benefited from significant market rallies in Korea and Taiwan. Conversely, Chinese stocks listed on the Hong Kong Stock Exchange were the most notable market laggards, while Latin America also lost ground due to a downturn in Brazil. The Gulf Cooperation Council (GCC) countries finished the quarter in modestly positive territory, but underperformed due to weakness in Saudi Arabia. North America was the top-performing developed market in the second quarter due to strength in the U.S. The Euro region benefited from market upturns in the Netherlands and Austria, while both the Far East and Pacific regions were bolstered by strength in Japan and Singapore. The Pacific ex Japan market posted a gain for the quarter, but was the primary market laggard due to a decline in Hong Kong.
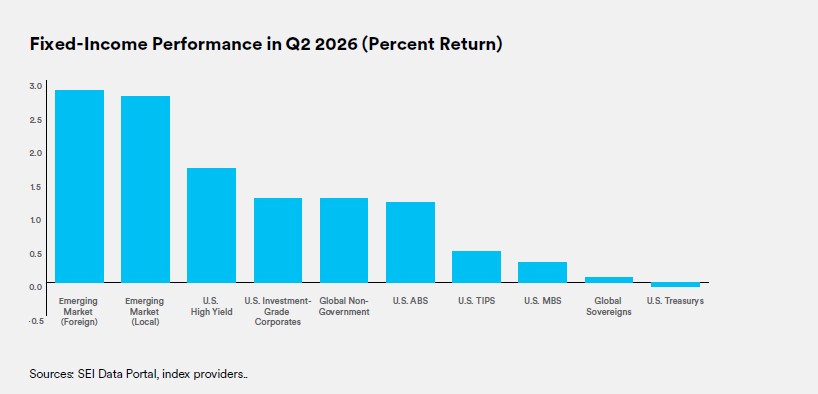
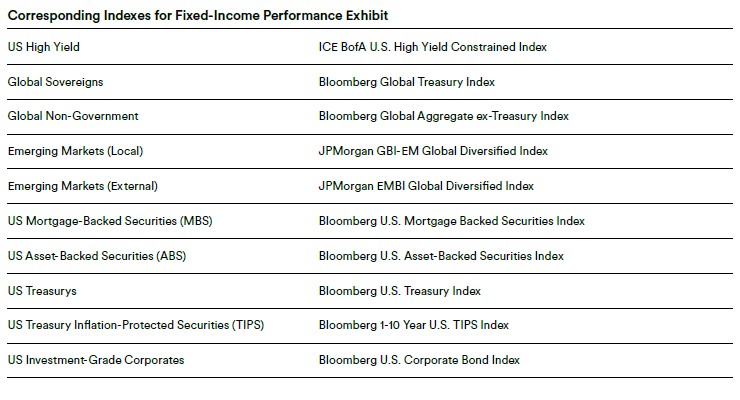
Global fixed-income assets, as measured by the Bloomberg Global Aggregate Bond Index, ticked up 0.9% (in U.S. dollars) for the quarter. High-yield bonds led the U.S. fixed-income market, followed by investment-grade corporate bonds, U.S. mortgage-backed securities (MBS), and U.S. Treasury securities. Treasury yields moved higher for all maturities, with the exception of one-month T-bills. (Bond prices move inversely to yields.) Yields on 2-, 3-, 5-, and 10-year Treasury notes rose 0.35%, 0.34%, 0.27%, and 0.14%, ending the quarter at 4.14%, 4.15%, 4.19%, and 4.44%, respectively. The 10-year to 3-month yield curve narrowed by 6 basis points (0.06%) to +0.57% as of the end of the quarter.
Global commodity prices, as represented by the Bloomberg Commodity Index, declined 8.1% in the second quarter. Oil prices fell sharply on hopes for a resolution of the blockade of the Strait of Hormuz, a major shipping channel between the Persian Gulf and the Gulf of Oman in the Middle East, with West Texas Intermediate (WTI) and Brent crude tumbling 31.4% and 29.8%, respectively, during the quarter. The gold price fell 13.7% for the quarter amid rising U.S. Treasury yields and a strengthening U.S. dollar. (The gold price tends to move inversely to the dollar.) Despite a pullback in June following a sharp rally in May, the New York Mercantile Exchange (NYMEX) natural gas price still ended the quarter with a 13.6% gain as warmer weather forecasts bolstered expectations for stronger summer cooling demand. The wheat price decreased 4.4% during the quarter amid anticipation that improving weather in the U.S. could lead to increases in crop yields and overall supply.
The U.S.-Israel-Iran war dominated the geopolitical news throughout the quarter. The ceasefire appeared to be in jeopardy numerous times during the period, with both the U.S. and Iran accusing the other of violating the truce. Iran launched missile and drone attacks on U.S. warships and other targets in the Gulf region in May, triggering U.S. strikes on Iranian military sites. The United Arab Emirates intercepted several Iranian missiles and drones as Iran sought to retaliate against neighboring countries allying with the U.S. and Israel. Nonetheless, U.S. officials signaled that a peace deal was possible even amid continued military strikes launched by both sides.
Toward the end of the quarter, the U.S. and Iran signed a memorandum of understanding (MOU), which moved the Mideast conflict from active escalation to conditional diplomacy. President Donald Trump signed the preliminary agreement on June 17, setting a 60-day negotiating window intended to end hostilities, reopen the Strait of Hormuz, and address Iran’s nuclear program. The framework provides immediate oil-sanctions relief for Iran and calls for the U.S. to ease its naval blockade, while Tehran agreed to restore commercial shipping through the strait. However, U.S. officials stressed that the MOU is not a final deal, and Trump indicated that military action could resume if Iran fails to comply. On June 25, the Gulf Cooperation Council (GCC) welcomed the agreement and backed U.S. objectives to prevent Iran from acquiring a nuclear weapon, address Iran’s ballistic missiles, and preserve free and unrestricted navigation through the Strait of Hormuz. However, Iranian authorities reportedly warned vessels transiting the strait without identification signals or Iranian permission, leading at least three oil tankers and two other ships to reverse course. The episode highlighted the gap between the diplomatic framework and conditions on the water. The MOU has reduced near-term escalation risk, but freedom of navigation through the Strait remains contested.
Trump and President Xi Jinping of China met in Beijing in mid-May to discuss, among other topics, Xi’s intentions regarding possible military action against Taiwan to force reunification with China, and the war in the Middle East. Xi cautioned Trump that mismanagement of the Taiwan situation could result in an “extremely dangerous situation.” Trump and Xi found some common ground regarding the Mideast conflict, agreeing that the Strait of Hormuz should be reopened and that Iran should not be allowed to produce a nuclear weapon.
Elsewhere, on 22 June, Keir Starmer announced his resignation as both U.K. prime minister and Labour Party leader. It appeared that significant Labour Party losses in local elections had eroded his authority and triggered calls for him to step down. Starmer acknowledged internal political pressure and accepted that he was no longer best placed to lead, but said that he would remain in office until the Labour Party chooses a successor to ensure an orderly transition.
Economic data
U.S.
The Department of Labor reported that the consumer-price index (CPI) increased 0.5% in May, edging down from the 0.6% rise in April and meeting expectations. Rising energy prices have continued to fuel inflation, with prices for fuel oil and gasoline posting corresponding gains of 7.0% and 6.7% for the month. The CPI advanced 4.2% year-over-year in May, up from the 3.8% increase in April and in line with expectations. and in line with expectations. Costs for apparel and transportation services rose 4.8% and 4.1%, respectively, over the previous 12-month period. Conversely, prices for used cars and trucks and medical care commodities declined by corresponding margins of 2.0% and 1.8% year-over-year.
According to the third estimate from the Department of Commerce, U.S. gross domestic product (GDP) grew at an annual rate of 2.1% for the first quarter of 2026, exceeding expectations and up from the previous estimate of 1.6% and the 0.5% rise in the fourth quarter of 2025. The increase in GDP for the first quarter was attributable to growth in investment, exports, government spending, and consumer spending, while the upward revision from the second estimate primarily reflected a downward revision to imports, which are a subtraction in the calculation of GDP.
U.K.
According to the Office for National Statistics (ONS), inflation in the U.K., as measured by the CPI, edged up 0.2% in May, down sharply from the 0.7% increase in April. Costs for furniture and household goods, and restaurants and hotels rose 0.8% and 0.6%, respectively, for the month. Conversely, alcohol and tobacco prices declined 0.3%, while costs for food and alcoholic beverages, and housing and household services dipped 0.1%. The CPI advanced at an annual rate of 2.8% in May, marching the increase in April. Transportation, education, and restaurants and hotels posted the largest price gains for the period.
The ONS also announced that U.K. GDP edged down 0.1% in April (the most recent reporting period), declining from the 0.3% growth rate in March. Output in the services sector dipped 0.2% in April, while construction sector ticked up 0.1% and production was flat. GDP increased 0.6% for the three-month period ending April 30, 2026, up marginally from the 0.5% growth rate for the first three months of the year. Output in the construction and services sectors increased 1.6% and 0.8%, respectively, for the three-month period. In contrast, production output edged down 0.1% for the period.
Eurozone
Eurostat pegged inflation for the eurozone at 2.8% for the 12-month period ending in June, down from the 3.2% annual increase in May. Energy prices surged 10.9% year-over-year in June due to the ongoing blockade in the Strait of Hormuz, affecting a significant amount of global oil capacity, and costs for unprocessed food rose 4.2% compared to the same period in 2025.
According to Eurostat’s second estimate, eurozone GDP edged down 0.2% in the first quarter of 2026—falling from the 0.2% increase for the fourth quarter of last year. The economic contraction for the first quarter was attributable largely to a 12.1% GDP decline in Ireland, while GDP for Lithuania and Sweden dipped 0.3% and 0.2%, respectively. The economies of Iceland, Denmark, Estonia, and Malta were the strongest performers for the first quarter, expanding by corresponding margins of 3.7%, 1.9%, 1.1%, and 1.1%.
SEI’s view
We remain constructive overall on the global economy and risk assets, but we are more selective. Capital markets are entering a more complicated reflationary phase. The market cycle is becoming more inflation-sensitive, more rate-volatility-sensitive, and more dependent on physical bottlenecks than on pure financial liquidity. The correct framing is not recession versus expansion; it is whether growth remains strong enough to support earnings without forcing real yields, term premia, and the U.S. dollar high enough to compress valuations.
U.S. economic growth remains resilient, but that is a double-edged sword. Manufacturing activity, labor-market momentum, macro surprise indicators, and earnings revisions do not point to an imminent recession. However, stronger growth also reduce the case for Federal Reserve (Fed) monetary policy easing and keeps the discount-rate risk alive for long-duration assets.
Inflation risk is now driven by supply-side constraints and strong demand. Oil, tariffs, electricity demand, AI infrastructure, semiconductor constraints, and persistent cost increases for services can keep inflation sticky on their own. Meanwhile, reaccelerating growth without realised productivity gains would add demand-pull pressure. Private demand running above potential real growth makes a clean return to 2% inflation difficult without either productivity gains or tighter policy. Longer-term inflation expectations remain reasonably anchored, which argues against an aggressive hiking cycle. But resilient growth, renewed inflation pressure, market pricing, and the nominal-demand backdrop are consistent with one hike followed by a pause, moving policy from modestly accommodative to closer to neutral.
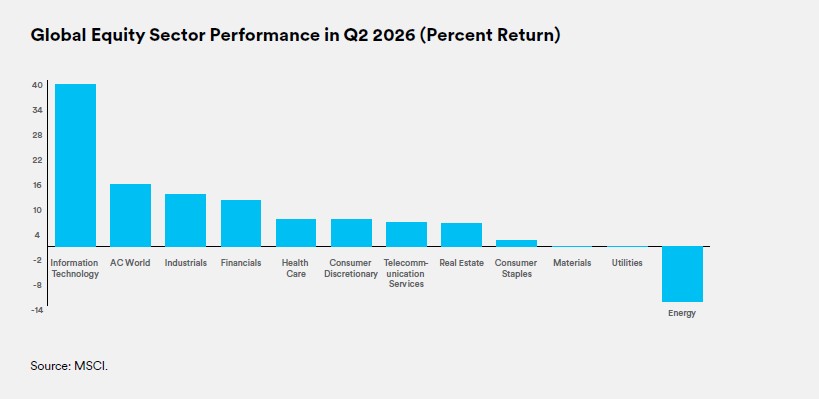
Equity earnings are still a source of support. Forward earnings growth and revisions remain positive, and earnings breadth is healthier than return concentration suggests, particularly in the U.S., Japan, and across the global manufacturing and AI supply-chain cycle. Valuation discipline matters more now. The U.S. and parts of Asia look expensive, while Europe, the U.K., and selected value-oriented segments appear more reasonably priced. Markets can continue to work, but the margin of safety is thinner. Investment opportunities are broadening beyond mega-cap growth stocks. AI remains an important theme; however, the next phase increasingly depends on chips, power, grids, cooling, data centers, energy, materials, and industrial capacity. The beneficiaries may shift from software narratives toward infrastructure and old-economy enablers. Active management remains a key call this year with positive exposures to global value, quality, and momentum factors, with value as the primary emphasis. We favour earnings-supported equities over non-earners, while avoiding excessive reliance on long-duration (rate-sensitive) growth. Emerging-market equities remain interesting given valuations and leverage to economic growth.
Within the fixed-income universe, bonds are less reliable as a hedge. Elevated stock-bond correlations, higher inflation volatility, and rising term premia mean Treasurys are likely to trade more like risk assets than they have in recent cycles. We believe inflation-linked exposure is more attractive than nominal bonds as breakeven rates are still underpricing persistent inflation pressure.
GLOSSARY AND INDEX DEFINITIONS
For financial term and index definitions, please see: seic.com/ent/imu-communications-financial-glossary
IMPORTANT INFORMATION
This material represents an assessment of the market environment at a specific point in time and is not intended to be a forecast of future events or a guarantee of future results. Positioning and holdings are subject to change. All information as of the date indicated.
This information should not be relied upon by the reader as research or investment advice, (unless you have otherwise separately entered into a written agreement with SEI for the provision of investment advice) nor should it be construed as a recommendation to purchase or sell a security. The reader should consult with their financial professional for more information. Statements that are not factual in nature, including opinions, projections and estimates, assume certain economic conditions and industry developments and constitute only current opinions that are subject to change without notice. Nothing herein is intended to be a forecast of future events, or a guarantee of future results.
Certain economic and market information contained herein has been obtained from published sources prepared by other parties, which in certain cases have not been updated through the date hereof. While such sources are believed to be reliable, neither SEI nor its affiliates assumes any responsibility for the accuracy or completeness of such information and such information has not been independently verified by SEI.
There are risks involved with investing, including loss of principal. The value of an investment and any income from it can go down as well as up. Investors may get back less than the original amount invested. Returns may increase or decrease as a result of currency fluctuations. Past performance is not a reliable indicator of future results. Investment may not be suitable for everyone.
This material is not directed to any persons where (by reason of that person's nationality, residence or otherwise) the publication or availability of this material is prohibited. Persons in respect of whom such prohibitions apply must not rely on this information in any respect whatsoever.
The information contained herein is for general and educational information purposes only and is not intended to constitute legal, tax, accounting, securities, research or investment advice regarding the strategies or any security in particular, nor an opinion regarding the appropriateness of any investment. This information should not be construed as a recommendation to purchase or sell a security, derivative or futures contract. You should not act or rely on the information contained herein without obtaining specific legal, tax, accounting and investment advice from an investment professional. While considerable care has been taken to ensure the information contained within this document is accurate and up-to-date, no warranty is given as to the accuracy or completeness of any information and no liability is accepted for any errors or omissions in such information or any action taken on the basis of this information.
Index returns are for illustrative purposes only, and do not represent actual account performance. Index returns do not reflect any management fees, transaction costs or expenses. Indexes are unmanaged and one cannot invest directly in an index. Not all strategies discussed may be available for your investment.
Information issued in the UK by SEI Investments (Europe) Ltd, 1st Floor, Alphabeta, 14-18 Finsbury Square, London EC2A 1BR which is authorised and regulated by the Financial Conduct Authority. The contents of this document have not been reviewed by any regulatory authority in Hong Kong. You are advised to exercise caution in relation to the offer. If you are in any doubt about any of the contents of this document, you should obtain independent professional advice.
This information is made available in Latin America and the Middle East FOR PROFESSIONAL (non-retail) USE ONLY by SIEL.
Any questions you may have in relation to its contents should solely be directed to your Distributor. If you do not know who your Distributor is, then you cannot rely on any part of this document in any respect whatsoever.
Issued in South Africa by SEI Investment (South Africa) (Pty) Limited FSP No. 13186 which is a financial services provider authorised and regulated by the Financial Sector Conduct Authority (FSCA). Registered office: 3 Melrose Boulevard, 1st Floor, Melrose Arch 2196, Johannesburg, South Africa.
SIEL is not licensed under Israel’s Regulation of Investment Advising, Investment Marketing and Portfolio Management Law, 5755-1995 (the “Advice Law”) and does not carry insurance pursuant to the Advice Law. This document and any of the SEI Funds mentioned herein have not been approved by the Israeli Securities Authority (the “ISA”).
This material is intended for information purposes only and the information in it does not constitute financial advice as contemplated in terms of the Financial Advisory and Intermediary Services Act. For professional clients only. Not suitable for retail distribution.