U.S. Value Stocks: We Still Love Them
Value stocks, represented by the Russell 1000 Value Index, significantly outperformed growth stocks, represented by the Russell 1000 Growth Index, from the top of the tech bubble (March 2000) through the market top that preceded the global financial crisis (October 2007). Since the beginning of the global financial crisis, growth stocks have outperformed on a cumulative basis and their price ratios have expanded substantially. Historically low interest rates, muted inflation, moderate gross domestic product growth and the explosive performance of technology companies have propelled growth companies, culminating in their rapid ascent until late 2020.
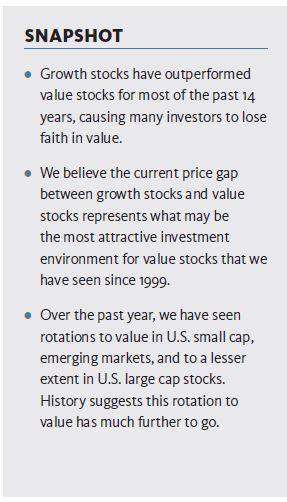
Value, on the other hand, has performed so poorly over the past decade-plus that the 10-year period ending August 31, 2020 was the worst on record, according to our analysis. With only a few short-term wins since 2008 and staggering overall underperformance, many investors are losing faith in value.
Yet, even with the past decade of significant underperformance, value still has outperformed growth by an average of about 0.49 percent over rolling 10-year periods from December 1978 through October 31, 2021 (Exhibit 1). The significant spread differential and substantial mean reversion potential are some reasons why we maintain a tactical exposure (in addition to a strategic position) to value stocks as part of our portfolio construction process.
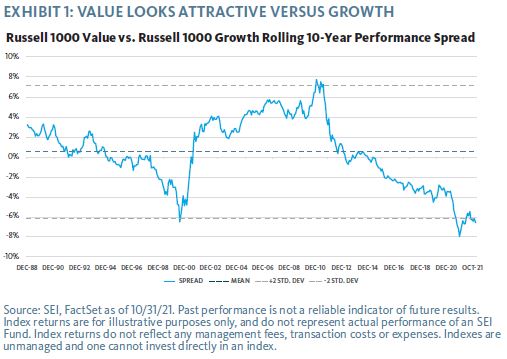
Even after some months of strong performance from value over the past year, we believe the current performance gap between growth and value continues to represent what may be the most attractive investment environment for value stocks that we have seen in over 20 years. In our opinion, it is a question of how consistently—not if—a value orientation will pay off.
Historically, value typically mean reverts (or outperforms) relative to growth after periods of prolonged underperformance or if there is a value catalyst. Accordingly, our domestic equity funds favor value managers—overweighting positions in value stocks in recognition of attractive earnings, cash flows, dividends and assets.
Why Do Mean Reversions Happen—and What Do They Look Like?
Benjamin Graham—widely considered the father of value investing—said that “in the short run, the market is a voting machine; but in the long run, it is a weighting machine.”
He argued that short-term popularity should not be confused with long-term value; that, eventually, a company’s intrinsic value will be reflected in the price of its shares. Mean reversion is the vehicle by which that value recognition occurs.
Data from famed academic and author Ken French1 show that prolonged periods (defined as rolling five-year time horizons) in which value underperforms have historically been followed by significant outperformance by value over the following three years. Although recent returns may imply otherwise, value has rebounded and outperformed in about 70 percent of these scenarios since 1927.
It’s not just the frequency, but also the magnitude of the gains generated by these formerly unloved stocks. In 30 percent of observations, value stocks outperformed by an average of 7 percent to 15 percent annually. In 13 percent of instances, value’s outperformance exceeded an annualized 15 percent.
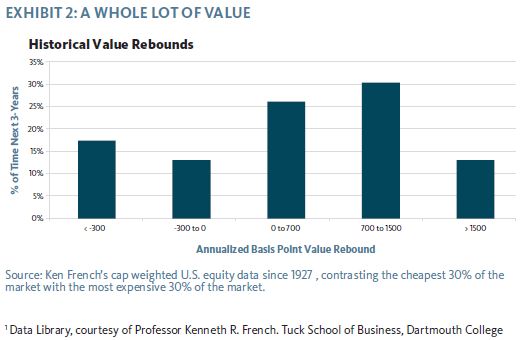
While the returns in Exhibit 2 appear quite attractive, they also came after periods of underperformance. The period through late 2020 was one of the longest and most significant periods of value’s underperformance on record. Since then value has moderately outperformed, albeit in a choppy manner, but we expect this may be just the beginning of a prolonged run by value.
Value’s Uncomfortable Truth
Most investors believe buying low and selling high is a strategy that will generate long-term gains. But purchasing stocks when they’re down tends to feel unnatural and uncomfortable. Holding cheap value stocks while growth-oriented technology stocks continue to soar also frustrates many investors. When it comes to value investing, however, patience really is a virtue.
Our portfolios are diversified across a number of alpha sources, including value, momentum, quality and selection. While the quality tilt and, to a lesser extent, momentum tilt have been beneficial over the last decade, our value tilt has detracted. History however, shows that the times when value is hardest to embrace have been the times when it has provided the biggest subsequent payoffs.
How Consistently Can Value Outperform When the Cycle Shifts?
Everyone wants to know if markets will provide broad and sustained outperformance of value.
The short answer is that value trades are notoriously hard to time, payoffs can be inconsistent, and investors risk missing out on potentially impressive gains by jumping in and out.
That said, we believe a number of potential catalysts provide a tailwind to value, including:
- Rising interest rates (still extremely low now but rising)
- Higher commodity prices (currently rising)
- Increased inflation (currently rising)
- Faster economic growth (current situation)
- Sector/Industry differentials (the Financials sector has led to some very strong months of value performance; Biotechnology has lagged)
- Technology-oriented stocks are under regulatory scrutiny and some may be priced to perfection
This is not an all-encompassing list of potential catalysts—it’s possible some of the catalysts that may propel value outperformance haven’t even been identified yet.
Recognizing the impressive valuation gaps (underpinned by fundamentals such as cash flows, dividends, assets, and earnings) eliminates the need to guess the exact timing of catalysts; we believe investors must simply be patient enough to wait for the market to turn. We acknowledge this may be a challenging mental exercise, given value’s underperformance through late 2020 and inconsistent payoffs in 2021.
The Behavioral Bias Underpinning Our Perspective
SEI is a pioneer in behavioral finance, and this field of study continues to influence our thinking today. Consider recency bias. This describes an investor’s ability to remember items that appear at the end of a long list of complex data, rather than those that appear earlier.
Evaluating conditions in the financial markets often involves reviewing long lists of complex information. Investors may not have systems in place to automatically capture important data points going back many years or decades. Even those who do may not place sufficient weight on older data points.
There are many examples of recency bias throughout the history of financial markets. The last prominent example took place in early 2000. After four years of a raging bull market in technology, media and telecommunications stocks lifted the market to new highs, investors professional and amateur—believed that it was “different this time,” and that stocks that soared during the Tech Bubble would continue to rise unabated despite the experiences of past boom and bust cycles. As we know now, this was not the case, and the Tech Bubble deflated in a tragic spectacle.
Looking back even further, the Nifty Fifty saw a few dozen companies drive market gains in the 1960s and early 1970s. Yet these same companies lagged the market in the 1980s.
Every market environment is different, but the parallels with the current market are easy to spot. The FAANG stocks (Facebook, Amazon, Apple, Netflix and Google) have been quite expensive. As some of these have paused over the past 12 months, newer market darlings have taken over the positions of the most loved mega-cap growth stocks. This category has led the bulk of the gains in the S&P 500 Index in recent years. Meanwhile, unloved value stocks have started to gain attention. It’s worth noting that value stocks went on a five-plus year run after the Tech Bubble burst, and it’s easy to imagine a similar environment as market leadership shifts.
Investors can fight recency bias by remembering that long-term relationships usually hold up for good reason; for example, the relationship between the cash flow that a firm can deliver and the stock price it supports will not vary by large degrees for long periods of time. Eventually, history shows it will revert toward the mean. Investors need to ask whether it’s truly different this time. We don’t believe that is the case.
A Look into Our Portfolios
With regard to value, our most prominent overweight generally tends to be in the financials sector. These companies often trade with attractive price-to-book ratios, and currently have low price-to-earnings ratios along with rising dividends. Bank earnings are benefiting from recent increases in interest rates, increased loan growth, and subsiding impairment loans. The industrials sector represents another value-oriented overweight and consumer cyclicals, while not necessarily an overweight, is a sector that we have found numerous attractively valued stocks. These sectors and stocks should benefit from a normalization of economic activity as the COVID-19 pandemic begins to wane.
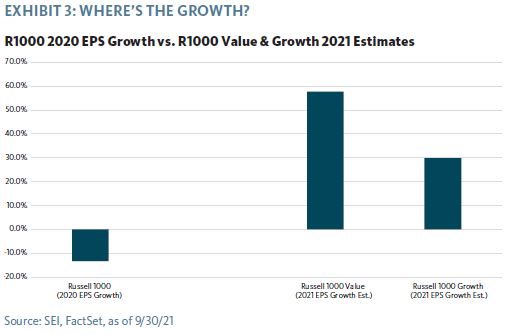
Our portfolio construction is not predicated on market timing. We believe trying to perfectly time trades to capture market inflection points is a futile exercise. Instead, we assess where it makes the most sense to invest the next incremental dollar, and make our decisions accordingly. In an environment where growth is scarce, investors will often pay a premium for growth. In 2020, growth was extremely scarce and we witnessed investors flocking to a chosen few mega-cap technology and technology-related stocks. While investor preference sometimes lead to growth stocks outperforming, in the long term the high valuation premium often attached to such stocks can lead to notable underperformance if earnings miss expectations. This is something that happens frequently due to competitive pressures and mean reversion—in fact, we have begun seeing this numerous times during the third quarter 2021 earnings reports. We now find ourselves in a somewhat uncommon, but highly attractive situation, where value stocks have extraordinarily strong expected earnings growth (Exhibit 3).
Why We Keep the Faith
Even though the past year has been good for value, it has also been choppy. It’s understandable that investors are losing faith in value, but value investing requires patience in order to be rewarded. We stand by our research indicating that value generates long-term outperformance relative to broad equity markets.
After assessing the current market environment, we remain firm in our belief—based on our research and empirical evidence—that, historically, value offers attractive long-term outcomes. We intend to maintain our tactical overweight until a shift in sentiment lifts value—which, in our opinion, is inevitable. Longer term though, we still expect to have a strategic overweight to value (as compared to core indexes) due to our alpha source-based investment process.
Definitions
Alpha sources
There are two types of alpha source:
Behavioural/Systematic
- Value: A mean-reverting investment strategy based on acquiring assets at a discount to their fair valuation.
- Momentum: A trend-following investment strategy based on acquiring assets with recent improvement in their price, earnings, or other relevant fundamentals.
- Quality: A long-term buy and hold strategy based on acquiring assets with superior and stable profitability with high barriers of entry.
Informational/Specific
- Selection: An investment strategy that employs research and judgement to uncover individual opportunities that have been mispriced by other market participants.
Important Information
This material represents an assessment of the market environment at a specific point in time and is not intended to be a forecast of future events or a guarantee of future results. Positioning and holdings are subject to change. All information as of the date indicated. This information should not be relied upon by the reader as research or investment advice, (unless you have otherwise separately entered into a written agreement with SEI for the provision of investment advice) nor should it be construed as a recommendation to purchase or sell a security. The reader should consult with their financial professional for more information.
Statements that are not factual in nature, including opinions, projections and estimates, assume certain economic conditions and industry developments and constitute only current opinions that are subject to change without notice. Nothing herein is intended to be a forecast of future events, or a guarantee of future results.
Certain economic and market information contained herein has been obtained from published sources prepared by other parties, which in certain cases have not been updated through the date hereof. While such sources are believed to be reliable, neither SEI nor its affiliates assumes any responsibility for the accuracy or completeness of such information and such information has not been independently verified by SEI.
There are risks involved with investing, including loss of principal. The value of an investment and any income from it can go down as well as up. Investors may get back less than the original amount invested. Returns may increase or decrease as a result of currency fluctuations. Past performance is not a reliable indicator of future results. Diversification may not protect against market risk. Investment may not be suitable for everyone.
This material is not directed to any persons where (by reason of that person’s nationality, residence or otherwise) the publication or availability of this material is prohibited. Persons in respect of whom such prohibitions apply must not rely on this information in any respect whatsoever.
The information contained herein is for general and educational information purposes only and is not intended to constitute legal, tax, accounting, securities, research or investment advice regarding the strategies or any security in particular, nor an opinion regarding the appropriateness of any investment. This information should not be construed as a recommendation to purchase or sell a security, derivative or futures contract. You should not act or rely on the information contained herein without obtaining specific legal, tax, accounting and investment advice from an investment professional.
Information in the U.S. is provided by SEI Investments Management Corporation (SIMC), a wholly owned subsidiary of SEI Investments Company (SEI).
Information provided in Canada by SEI Investments Canada Company, the Manager of the SEI Funds in Canada.
Information issued in the UK by SEI Investments (Europe) Limited, 1st Floor, Alphabeta, 14-18 Finsbury Square, London EC2A 1BR which is authorised and regulated by the Financial Conduct Authority. Investments in SEI Funds are generally medium- to long-term investments.
SIEL has appointed SEI Investments (Asia) Limited (SEIAL) of Suite 904, The Hong Kong Club Building, 3 Jackson Road, Central, Hong Kong as the sub-distributor of the SEI UCITS funds. SEIAL is licensed for Type 4 and 9 regulated activities under the Securities and Futures Commission (“SFC”)
This information is being made available in Hong Kong by SEIAL. The contents of this document have not been reviewed by any regulatory authority in Hong Kong. You are advised to exercise caution in relation to the offer. If you are in any doubt about any of the contents of this document, you should obtain independent professional advice.
This information is made available in Latin America FOR PROFESSIONAL (non-retail) USE ONLY by SIEL.
Any questions you may have in relation to its contents should solely be directed to your Distributor. If you do not know who your Distributor is, then you cannot rely on any part of this document in any respect whatsoever.
Issued in South Africa by SEI Investment (South Africa) (Pty) Limited FSP No. 13186 which is a financial services provider authorised and regulated by the Financial Sector Conduct Authority (FSCA). Registered office: 3 Melrose Boulevard, 1st Floor, Melrose Arch 2196, Johannesburg, South Africa.


