Three considerations in favor of non-U.S. equities.
Despite a staggering difference in performance between U.S. and non-U.S. equities in recent years, we see three primary considerations for why this tide could turn.
For the ten-year period ending 12/31/2022, U.S. equity markets outperformed non-U.S. markets by 7.78% annualized, with the MSCI USA Index returning 12.45% versus just 4.67% for the MSCI EAFE Index. In U.S.-dollar terms, an investor who started with $1 million in each index ten years ago would have over $1.6 million more today in the U.S. portfolio than the non-U.S. portfolio. With the significant strength in U.S. markets over the last ten years, one could see why investors may doubt their strategic allocation to non-U.S. equities.
Long-term valuations have diverged
Over time, one could argue that over a sufficiently long time horizon, U.S. and non-U.S. equities should have fairly similar performance. Nevertheless, over any period a host of factors can and do cause differences in performance:
- gross domestic product (GDP) growth
- demographics
- inflation
- interest rates
- geopolitics
- currencies
- sector composition
Extremes typically occur when investors think things “can’t get any better” in one segment of the global economy, while shunning others that have experienced tougher times. Exhibit 1 shows the rolling difference in 10-year total returns between U.S. and non-U.S. markets. Clearly, there can be wide differences in relative performance over any given time period.
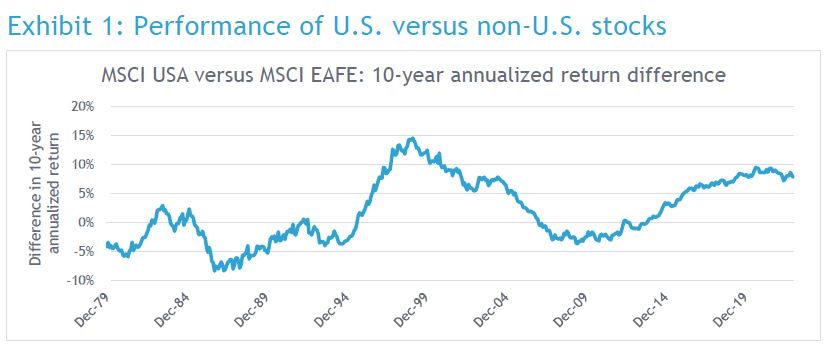
Source: SEI, MSCI, as of 12/31/23. 10-year annualized return of MSCI USA Index minus MSCI EAFE Index. Index returns are for illustrative purposes only and do not represent actual product performance. Index returns do not reflect any management fees, transaction costs or expenses. Indexes are unmanaged and one cannot invest directly in an index. Past performance does not guarantee future results. Performance for both the MSCI USA and MSCI EAFE Indices prior to 3/31/86 is backtested. Back-tested performance, which is hypothetical and not actual performance, is subject to inherent limitations because it reflects application of an Index methodology in hindsight. No theoretical approach can take into account all of the factors in the markets in general and the impact of decisions that might have been made during the actual operation of an index. Actual returns may differ from, and be lower than, back-tested returns. Past performance is no guarantee of future results.
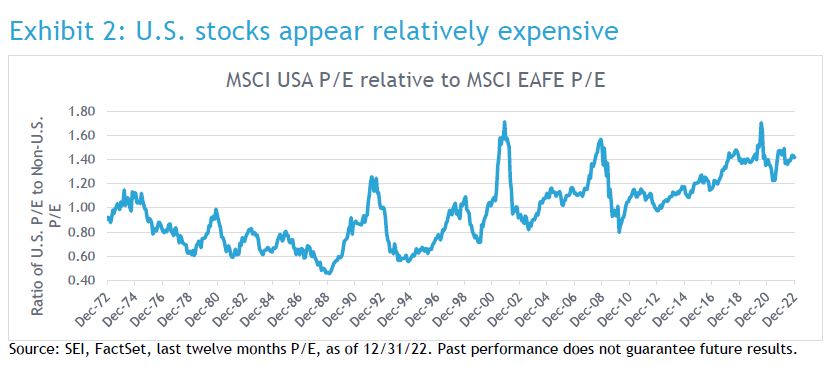
Differences in local currency performance (which eliminates performance variations from currency fluctuations) can be primarily narrowed down into two components—fundamentals and valuations. Much of the time these two measures tend to move in the same direction. When fundamentals, such as earnings growth, in one market outpace another, investors tend to place a premium on that market and pay more per dollar of earnings. Exhibit 2 shows the long-term relationship between the price-to-earnings (P/E) multiple of the MSCI USA and MSCI EAFE indexes. When the line is above one, it indicates that U.S. equities are trading at a premium to non-U.S. equities. The long-run average also happens to be one, suggesting that over the long term, the two markets are in parity. However, there can be large divergences—some that last for a number of years—even though they tend to be mean reverting (returning to the average) after reaching extremes. Today, the P/E of U.S. versus non-U.S. equities ranks in the 93rd percentile, meaning the U.S. market is about as expensive as it has ever been. We believe mean reversion is a powerful concept in investing, and Exhibit 2 suggests the potential for this to happen.
Fundamentals
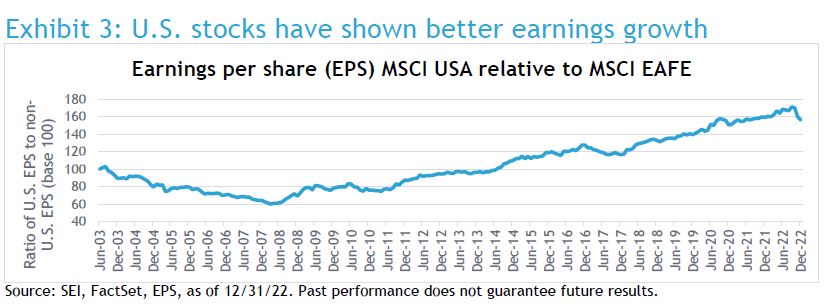
When discussing fundamentals, we are referring to the earnings growth and profitability of the companies comprising an index. Since the Global Financial Crisis (GFC) of 2008/2009, U.S. equities have continued to trade at a higher and higher premium to non-U.S. equities. There is a host of fundamental reasons one could attribute to this strength. U.S. GDP growth has generally been stronger than elsewhere in the world. The U.S. technology sector has experienced tremendous dominance over the past decade, with companies like Microsoft, Alphabet (Google’s parent company), Amazon, and Apple posting enormous profits. Low interest rates have been a boon technology-heavy U.S. stock indexes, yet made it challenging for non-U.S. indexes that tend to have more weight to financials, particularly banks. Europe also went through a serious debt crisis in the first half of the last decade, while Japan has continued to struggle with deflation, debt, and a slow growing economy. These cycles are nothing new, and while they often seem never ending, when given enough time, markets, valuations, and earnings all tend to return to their long-term averages (mean reversion). Nevertheless, these dynamics have manifested in more robust earnings growth in the U.S. post-GFC as can be seen in Exhibit 3.
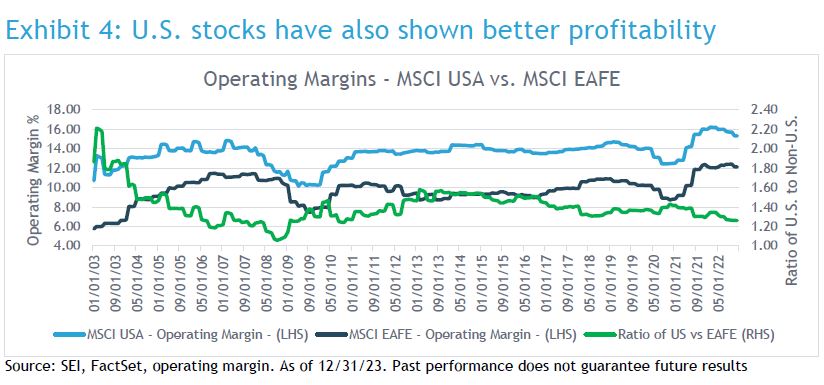
Turning to the fundamental characteristic of profitability, research shows there is a direct relationship between a company’s profitability and the valuation an investor should pay for it. Looking at operating margins reveals that the U.S. has been more profitable over time. The trend has been quite steady, and there does not appear to be anything abnormal about the last 10 years. The green line shows the ratio of U.S. to non-U.S. operating margins, suggesting a steady relationship—if anything, non-U.S. markets are becoming more profitable relative to the U.S.
Currency mean reversion
Currencies are an important, yet typically overlooked, input to returns from investors in foreign equities. While currencies, like earnings and valuations, are difficult to forecast in the short term, there are some longer-term observations that can be made.
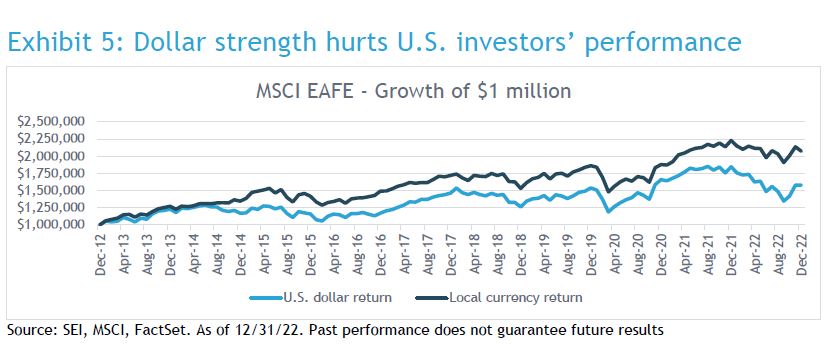
As a refresher, currency movements can impact the returns of an investor’s non-U.S. equities in two primary ways. First, currency exchange rates affect the earnings of companies that sell their products across the globe. Although, it is challenging (if not impossible) to determine all of the moving pieces at any given time, we can use a simple example to illustrate the point. If a U.S. company earns half of its profits from foreign countries, exchange rates influence how much profit in dollars the company makes. All else equal, if the U.S. dollar weakens, that U.S. company will earn more money from its foreign business operations. However, there are other considerations such as where the company incurs costs, hedging strategies employed, etc. The second way currencies affect the value is more tangible. When the dollar is appreciating, a U.S. investor’s foreign equity holdings translate back to lower values in U.S. dollars, creating a headwind to performance. Turning to a real example, Exhibit 5 shows the growth of $1 million invested in the MSCI EAFE Index in U.S. dollar and in local currency terms. Over the ten years ended 12/31/2022, the MSCI EAFE Index returned just 4.67% in U.S. dollar terms, versus 7.56% in local terms, a significant difference of almost 300 basis points (a basis point equals 0.01%) annualized over ten years. In an environment where the dollar is depreciating, one could imagine a scenario where the non-U.S. portfolio returns much more than its local currency return of 7.56%.
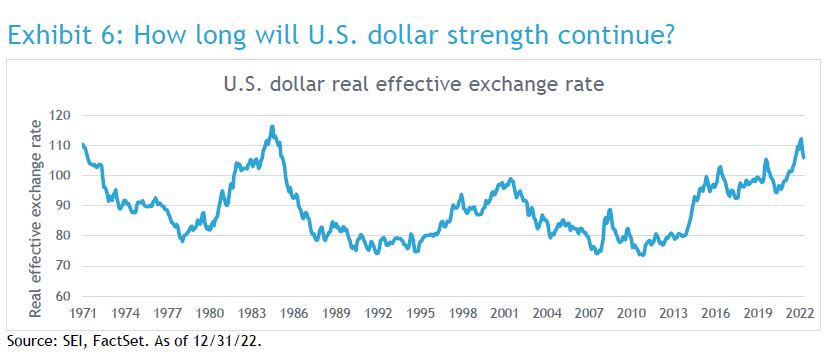
The U.S. dollar has appreciated materially versus many foreign currencies over the last ten years. Exhibit 6 shows a longer-term perspective on the dollar and its competitiveness. There are many ways to gauge a currency’s value, with a “real effective exchange rate” being one of the more commonly used and better known approaches. It is an inflation-adjusted exchange rate versus other currencies, weighted by how much trade the U.S. does with each. Essentially, when the line is high, it means foreign currencies are weak (dollar is strong) and in turn makes U.S. products expensive to foreigners. Conversely, other countries’ exports are more competitive because they don’t appear as expensive to U.S. consumers. Today the dollar seems to be at an elevated level (expensive) compared to other currencies. While a move higher could certainly be in the cards, long-term mean reversion would bode well for international equity returns.
Positioning
When considering future drivers of investment returns, the wide valuation dispersions cause us to retain a preference for the value alpha source. Additionally, we continue to retain exposure to the quality and momentum alpha sources. In terms of sector positioning, this translates to an overweights in information technology and industrials, with underweights to real estate and communications. Regionally, we maintained an underweight to Japan and an overweight to Europe. Our international, non-U.S. portfolios tend to be underweight to Japan, as it is a significant component of the index and managers—particularly those favoring the quality alpha source—have a harder time finding high quality companies in Japan as compared to Europe.
Inflation, while still a problem, seems to be moderating as central banks are committed to raising interest rates. Yet, the situation is highly fluid, which makes forecasting unreliable (as always). Regardless, we have to look at the long-term data and position accordingly.
Valuation spreads are still high by historical standards, while value stocks are cheap and their fundamentals have held up reasonably well. As such, we continue to believe that value is poised for outperformance over a longer period—particularly as high inflation could provide further support.
Glossary
The MSCI EAFE Index is an unmanaged, market-capitalization-weighted equity index that represents the developed world outside North America.
The MSCI USA Index is designed to measure the performance of the large and mid-cap segments of the U.S market. With 624 constituents, the index covers approximately 85% of the free float-adjusted market capitalization in the U.S.
Glossary of alpha sources
Alpha source: Alpha source is a term used by SEI as part of our internal classification system to categorize and evaluate investment managers in order to build diversified fund portfolios. An alpha source is the investment approach taken by an active investment manager in an effort to generate excess returns. Another way to define an alpha source is that it is the inefficiency that an active investment manager seeks to exploit in order to add value.
Momentum: A trend-following investment strategy that is based on acquiring assets with recent improvement in their price, earnings, or other relevant fundamentals.
Quality: A long-term buy and hold strategy that is based on acquiring assets with superior and stable profitability with high barriers of entry.
Security selection: An investment strategy that employs research and judgement to uncover individual opportunities that have been mispriced by other financial market participants.
Value: A mean-reverting investment strategy that is based on acquiring assets at a discount to their fair valuation.
Important information
This material represents an assessment of the market environment at a specific point in time and is not intended to be a forecast of future events or a guarantee of future results. Positioning and holdings are subject to change. All information as of the date indicated. There are risks involved with investing, including possible loss of principal. This information should not be relied upon by the reader as research or investment advice, (unless you have otherwise separately entered into a written agreement with SEI for the provision of investment advice) nor should it be construed as a recommendation to purchase or sell a security. The reader should consult with their financial professional for more information.
Statements that are not factual in nature, including opinions, projections and estimates, assume certain economic conditions and industry developments and constitute only current opinions that are subject to change without notice. Nothing herein is intended to be a forecast of future events, or a guarantee of future results.
Certain economic and market information contained herein has been obtained from published sources prepared by other parties, which in certain cases have not been updated through the date hereof. While such sources are believed to be reliable, neither SEI nor its affiliates assumes any responsibility for the accuracy or completeness of such information and such information has not been independently verified by SEI.
There are risks involved with investing, including loss of principal. The value of an investment and any income from it can go down as well as up. Investors may get back less than the original amount invested. Returns may increase or decrease as a result of currency fluctuations. Past performance is not a reliable indicator of future results. Investment may not be suitable for everyone. Diversification may not protect against market risk.
This material is not directed to any persons where (by reason of that person's nationality, residence or otherwise) the publication or availability of this material is prohibited. Persons in respect of whom such prohibitions apply must not rely on this information in any respect whatsoever.
The information contained herein is for general and educational information purposes only and is not intended to constitute legal, tax, accounting, securities, research or investment advice regarding the strategies or any security in particular, nor an opinion regarding the appropriateness of any investment. This information should not be construed as a recommendation to purchase or sell a security, derivative or futures contract. You should not act or rely on the information contained herein without obtaining specific legal, tax, accounting and investment advice from an investment professional.
Information in the U.S. is provided by SEI Investments Management Corporation (SIMC), a wholly owned subsidiary of SEI Investments Company (SEI).
Information provided in Canada by SEI Investments Canada Company, the Manager of the SEI Funds in Canada.
Information issued in the UK by SEI Investments (Europe) Limited, 1st Floor, Alphabeta, 14-18 Finsbury Square, London EC2A 1BR which is authorised and regulated by the Financial Conduct Authority. Investments in SEI Funds are generally medium- to long-term investments.
SIEL has appointed SEI Investments (Asia) Limited (SEIAL) of Suite 904, The Hong Kong Club Building, 3 Jackson Road, Central, Hong Kong as the sub-distributor of the SEI UCITS funds.
The contents of this document have not been reviewed by any regulatory authority in Hong Kong. You are advised to exercise caution in relation to the offer. If you are in any doubt about any of the contents of this document, you should obtain independent professional advice
This information is made available in Latin America FOR PROFESSIONAL (non-retail) USE ONLY by SIEL.
Any questions you may have in relation to its contents should solely be directed to your Distributor. If you do not know who your Distributor is, then you cannot rely on any part of this document in any respect whatsoever.
Issued in South Africa by SEI Investments (South Africa) (Pty) Limited FSP No. 13186 which is a financial services provider authorised and regulated by the Financial Sector Conduct Authority (FSCA). Registered office: 3 Melrose Boulevard, 1st Floor, Melrose Arch 2196, Johannesburg, South Africa.


