Sticky inflation + stubborn central banks = spirited markets. (Part 2) (Long Version)
The Quarterly Economic Outlook will be published in two installments. In the first installment, we focused on the growth prospects of the global economy. In this report, we take a look at inflation and the impact it is having on economic policies and how this may be reflected in market performance.
In the spring of 2021, we began to use the phrase “persistently transitory” to describe our inflation view. At the time, we believed that inflation would stay higher for much longer than economists, central bankers, and market participants anticipated, owing to the huge stimulus packages provided by governments in response to COVID-19, the shortages of goods caused by the associated lockdowns, and what we viewed as a developing structural shortage of labor that would keep services inflation at a higher level for years to come. Unforeseen events, particularly Russia’s invasion of Ukraine and the extensive and prolonged COVID-19 lockdowns in China, temporarily worsened the inflation picture beyond our expectations.
By the spring of 2023, Exhibit 1 shows that headline inflation had come down dramatically, raising hopes that the Federal Reserve (Fed) and other major central banks are succeeding in bringing inflation back to their 2% target without undue economic pain. On a harmonized consumer-price index (CPI) basis, U.S. inflation was already near target as of February 2024, with a year-over-year gain of 2.2%. At 2.6%, the eurozone isn’t too far away either. The improvement in the U.K. is coming along more slowly, with the latest reading in February indicating a 3.8% increase from a year earlier.
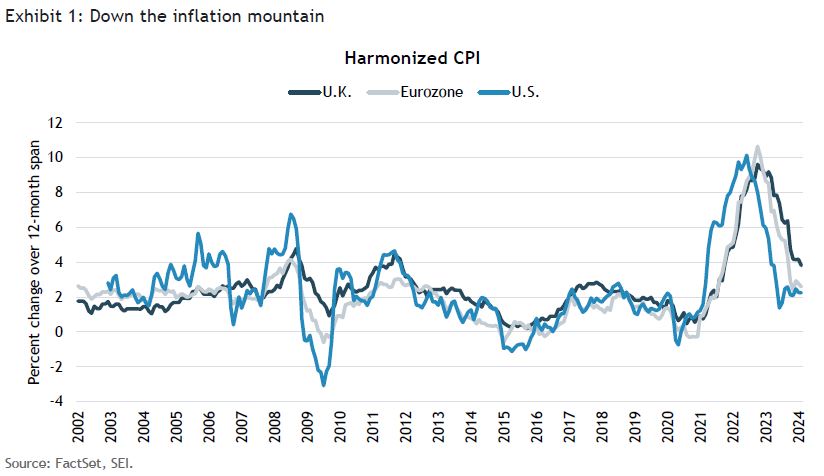
The question is: Can inflation settle near 2% on a sustained basis? We remain doubtful. The downward pressure on commodities and goods prices is already starting to ease as demand and supply come into better balance. We believe the rapid deceleration in inflation caused by the outright decline in energy and other goods prices should itself be viewed as transitory.
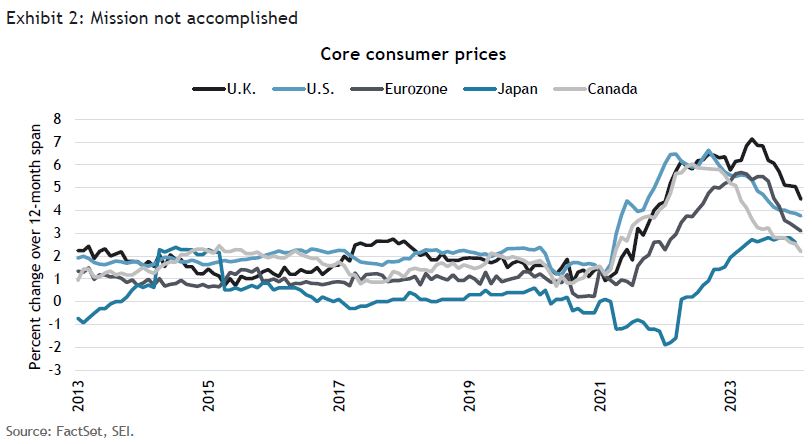
Core inflation, excluding food and energy, also has come down from peak readings, but generally remains well above the 2% level. Exhibit 2 highlights core CPI inflation across several major developed countries and the eurozone. By this measure, inflation remains appreciably above target in the U.K. (+4.5%), the U.S. (+3.8%), and the eurozone (+3.1%). Canada has registered the sharpest improvement in its core inflation rate, posting a year-over-year gain of 2.2%, but other measures of core inflation tracked by the Bank of Canada (BOC) are not nearly as benign, converging around 3.0%-3.2%.
We continue to obsess about labor-market conditions and their impact on wage costs. Unit labor costs are a good yardstick of underlying inflation, since they measure increases in total employee compensation per hour, offset by productivity improvements. Exhibit 3 highlights the rise in unit labor costs for the U.K., Canada, the eurozone, the U.S., and Japan for both 2023 and the 10 years prior to the onset of COVID-19. The comparisons are stunning. The U.K. registered an 8% gain in 2023, compared to an annualized increase of only 1.2% between 2009 and 2019. Canada and the eurozone experienced hefty increases in 2023, amounting to 5.7% and 5.5%, respectively; these gains are greater than their earlier 10-year periods by four percentage points or more. The U.S. recorded a rise of “only” 3.7% in unit labor costs last year, while the decade before COVID-19 saw annualized increases averaging 1.6%. Even Japan logged a notable acceleration in 2023 and appears set to accelerate further.
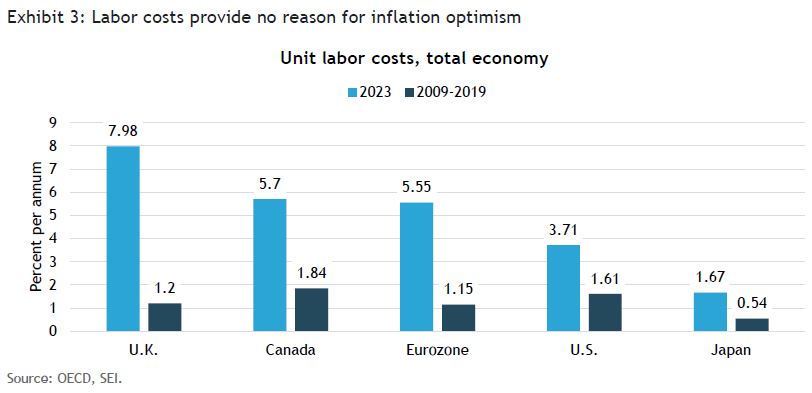
Exhibit 4 highlights how closely core inflation (using the Fed’s favorite inflation measure, the personal-consumption-expenditures (PCE) price index) tracks the change in unit labor costs in the U.S. We show those changes over annualized three-year spans to smooth out the year-to-year fluctuations. Note that unit labor costs tend to track below inflation both in the aftermath of recessions and in the early phase of expansions. As expansions press on, however, unit labor costs tend to increase at a faster pace than underlying inflation. This dynamic occurs because productivity tends to soar in the early stages of an expansion as output recovers faster than employment and hours worked. As the economic cycle matures, however, wages tend to accelerate while productivity gains fade.
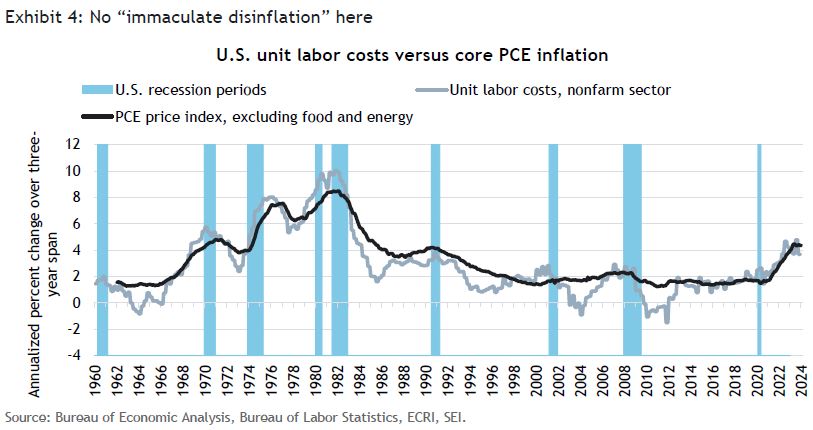
We think the current expansion is getting long in the tooth, yet there is still no sign of recessionary stress in the U.S. Although labor markets across the globe are not as tight as they were a year or two ago, they are still tight enough to keep compensation growth at a pace that is significantly above the gains in productivity. The rise in unit labor costs should stay elevated, as should underlying inflationary pressures. We believe this will continue to present a major challenge for policy-makers.
Central banks walk a tightrope
We have been steadfast in our expectation that central banks, especially the Fed in the U.S. and the Bank of England (BoE) in the U.K., would be reluctant to cut policy rates against the backdrop of above-target inflation rates, resilient economic growth, or both. Earlier this year, the futures and swap markets priced in an expectation that the Fed would decrease the federal-funds rate by approximately 150-175 basis points (1.50-1.75%)—the equivalent of six-to-seven cuts of 25 basis points—by the end of 2024. We saw no reason for such optimism and stuck to our view that three 25 basis-point reductions totaling 75 basis points (0.75%) would be the actual outcome, consistent with the Federal Open Market Committee’s (FOMC) own projections. In our view, any surprises from the Fed would more likely come in the form of fewer, not more, policy-rate cuts this year.
In March, the Fed updated its economic projections, including that of the federal-funds rate. The median forecast for real gross domestic product (GDP) in 2024 was revised to 2.1%, up sharply from the 1.4% expected in December. Forecasts of growth in GDP in 2025 and 2026 rose slightly to 2%. The unemployment rate was reduced to 4%, and FOMC members saw the jobless rate staying mostly stable over the next two years. Core PCE inflation for 2024 was revised up to 2.6% from the previous estimate of 2.4%. The median forecast suggests that inflation is still expected to decelerate to the longer-run target of 2% by 2026.
The median forecast of 4.6% for the federal-funds rate did not change, although we note that the central tendency range of predictions moved a quarter-point higher to a range of 4.6-5.1%. The median estimates for year-end 2025 (3.9%) and 2026 (3.1%) also have ticked up slightly. The decision-makers at the Fed still seem to be betting that they can safely cut rates three times this year and still see lower inflation against the backdrop of a resilient economy marked by a structurally lower unemployment rate.
The Monetary Policy Committee (MPC) at the Bank of England faces similar challenges as the Fed, emphasizing the need to wait and see before taking any policy actions. Although inflation has eased, underlying price pressures are unlikely to recede very much. The country’s minimum wage was set to climb by 9.8% on April 1; services inflation remains quite sticky at a 6% annual rate. In the meantime, the BoE continues to reduce its portfolio of gilts (U.K. treasury bonds) at a time when the Conservative government is pushing through tax breaks in an attempt to improve its popularity ahead of the general election to be held by the end of 2024. Markets earlier this year were pricing in as many as seven Bank Rate reductions in 2024. As in the U.S., that unwarranted optimism has been mostly deflated.
Exhibit 5 tracks the policy interest rates of the major central banks. Except for the Bank of Japan, which has been the outlier throughout the rate-hiking cycle, all of the central banks highlighted in the chart have kept their policy rates steady this year after aggressive increases in 2022 and the first half of 2023. The Fed, the BOC, and the BOE haven’t changed their target rates since last summer. The European Central Bank (ECB) last raised its deposit facility rate in September 2023.
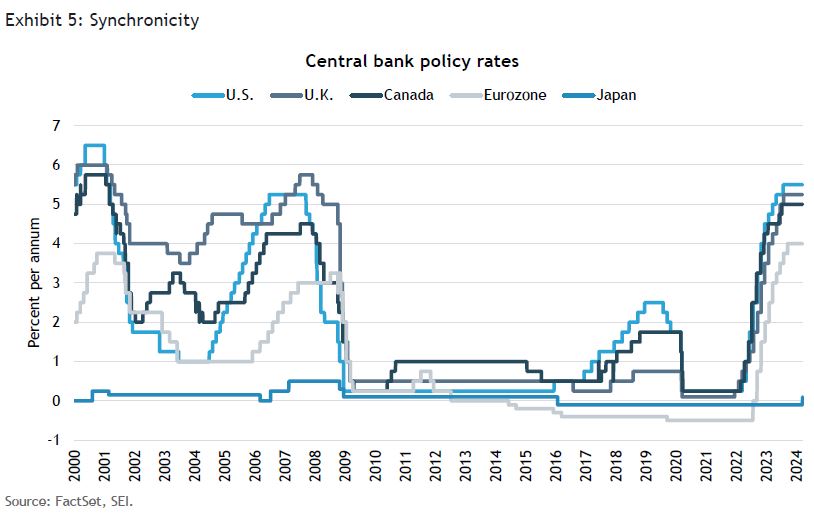
Monetary policy moves by the major central banks have been fairly uniform since the Global Financial Crisis of the late 2000s. It probably will stay this way, given the similar challenges these countries are currently facing. The ECB might be the first central bank to cut its policy rate, given its weaker economic outlook relative to the U.S. and appreciably lower inflation rate than the U.K. The risks to growth still appear to be to the downside as Germany’s manufacturing-oriented economy continues to sputter. Fiscal policy in the eurozone is also tightening rather dramatically (almost 1% of GDP), mostly due to the decline in energy subsidies and the reduction in various tax breaks. Of course, the ECB’s policy rate is already below those of the Fed, the BoE, and BOC; reducing rates ahead of the others could put more downward pressure on its currency.
Japan’s policy course, on the other hand, appears completely different. The Bank of Japan’s (BOJ) recent rate increase is the first change since January 2016, and the first increase in 17 years. In addition to pushing its overnight rate into (barely) positive territory, the BOJ made several other policy moves. It discontinued its purchases of exchange-traded funds (ETFs) and Japanese real-estate investment trusts (J-REITs), and will gradually reduce its purchases of commercial paper and corporate bonds, ending those operations completely in about a year. The Bank of Japan still intends to be an aggressive buyer of Japanese government bonds, although it has now placed an upper limit on those purchases. Its policy of yield-curve control, through which the BOJ manipulated Japan’s yield curve and specifically targeted a yield level for the Japanese 10-year benchmark bond, has ended.
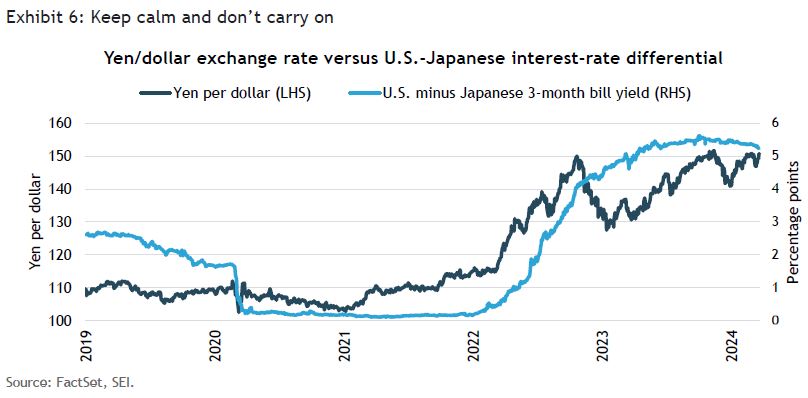
The BOJ emphasized that it will still be slow to normalize monetary policy. Japanese interest rates remain extremely low relative to other countries, in both nominal and inflation-adjusted terms. This explains why the yen weakened against the U.S. dollar in the aftermath of the BOJ’s announcement. Exhibit 6 shows that the yawning interest-rate differential that has opened up between Japan and the U.S. since the end of 2021, has led to an equally sharp depreciation of the yen. Going long the yen (buying yen, selling the dollar) is not very tempting when the cost of carry (borrowing at a relatively lower interest rate to invest in a higher-yielding asset, and reaping the difference) is so high.
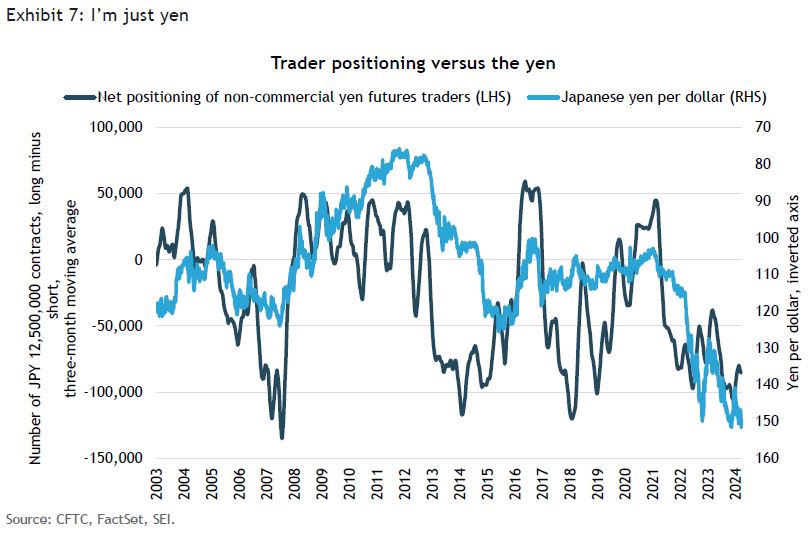
It probably will take a more dramatic rise in Japanese interest rates and a clear trend toward monetary policy easing by the Fed before the yen can appreciate meaningfully against the dollar. But there’s no denying that traders are lined up on one side of the ship, betting on additional yen depreciation. Exhibit 7 highlights the percentage of speculators in the futures markets that are long the yen as a percentage of open interest. That percentage remains near all-time lows. When and if those positions are unwound, the yen could rise quite quickly. What is needed is a catalyst, but that is hard to find at the moment. Nevertheless, it is probable that further downside in the yen is limited at this point. The odds of intervention by Japan’s Ministry of Finance on behalf of the yen are rising.
Risk-on for markets
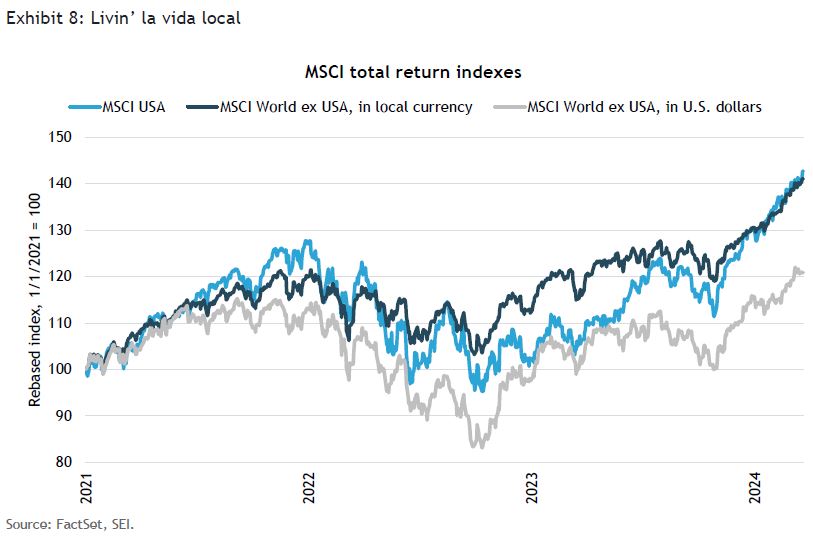
Investors have shrugged off any fear they may have had about economic growth, inflation, or the direction of interest rates. Equity markets in many countries and regions have been pushing higher in the past six months, approaching or achieving new all-time highs in the process. Exhibit 8 compares the total return of the MSCI USA Index since the start of 2021 against that of the MSCI World ex USA Index in both local-currency and U.S. dollar terms. Some may be surprised to learn that, in local-currency terms, other developed-world stock markets have kept pace with U.S. equities. From the perspective of a U.S.-based investor, however, that cumulative 40% return in the MSCI World ex USA Index is reduced by roughly 50% as a result of the dollar’s appreciation against other currencies.
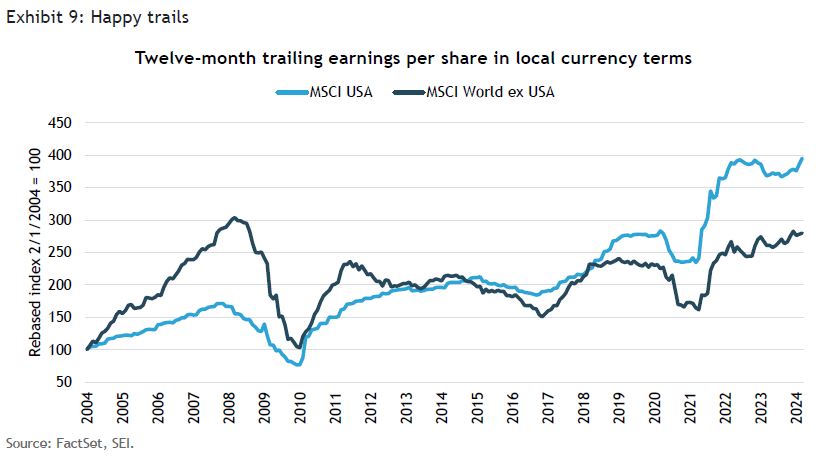
As we noted in our first installment of the Quarterly Economic Outlook, the U.S. remains the leading economic engine for the world, adding to current enthusiasm stoked by the artificial intelligence (AI) boom. Yet, actual 12-month trailing earnings were mostly flat from the early part of 2022 to the end of last year. In recent months, actual earnings in the U.S. have perked up sharply, while other developed markets tracked by MSCI have improved more gradually. As seen in Exhibit 9, U.S. companies have outperformed their non-U.S. counterparts on the earnings front since 2018. Over the full 20-year span illustrated in the chart, U.S. earnings per share have nearly quadrupled (+295%), while the rest of the developed world’s profits advanced a cumulative 180%. Given this earnings performance, it is easy to see why investors have viewed U.S. equities as the “best game in town.”
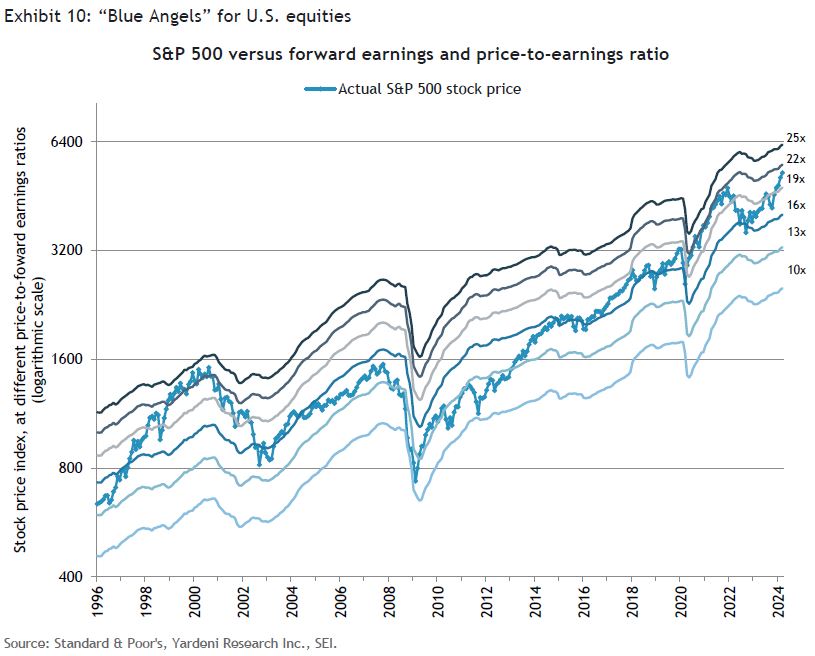
It goes without saying that the strong performance of the U.S. stock market is not the result of what earnings have done over the past year. Expectations for future earnings are what counts. Exhibit 10 examines U.S. equity valuations in greater depth, using the so-called “Blue Angels” concept created by economist Ed Yardeni. It compares the actual price-return level of the S&P 500 Index against would-be levels of the index at different forward price-to-earnings (P/E) ratios. Yardeni refers to the chart as the “Blue Angels” because the ratio lines “fly” in parallel formation like the famed U.S. Navy squadron of the same name, while the actual S&P 500 Index (depicted here as the blue line with the diamond markers) cuts through the “contrails” of the various forward P/E ratio levels. The chart not only shows how expensive equities are at any given moment relative to history, it also highlights the current trajectory of 12-month forward operating earnings projected by bottom-up security analysts. Climbing contrails point to rising earnings estimates, thereby supporting a higher stock price at a given P/E ratio.
While trailing earnings have been flat over the past year or so, forward-looking earnings estimates have been on the rise since the start of 2023. That is good news in itself, but the 9.1% gain in forward earnings since January 2023, explains only a small portion of the 36.9% price return in the S&P 500 Index over the same period. Forward-looking earnings multiples have jumped, too, from 16.6 times earnings at the end of December 2022 to 21.0 times at the end of March 2024. The P/E ratio slightly exceeded current levels for much of 2020 and 2021, a time when earnings estimates were rising at an even faster pace than they are now. The only time in the past 28 years when earnings multiples ran even higher was during the dot-com bubble of 1998 to 2000.
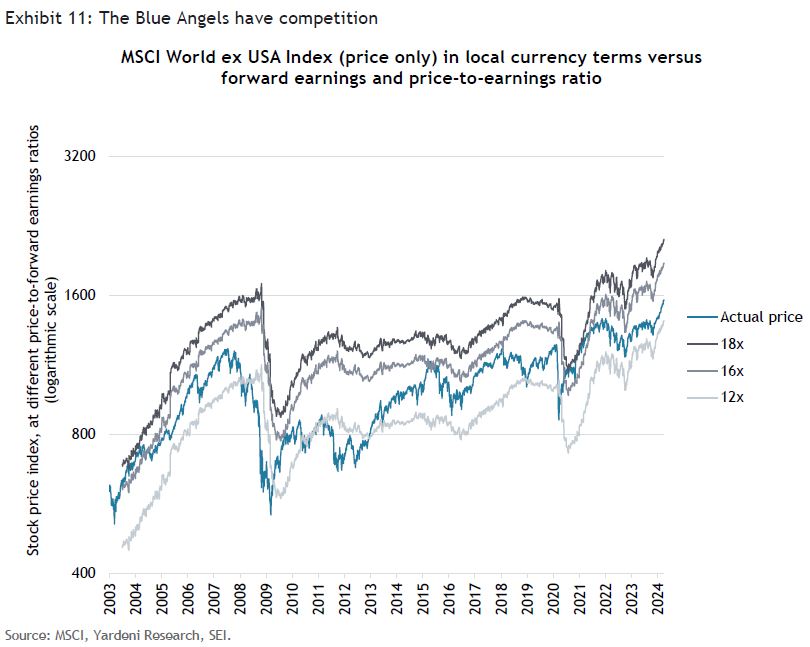
Thanks in no small part to the so-called “Magnificent Seven” mega-cap technology stocks, there is a fair degree of optimism built into the price of the S&P 500 Index. SEI believes it is important to remember that it’s a big world out there, and many other countries have their own equivalents of the Blue Angels. Similar to the previous chart, Exhibit 11 tracks the price-return level of the MSCI World ex USA Index against forward price-to-earnings ratios. Forward earnings outside the U.S. jumped 22.8% in local-currency terms from the end of 2022 through the first quarter of 2024, versus the 9.1% increase for U.S. companies. But the forward P/E ratio remains at a much lower valuation, amounting to just 13.3 times earnings as of March.
The more highly equities are valued, the more vulnerable they tend to be if negative surprises appear, or when bond yields move higher. So far, the growth surprises have been on the positive side, offsetting the rebound in bond yields recorded this year and in 2023. Broadly speaking, we think that U.S. Treasurys are fairly valued at present. Heavy bond issuance in the years ahead, and the possibility that investors will begin to demand a positive term premium as compensation for the risks associated with holding longer-dated paper, suggest to us that bond yields will remain at elevated levels even as short-term rates begin to fall. One of our higher-conviction forecasts is for a steeper yield curve, in which short-term rates fall more quickly relative to long-term rates.
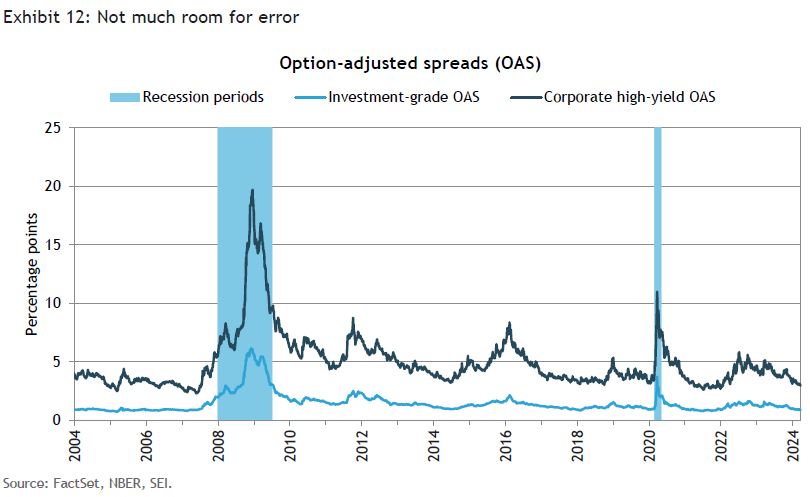
Credit spreads also remain tight, reflecting investors’ optimism that economic growth will continue unabated. As we show in Exhibit 12, spreads on both investment-grade and high-yield bonds remain close to their historic lows. Investors may not be irrationally exuberant, but they are certainly complacent.
Jim Smigiel, SEI’s Chief Investment Officer, sums up SEI’s current market outlook this way:
- U.S. interest-rate expectations have converged thus far in 2024, as stubborn inflation data and a mixed employment picture have led investors to back away from predictions of aggressive interest-rate reductions from the Fed. As of now, roughly three rate cuts are priced in, most likely starting in June, putting market expectations only slightly ahead of our own. Nevertheless, risks to this view are, in our opinion, clearly on the side of fewer rate cuts.
- We would not be surprised to see mild weakness in the jobs data seize the attention of policy-makers and serve as a catalyst for the first rate cut in early summer, even if inflation remains above target. We hold the view that inflation will stay stickier than expected on a slower decline in service inflation and a continued rebound in goods inflation.
- Equity market performance has been strong, if not broad-based, thus far in 2024, on a solid earnings season—and despite aggressive Fed rate cuts being off the table for now. We prefer a more diversified approach in general, and a value orientation more specifically right now, as value spreads remain at historically wide levels. We are also interested in the relatively low level of equity volatility, and have been taking advantage of inexpensive insurance to protect against potential drawdowns.
- We also remain bullish on active equity management. Concentrated markets tend to be extremely difficult environments for active managers to outperform, and that has certainly been true over the past 12 months. As the Magnificent Seven begins to diverge in performance and concentration begins to fall, we see a tailwind for active management developing and believe that now would be an opportune time for passive investors to consider building positions in active strategies.
- The 10-year Treasury yield is down from the high of 5.0% reached in October 2023, but well above where it started the year. We see additional room for bond yields to move higher, not only on the aforementioned sticky inflation data, but also on the substantial budget funding pressures and the lack of term premium priced into the yield curve. We would not be surprised to see the 10-year Treasury yield retest the 5% level even with the prospect of rate cuts on the horizon.
Glossary
Brexit is a combination of “Britain” and “exit,” referring to the U.K.’s withdrawal from the European Union on January 31, 2020.
A carry trade involves borrowing at a low interest rate and then investing in an asset with a higher interest rate.
Global Financial Crisis (GFC) refers to the period of extreme stress in global financial markets and banking systems between mid-2007 and early 2009.
Gross domestic product (GDP) is the total monetary or market value of all the goods and services produced in a country during a certain period.
The Magnificent Seven (Magnificent 7) is a group of mega-capitalization technology-oriented companies that delivered strong returns in 2023. The group comprises Nvidia, Microsoft, Apple, Amazon, Meta, Alphabet, and Tesla.
Index definitions
The consumer-price index (CPI) measures changes in the price level of a weighted-average market basket of consumer goods and services purchased by households.
A Harmonized Index of Consumer Prices measures inflation is a consumer price index that tracks change over time in the prices households pay for a basket of goods and services. This metric eliminates Owner’s Equivalent Rent from the standard U.S. consumer-price index.
A market-capitalization (market-cap) weighted index assigns the weighting of its underlying stocks proportionally by size as measured by this total value. Many indices are market-cap weighted so that smaller companies (companies with smaller capitalizations) do not have a disproportionate impact on the performance of the index.
The MSCI USA Index tracks the performance of the large- and mid-cap segments of the U.S. equity market. The index’s 624 constituents comprise approximately 85% of the free float-adjusted (i.e., including only shares that are available for public trading) market capitalization in the U.S.
The MSCI World ex USA Index tracks the performance of the large- and mid-cap segments of equity markets across 22 of 23 developed- market countries--excluding the U.S. The index’s 887 constituents comprise approximately 85% of the free float-adjusted (i.e., including only shares that are available for public trading) market capitalization in each country.
The personal-consumption expenditures (PCE) price index measures the prices that consumers pay for goods and services to reveal underlying inflation trends. The core PCE price index, the primary inflation monitor used by the Federal Reserve, excludes volatile food and energy prices.
The S&P 500 Index (price only) is a market-weighted index that tracks the performance (excluding dividends) of the 500 largest publicly traded U.S. companies and is considered representative of the broad U.S. stock market.
Important information
This material represents an assessment of the market environment at a specific point in time and is not intended to be a forecast of future events, or a guarantee of future results. Positioning and holdings are subject to change. All information as of the date indicated. There are risks involved with investing, including possible loss of principal. This information should not be relied upon by the reader as research or investment advice, (unless you have otherwise separately entered into a written agreement with SEI for the provision of investment advice) nor should it be construed as a recommendation to purchase or sell a security, including futures contracts. The reader should consult with their financial professional for more information.
Statements that are not factual in nature, including opinions, projections and estimates, assume certain economic conditions and industry developments and constitute only current opinions that are subject to change without notice. Nothing herein is intended to be a forecast of future events, or a guarantee of future results.
Certain economic and market information contained herein has been obtained from published sources prepared by other parties, which in certain cases have not been updated through the date hereof. While such sources are believed to be reliable, neither SEI nor its affiliates assumes any responsibility for the accuracy or completeness of such information and such information has not been independently verified by SEI.
There are risks involved with investing, including loss of principal. The value of an investment and any income from it can go down as well as up. Investors may get back less than the original amount invested. Returns may increase or decrease as a result of currency fluctuations. Past performance is not a reliable indicator of future results. Investment may not be suitable for everyone.
Diversification does not ensure a profit or guarantee against a loss. International investments may involve risk of capital loss from unfavorable fluctuation in currency values, from differences in generally accepted accounting principles or from economic or political instability in other nations. Emerging markets involve heightened risks related to the same factors as well as increased volatility and lower trading volume. Narrowly focused investments and smaller companies typically exhibit higher volatility. Bonds and bond funds will decrease in value as interest rates rise. High-yield bonds involve greater risks of default or downgrade and are more volatile than investment-grade securities, due to the speculative nature of their investments.
Index returns are for illustrative purposes only and do not represent actual portfolio performance. Index returns do not reflect any management fees, transaction costs or expenses. One cannot invest directly in an index.
This material is not directed to any persons where (by reason of that person's nationality, residence or otherwise) the publication or availability of this material is prohibited. Persons in respect of whom such prohibitions apply must not rely on this information in any respect whatsoever.
The information contained herein is for general and educational information purposes only and is not intended to constitute legal, tax, accounting, securities, research or investment advice regarding the strategies or any security in particular, nor an opinion regarding the appropriateness of any investment. This information should not be construed as a recommendation to purchase or sell a security, derivative or futures contract. You should not act or rely on the information contained herein without obtaining specific legal, tax, accounting and investment advice from an investment professional.
SEI sources data directly from FactSet, Lipper, and BlackRock unless otherwise stated.
Information provided by SEI Investments Management Corporation, a wholly owned subsidiary of SEI Investments Company (SEI). They should not be construed as investment advice.
Information provided in Canada by SEI Investments Canada Company, the Manager of the SEI Funds in Canada.
Information issued in the UK by SEI Investments (Europe) Limited, 1st Floor, Alphabeta, 14-18 Finsbury Square, London EC2A 1BR which is authorised and regulated by the Financial Conduct Authority. Investments in SEI Funds are generally medium- to long-term investments.
This document has not been registered by the Registrar of Companies in Hong Kong. In addition, this document may not be issued or possessed for the purposes of issue, whether in Hong Kong or elsewhere, and the Shares may not be disposed of to any person unless such person is outside Hong Kong, such person is a “professional investor” as defined in the Ordinance and any rules made under the Ordinance or as otherwise may be permitted by the Ordinance.
The contents of this document have not been reviewed by any regulatory authority in Hong Kong. You are advised to exercise caution in relation to the offer. If you are in any doubt about any of the contents of this document, you should obtain independent professional advice.
This information is made available in Latin America and the Middle East FOR PROFESSIONAL (non-retail) USE ONLY by SIEL.
Any questions you may have in relation to its contents should solely be directed to your Distributor. If you do not know who your Distributor is, then you cannot rely on any part of this document in any respect whatsoever.
Issued in South Africa by SEI Investment (South Africa) (Pty) Limited FSP No. 13186 which is a financial services provider authorised and regulated by the Financial Sector Conduct Authority (FSCA). Registered office: 3 Melrose Boulevard, 1st Floor, Melrose Arch 2196, Johannesburg, South Africa.
This material is intended for information purposes only and the information in it does not constitute financial advice as contemplated in terms of the Financial Advisory and Intermediary Services Act.
SIEL is not licensed under Israel’s Regulation of Investment Advising, Investment Marketing and Portfolio Management Law, 5755-1995 (the “Advice Law”) and does not carry insurance pursuant to the Advice Law. No action has been or will be taken in Israel that would permit a public offering or distribution of the SEI Funds mentioned in this email to the public in Israel. This document and any of the SEI Funds mentioned herein have not been approved by the Israeli Securities Authority (the “ISA”).
SEI Investments Canada Company, a wholly owned subsidiary of SEI Investments Company, is the Manager of the SEI Funds in Canada.
The information contained herein is for general and educational information purposes only and is not intended to constitute legal, tax, accounting, securities, research or investment advice regarding the Funds or any security in particular, nor an opinion regarding the appropriateness of any investment. This commentary has been provided by SEI Investments Management Corporation (“SIMC”), a U.S. affiliate of SEI Investments Canada Company. SIMC is not registered in any capacity with any Canadian regulator, nor is the author, and the information contained herein is for general information purposes only and is not intended to constitute legal, tax, accounting, securities, or investment advice, nor an opinion regarding the appropriateness of any investment. You should not act or rely on the information contained herein without obtaining specific legal, tax, accounting and investment advice from qualified professionals. This information should not be construed as a recommendation to purchase or sell a security, derivative or futures contract. You should not act or rely on the information contained herein without obtaining specific legal, tax, accounting and investment advice from an investment professional. This material represents an assessment of the market environment at a specific point in time and is not intended to be a forecast of future events, or a guarantee of future results. There is no assurance as of the date of this material that the securities mentioned remain in or out of the SEI Funds.


