SEI is Staying Calm COVID-19 Crisis: Asset Allocation Review
Investors have just come through one of the most challenging quarters in history. The speed of declines in equity markets and the corresponding volatility were unprecedented. Moves in the U.S. Treasury market were also unprecedented and left fixed-income markets in uncharted territory. Prices for crude oil flat out collapsed. There were few places to hide, and most of the areas favoured by active investment managers like SEI were hit the worst.
We always preach the values of well-diversified portfolios with balanced risks across a wide range of sources. Over full market cycles (a bull market, a bear market and return to a bull market), which can sometimes run a decade or longer, we are highly confident in this approach. Of course when crisis strikes, as COVID-19 has, even the best laid plans can falter over short-time intervals. With that in mind, we do not believe that now is the time to make panicked, rash investment decisions. Accordingly, we aren’t going to make any strategic asset allocation decisions based on a few weeks or months of performance. That stated, we believe it may be helpful to review the first quarter from an asset allocation perspective.
Asset Allocation Principle: More Diversified Equity Exposures
Implementation: Small Cap, Emerging Market Equity, Reduced equity home country bias
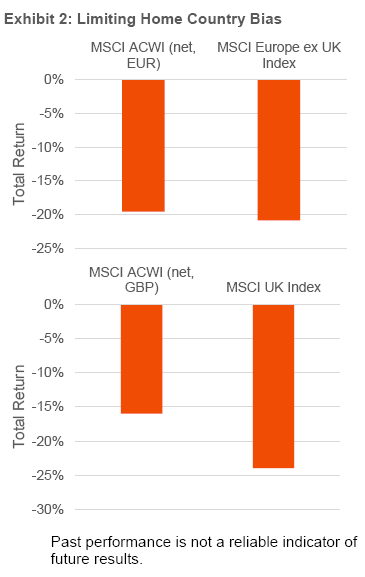
Performance discussion: As equity market returns were dominated by large companies, particularly in the U.S. technology space, more diversified exposures lagged concentrated U.S. or developed market large-cap indices. Global small cap (as measured by the MSCI ACWI Small Cap Index, net in USD) underperformed global large cap (as represented by the MSCI ACWI Index, net in USD) by nearly 9% in the first quarter. Emerging markets (as measured by the MSCI Emerging Markets Index, net in USD) underperformed developed markets (as measured by the MSCI World Index, net in USD) by over 2.5% during the quarter. Home country bias was a mixed bag: it benefited investors whose home markets outperformed (such as the U.S.) while detracting for investors whose markets lagged (such as the U.K. and Europe).
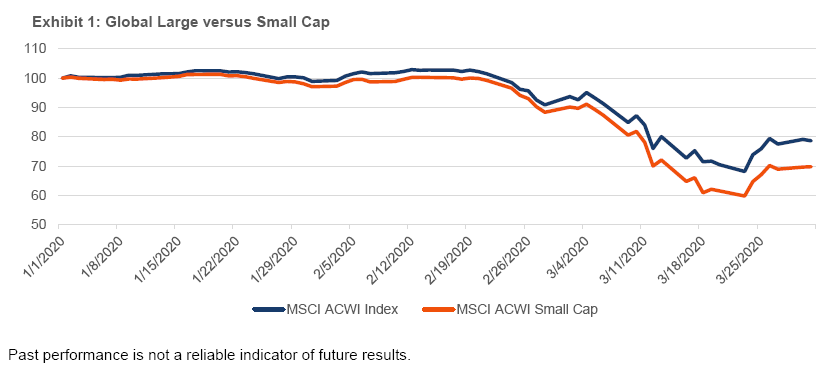
Strategy-level impact: Assuming a 6% allocation to small cap (roughly 10% of the 60% held in equities within a 60/40-like portfolio), this would have detracted 50 to 60 basis points relative to an all-large-cap implementation. Assuming a similarly-sized allocation to emerging-market equities, that exposure would have reduced returns by roughly 15 basis points. The effect of home country bias will vary both in direction and size depending on the investor’s home country and the magnitude of the bias.
Why this is an important strategic holding in our Strategies: Even though we try to limit our Strategies’ concentration in equity risk, equities remain a major driver of portfolio risk and return. Consequently, we seek to diversify our equity holdings as much as possible. Failing to do so would expose Strategies to unnecessary risk without being potentially rewarded with higher expected returns. Small-cap and emerging-market equities are integral components of the global capital markets and offer the potential for both higher returns and diversification relative to developed large-cap markets. Global diversification (as opposed to the heavy home country bias implemented by some of our peers) seeks to minimise exposure to any single country, economy or geopolitical situation. By spreading our Strategies’ equity risk across the globe, we are able to harvest long-term growth in equity markets without undue exposure to individual countries where markets are often dominated by a few issuers or sectors. Again, this diversification is designed to maximise expected return at any given level of risk.
Asset Allocation Principle: Use of Low-Volatility Equity
Implementation: Global Managed Volatility
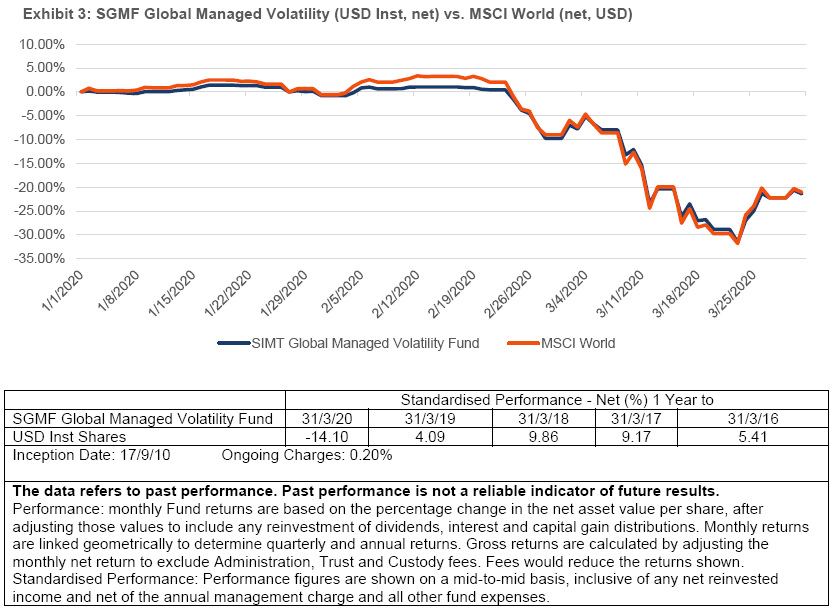
Performance Discussion: Given the low-beta nature of managed volatility, we generally expect it to outperform in sharp equity market downturns. In the first quarter of 2020, however, low-volatility equities declined more than would be expected in such a sell-off.
Global Managed Volatility outperformed its benchmark more modestly than we would generally expect in such an environment. This performance is explained by a few unusual phenomena—namely, the dramatic underperformance of small-cap stocks (managed volatility is diversified across the size spectrum, whereas the benchmarks are concentrated in larger names) and the dominance of mega-cap U.S. technology companies. As the technology sector is not generally characterised by low volatility, it is a much larger portion of the full-beta benchmark than of the managed volatility funds. So, when technology outpaces every other sector, managed volatility can lag.
Strategy-level impact: Our impact analysis compares the managed volatility fund to a 70%/30% combination of equities and cash given the fund’s lower expected equity beta. Assuming a 25% allocation to managed volatility, this implementation accounted for up to 150 to 175 basis points of reduced performance relative to the hypothetical portfolio 70/30 beta proxy (as measured by the MSCI World - Net and the ICE BofAML 3-month Treasury Bill Indexes) during the quarter.
Why this is an important strategic holding in our Strategies: SEI was a pioneer in low volatility investing. We believe that allocating to managed volatility affords our investors similar expected returns with potentially meaningfully lower risk compared to the benchmark market. The cost associated with this potential advantage is tracking error: in order to harvest the benefits of managed volatility, investors must be comfortable with these funds behaving differently than cap-weighted benchmarks, including the potential for periods of large outperformance and underperformance. Given the consistency with which managed volatility has cushioned losses during other market declines and the fact that the risk reduction did not come at the cost of materially lower returns, we believe that the trade-off between improved risk-adjusted returns and higher tracking error remains attractive.
Asset Allocation Principle: A Modest Amount of Inflation Protection
Implementation: Inflation-Linked Bonds, Commodities
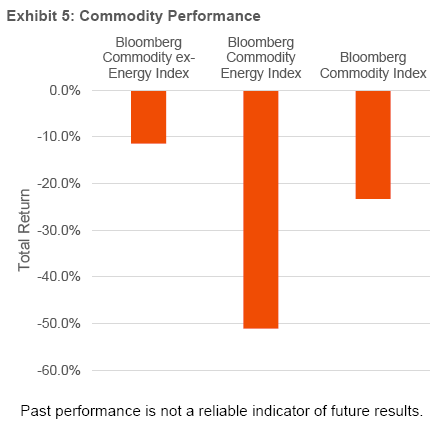
Performance discussion: Inflation-sensitive assets (including both inflation-linked bonds and commodities) suffered substantially during the quarter as inflation expectations cratered. While some level of decline is to be expected as aggregate demand fell due to virus containment measures, this period was highly unusual in that this demand destruction was accompanied by adverse supply moves. Somewhat paradoxically, in the face of plummeting oil prices, Saudi Arabia and Russia entered a price war in early March, exacerbating the downward pressure on oil and other inflation-sensitive assets as they flooded markets with excess oil. Global inflation-linked bonds underperformed nominal bonds by over 300 basis points over the quarter, while the Bloomberg Commodity Index declined by over 23%.
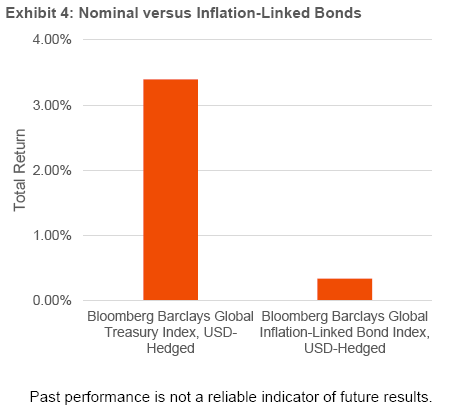
Strategy-level impact: Assuming a 5% allocation to inflation-linked bonds, this holding would have detracted roughly 15 basis points compared to a portfolio of nominal bonds.
Attribution for commodities is somewhat more complicated. While they are as or more volatile than equities, they do not correlate perfectly with equities and therefore can be “funded” from a combination of equities and bonds without increasing portfolio risk. Assuming a 3% allocation to commodities and comparing strictly to global equities, commodities only detracted about 5 basis points at the portfolio level. At the same 3% allocation but comparing commodities to a portfolio consist of 75% equities and 25% global bonds, they detracted roughly 20 to 25 basis points at the portfolio level.
Why this is an important strategic holding in our Strategies: Most traditional “stock/bond” portfolios carry little to no inflation protection. Accordingly, an unexpected spike in inflation may result in unsatisfactory real (inflation-adjusted) returns. It is clear that nominal bonds, with their fixed coupon and principal payments, are subject to the risk that unexpected inflation will erode their purchasing power over time. Less obvious, but at least as meaningful, is the sensitivity of equity prices to unexpected inflation shocks. Central banks around the globe agree that inflation poses a threat to real economic activity and, by extension, to corporate profits and equity returns. Because the goal of an investment portfolio is to support spending at some future time, the risk that the value of that spending will be eroded by inflation is real and relevant. Consequently, we seek more meaningful exposure to inflation-sensitive assets than certain peers and more naïve approaches.
Asset Allocation Principle: Credit Exposure, Funded From Both Stocks and Bonds
Implementation: High Yield Bonds, Emerging Market Debt
Performance discussion: Non-investment-grade credit experienced substantial losses in the quarter as economic activity plummeted and yield spreads between investment-grade and non-investment grade bonds skyrocketed. Asset classes such as high yield and emerging-market debt, although they pay fixed coupons like traditional fixed income, are highly exposed to the economic cycle like equity. As such, we view them as “hybrid” asset classes consisting of both equity and fixed income exposure, and our allocations to them reflect this perspective. While this framework benefited our Strategies compared to funding such allocations strictly from investment-grade bonds (which performed far better), credit exposure nevertheless detracted from portfolio returns over the quarter. Using a 50/50 combination of global equities (MSCI ACWI Index – Net) and global fixed income (Bloomberg Barclays Global Aggregate Index – USD hedged) as a “hybrid” proxy, both high yield and emerging market debt lagged this reference portfolio during the quarter.
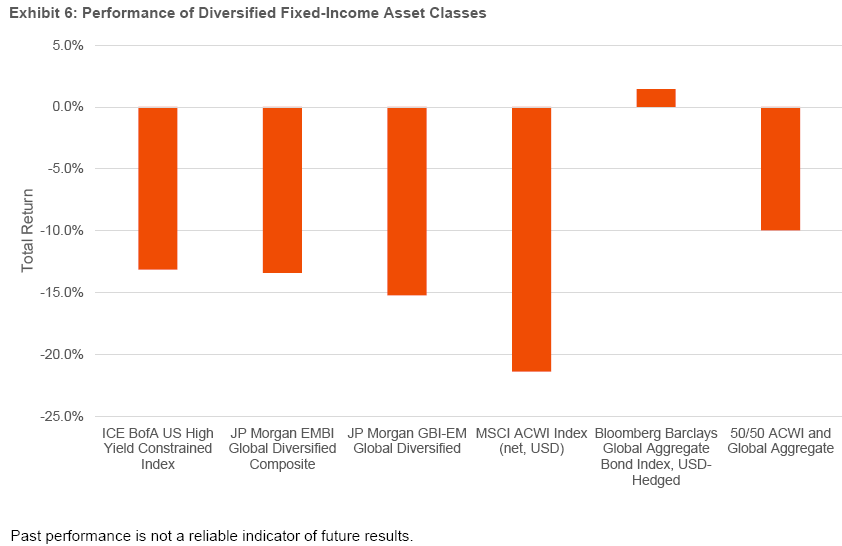
Strategy-level impact: Assuming a 5% allocation to high yield, this would have detracted roughly 15 to 25 basis points at the portfolio level compared to the 50/50 hybrid proxy, depending on the portfolio’s currency perspective. Compared to this same proxy, a 5% allocation to emerging market debt (split evenly between external and local-currency debt) would have detracted roughly 20 to 25 additional basis points.
Why this is an important strategic holding in our Strategies: High-yield and emerging-market debt offer higher expected returns than investment-grade bonds as compensation for both credit and liquidity risk. While these risks do relate to risks in other portions of the portfolio (namely, equities), they are not perfectly correlated, meaning these exposures should offer valuable diversification benefits in the context of a total portfolio. Our exposures to high-yield and emerging-market debt, while relatively modest, contribute positively to overall expected portfolio risk-adjusted returns.
Index Definitions
Bloomberg Commodity ex-Energy Index: The index is a sub-index of the Bloomberg Commodity Index and excludes the energy components of that index.
Bloomberg Commodity Index: The index is calculated on an excess return basis and reflects commodity futures price movements. The index rebalances annually weighted 2/3 by trading volume and 1/3 by world production and weight-caps are applied at the commodity, sector and group level for diversification. Roll period typically occurs from 6th-10th business day based on the roll schedule.
Bloomberg Commodity Energy Index: The index is composed of futures contracts on crude oil, heating oil, unleaded gasoline and natural gas. It reflects the return of underlying commodity futures price movements only and is quoted in USD.
Bloomberg Barclays Global Aggregate Bond Index (USD Hedged): The index is an unmanaged market-capitalization-weighted benchmark, tracks the performance of investment-grade fixed-income securities denominated in 13 currencies. The Index reflects reinvestment of all distributions and changes in market prices.
Bloomberg Barclays Global Inflation-Linked Bond Index (USD Hedged): The index measures the investment-grade, government inflation-linked debt from 12 different developed market countries. Investability is a key criterion for inclusion of markets in this index, and it is designed to include only those markets in which a global government linker fund is likely and able to invest.
Bloomberg Barclays Global Treasury Index (USD Hedged): The index tracks fixed-rate, local currency government debt of investment grade countries, including both developed and emerging markets. The index represents the treasury sector of the Global Aggregate Index and contains issues from 37 countries denominated in 24 currencies.
Bloomberg Barclays U.S. Aggregate Bond Index (USD Hedged): The Index is a benchmark index composed of U.S. securities in Treasury, government-related, corporate and securitized sectors. It includes securities that are of investment-grade quality or better and have at least one year to maturity.
ICE BofA US High Yield Constrained Index: The index is a market-value weighted index of all domestic and Yankee high-yield bonds, including deferred interest bonds and payment-in-kind securities. Its securities have maturities of one year or more and a credit rating lower than BBB-/Baa3 but are not in default.
JP Morgan EMBI Global Diversified Index: The index tracks the performance of external debt instruments (including U.S. dollar-denominated and other external-currency-denominated Brady bonds, loans, eurobonds and local-market instruments) in the emerging markets.
JP Morgan GBI-EM Global Diversified Index: The index tracks the performance of debt instruments issued in domestic currencies by emerging-market governments.
MSCI ACWI Index: The index is a market-capitalization-weighted index composed of over 2,000 companies, and is representative of the market structure of 48 developed and emerging-market countries in North and South America, Europe, Africa and the Pacific Rim. The index is calculated with net dividends reinvested in U.S. dollars.
MSCI Emerging Markets Index: The index is a free float-adjusted market-capitalization-weighted index designed to measure the performance of global emerging-market equities.
MSCI USA Index: The index is designed to measure the performance of the large- and mid-cap segments of the U.S. market.
MSCI World Index: The index is a free float-adjusted market-capitalization-weighted index designed to measure the equity market performance of developed markets. The Index consists of the following 23 developed-market country indexes: Australia, Austria, Belgium, Canada, Denmark, Finland, France, Germany, Hong Kong, Ireland, Israel, Italy, Japan, Netherlands, New Zealand, Norway, Portugal, Singapore, Spain, Sweden, Switzerland, the U.K. and the U.S.
Russell 2000 Index: The index includes 2000 small-cap U.S. equity names and is used to measure the activity of the U.S. small-cap equity market.
Russell 3000 Index: The index measures the performance of the largest 3000 U.S. companies representing approximately 98% of the investable U.S. equity market.
S&P 500 Index: The index is a market-capitalization-weighted index that consists of 500 publicly-traded large U.S. companies that are considered representative of the broad U.S. stock market.
Glossary of Terms
Bear Market: A bear market refers to a market environment in which prices are generally falling (or are expected to do so) and investor confidence is low.
Beta: Beta is a measure of the volatility, or systematic risk, of a security or a portfolio in comparison to the market as a whole.
Bull Market: A bull market refers to a market environment in which prices are generally rising (or are expected to do so) and investor confidence is high.
Market-cap weighted: A market-cap weighted index is a stock market index whose components are weighted according to the total market value of their outstanding shares.
Standard Deviation: Statistical measure of historical volatility. A statistical measure of the distance a quantity lies from its average value. It is applied to the annual rate of return of an investment, to measure the investment's volatility (risk). Standard deviation is synonymous with volatility, in that the greater the standard deviation the more volatile an investment’s return will be. A standard deviation of zero would mean an investment has a return rate that never varies.
Tracking Error: Quantitative measure of the extent performance of a variable differs or coincides with a benchmark.
Important Information
The opinions and views in this commentary are of SEI only and are subject to change. They should not be construed as investment advice.
Investments in SEI Funds are generally medium- to long-term investments. The value of an investment and any income from it can go down as well as up. Investors may get back less than the original amount invested. Returns may increase or decrease as a result of currency fluctuations. Past performance is not a reliable indicator of future results. Additionally, this investment may not be suitable for everyone. If you should have any doubt whether it is suitable for you, you should obtain expert advice.
The SEI Global Assets Fund Plc, SEI Global Investments Fund Plc, and SEI Global Master Fund Plc (the “SEI Funds”) are structured as open-ended collective investment schemes and are authorised in Ireland by the Central Bank as a UCITS pursuant to the UCITS Regulations. The SEI Funds are managed by SEI Investments, Global Ltd (“SIGL”). SIGL has appointed SEI Investments (Europe) Ltd (“SIEL”), an affiliate of SIGL, (together “SEI”) to provide general distribution services in relation to the SEI Funds either directly or through the appointment of other sub-distributors. The SEI Funds may not be marketed to the general public except in jurisdictions where the funds have been registered by the relevant regulator. The matrix of the SEI fund registrations can be found here seic.com/GlobalFundRegistrations.
No offer of any security is made hereby. Recipients of this information who intend to apply for shares in any SEI Fund are reminded that any such application may be made solely on the basis of the information contained in the Prospectus. This material represents an assessment of the market environment at a specific point in time and is not intended to be a forecast of future events, or a guarantee of future results. This information should not be relied upon by the reader as research or investment advice regarding the funds or any stock in particular, nor should it be construed as a recommendation to purchase or sell a security, including futures contracts.
In addition to the normal risks associated with equity investing, international investments may involve risk of capital loss from unfavourable fluctuation in currency values, from differences in generally accepted accounting principles or from economic or political instability in other nations. Bonds and bond funds are subject to interest rate risk and will decline in value as interest rates rise. High yield bonds involve greater risks of default or downgrade and are more volatile than investment grade securities, due to the speculative nature of their investments. Narrowly focused investments and smaller companies typically exhibit higher volatility. SEI Funds may use derivative instruments such as futures, forwards, options, swaps, contracts for differences, credit derivatives, caps, floors and currency forward contracts. These instruments may be used for hedging purposes and/or investment purposes.
While considerable care has been taken to ensure the information contained within this document is accurate and up-to-date, no warranty is given as to the accuracy or completeness of any information and no liability is accepted for any errors or omissions in such information or any action taken on the basis of this information.
This information is issued by SEI Investments (Europe) Limited, 1st Floor, Alphabeta, 14-18 Finsbury Square, London EC2A 1BR which is authorised and regulated by the Financial Conduct Authority. Please refer to our latest Full Prospectus (which includes information in relation to the use of derivatives and the risks associated with the use of derivative instruments), Key Investor Information Documents and latest Annual or Semi-Annual Reports for more information on our funds. This information can be obtained by contacting your Financial Adviser or using the contact details shown above. SEI sources data directly from FactSet, Lipper, and BlackRock, unless otherwise stated.


