SEI Forward
Faster, Higher, Stronger!
The Paris Olympics are due to kick off later this month, and athletes from around the world will gather to compete under the traditional Latin motto of “Citius, Altius, Fortius” or “Faster, Higher, Stronger.” This edition of Forward will look at the current state of capital markets through the lens of the Olympic maxim.
Faster!
While the winners of the 100-meter dash will be crowned the world’s fastest man and woman, in markets, nothing kept up with the price action of Nvidia. Data from Bloomberg shows that the center of artificial intelligence (AI) mania added nearly $1 trillion to its market value in the fastest time ever. The chip-maker’s market capitalization rose from $2.26 trillion on May 9 to a hefty $3.25 trillion just 30 trading days later. For context, Nvidia added more than the value of Berkshire Hathaway to its market value in six weeks. The company has grown by over $1.8 trillion (roughly the market value of Amazon) in 2024. The dominance of Nvidia and a few other mega-cap names has quelled hopes of a broader equity market rally.
While the S&P 500 Index closed out a solid quarter up over 4% and has delivered strong year-to-date performance of over 15%, performance statistics from MSCI show that most other developed equity markets (including Japan, Hong Kong Canada, Germany, France and more) delivered negative performance for the quarter and have fallen even further behind year to date as the big got bigger.
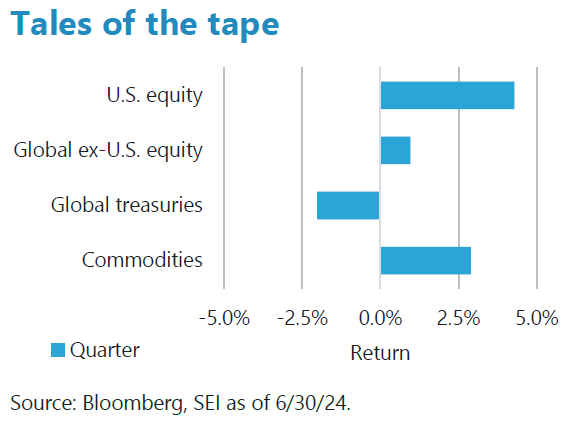
Notables for the quarter
- Global small cap -2.5% in 2Q: Not all risk is “on.”
- NVDA +144% year to date vs Equal Weight S&P 500 +5% year to date: First it was the Magnificent Seven. Then it was the Fab Four. Now, a single stock is driving most of the gains in the S&P 500.
- U.S. 10-Year Treasury yield at 4.36%: Staying up despite rate cut expectations.
We continue to view both concentration and valuation as concerning for U.S. equity investors. We believe the current size and future growth expectations of the top names set the bar exceedingly high even for the most stellar companies in the most transformative industries. In addition, while we have been highlighting the relatively low level of broad equity volatility for the better part of a year, we are also focusing on the high level of volatility present specifically in the market’s biggest names. The CBOE Volatility Index or VIX is a forward-looking view of volatility derived from 30-day S&P 500 options. The VIX closed the month at roughly 12.50% which is significantly under the longer-term average of about 16%. The same measure of implied volatility for Nvidia is roughly 4 times the VIX level, at over 50% according to Bloomberg. Certainly it makes sense for single name volatility to be higher than the market level; however, when one of the biggest companies in the world is trading with such high levels of volatility, this suggests to us that a bumpier ride may be in store for equity investor in the second half of 2024.
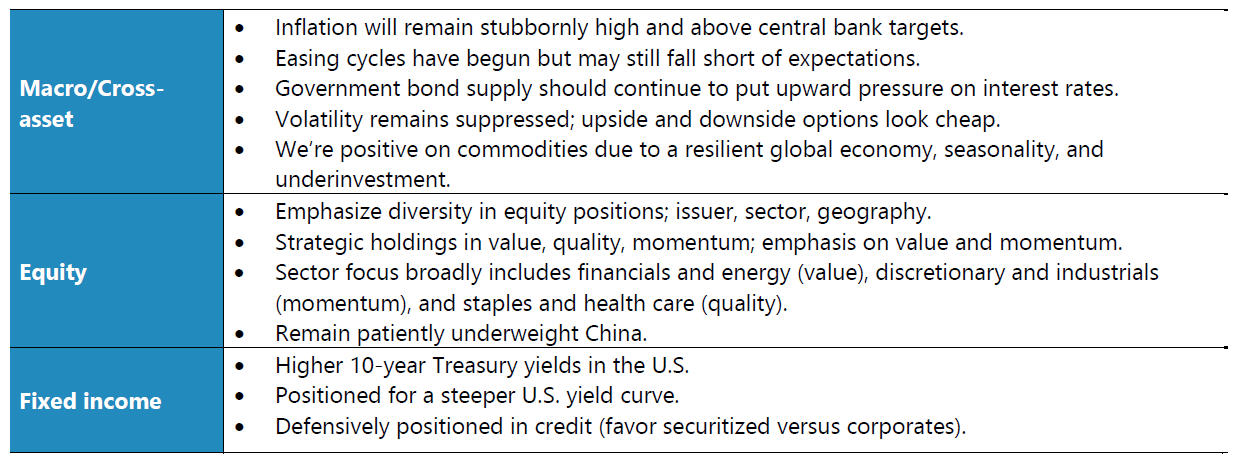
Today’s equity market dynamics remind us that diversifying exposures across geographies, sectors, factors and individual companies are as important as ever for investors, and we remain committed to this foundational principle. This is particularly acute for passive investors who, at this stage of the cycle (concentrated and expensive), may want to begin diversifying into actively managed strategies. Speaking of actively managed strategies, as we embark on the third quarter of 2024, we continue to emphasize our preferred factors of value, quality, and momentum with a particular emphasis on value names and sectors. Value spreads—or the difference between cheap and expensive stocks—remain extremely wide and represent a compelling opportunity. From a sector lens, our value exposures tends to favor financials, energy and materials, our momentum exposure leans into Industrials, while our quality exposure tends to be concentrated in consumer staples.
Higher!
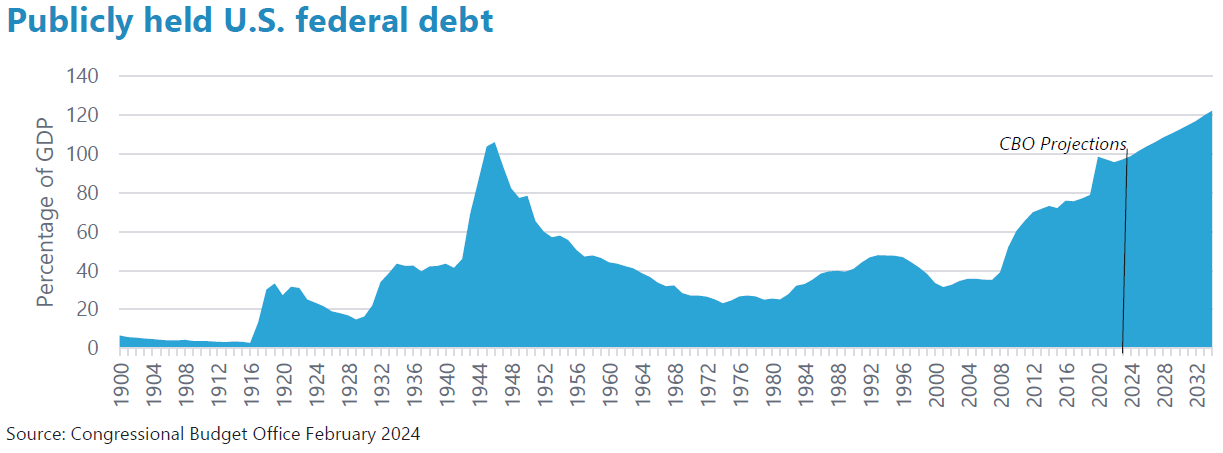
If government debt were an Olympic event, the U.S. would take home the gold. As the second quarter was coming to a close, the U.S. Congressional Budget Office (CBO), a non-partisan agency charged with providing the U.S. Congress with budget analysis, released an update to its 2024 forecasts. The numbers were sobering. The CBO projected that the U.S. budget deficit will reach just under $2 trillion for fiscal year 2024, up $400 billion since their last estimate in February. Simply put, government spending continues to outpace revenues, at an increasing rate, despite a relatively robust economy. Total debt is projected to hit 99% of gross domestic product (GDP) this year before growing to 122% of GDP by 2034—the highest level in U.S. history. Mandatory spending on entitlement programs remains the lion’s share of Federal outlays; however, interest costs on the ballooning debt are forecast to reach the highest level in recorded history and outpace defense spending for the first time starting in 2025. Rising debt is not unique to the U.S., of course, as other developed nations—most notably Japan, but also France and Italy—have similar, if not worse, debt issues. Still, the dramatic post-COVID, pro-cyclical debt dynamics of the U.S. leave it alone at the top of the podium.
These dynamics surely play a role in our outlook for interest rates in the U.S., which is decidedly bearish. The yield on the U.S. 10-year Treasury started off the quarter with upward pressure from consecutive hot inflation prints and stronger- than-expected employment data. A slight softening in the inflation trend and a more dovish tone from the U.S. Federal Reserve (Fed) allowed the 10-year Treasury yield to end the quarter at 4.36%, down roughly 30 basis points from the quarter’s high point. We are leaning against this more recent rally and continue to position for higher longer-term U.S. interest rates. We expect that a still stubborn inflationary picture in the near term and a resilient job market will keep the Fed on hold until at least after the presidential election in November. While we also acknowledge that the Fed is desperate to join Canada, Europe, Switzerland and Sweden (which have already begun lowering rates), we continue to suspect that the specter of a reacceleration of inflation will keep any U.S. easing cycle, relatively shallow. In addition to a higher-than-expected terminal policy interest rate, we continue to see a resilient U.S. economy despite some early warning signs of economic weakness, a return of the term premium (with investors earning higher interest on long-term debt) into the U.S. yield curve, and the basics of supply and demand keeping upward pressure on longer-term rates into year-end.
Stronger!
We expect a positive cyclical and structural macro environment to prompt a strong recovery in commodities for the second half of 2024. The asset class peaked in mid-2022 along with global inflation rates and has suffered as the dis-inflation trend took hold around the globe. More recently we have seen surprising production discipline from OPEC+, AI-influenced demand, and central bank gold purchases influencing year-to-date returns. We believe seasonality factors will add to the positive momentum in this space as summer travel demand remains robust and weather related volatility provides asymmetric upside pressures. In addition, July also marks the start of China’s Third Plenum of Central Committee, which is the top governing body of the Communist Party. Expectations for this gathering include infrastructure reforms and stimulus projects focused on power grid improvements. We view this as another potential boost to demand in the short term which further enhances our longer-term views of global chronic underinvestment in the Commodity space which we believe will continue to act as a structural tailwind.
Summary views
Indexes
Tales of the tape: U.S. equity: S&P 500 Index; global ex-U.S. equity: MSCI ACWI ex-U.S. Index; global Treasuries: Bloomberg Global Treasury Index; Commodities: Bloomberg Commodity Index; Japanese equities: Nikkei 225 Index; Global small cap: MSCI World Small Cap Index (Net) (USD).
Indexes definitions
The Bloomberg Commodity Index comprises futures contracts and tracks the performance of a fully collateralized investment in the index. This combines the returns of the index with the returns on cash collateral invested in 13-week (three-month) U.S. Treasury bills.
The Bloomberg Global Treasury Index tracks fixed-rate, local currency government debt of investment grade countries, including both developed and emerging markets.
The MSCI China Index tracks the performance of large- and mid-cap stocks in China. The index’s 151 constituents, comprise about 85% of the China equity universe.
The MSCI World Small Cap Index (Net) (USD) tracks small-cap stocks across 23 Developed Markets countries. With more than 4,100 constituents, it covers approximately 14% of the free float-adjusted market capitalization in each country.
The Nikkei 225 Index, or the Nikkei Stock Average, more commonly called the Nikkei or the Nikkei index, is a stock market index for the Tokyo Stock Exchange.
The S&P 500 Index is a market-weighted index that tracks the performance of the 500 largest publicly traded U.S. companies and is considered representative of the broad U.S. stock market.
The MSCI ACWI ex USA Index tracks the performance of both developed-market and emerging market countries, excluding the United States.
The CBOE Volatility Index (VIX) measures the constant 30-day volatility of the U.S. stock market using real-time, mid-quote prices of S&P 500 Index call and put options. A call option gives the holder the right to buy a stock at a specified price; a put option gives the holder the right to sell a stock at a specified price.
Glossary
Gross domestic product (GDP) is the total monetary or market value of all the goods and services produced in a country during a certain period.
Momentum is a trend-following investment strategy that is based on acquiring assets with recent improvement in their price, earnings, or other relevant fundamentals.
Quality comprises a long-term buy-and-hold strategy that is based on acquiring shares of companies with strong and stable profitability with high barriers of entry (factors that can prevent or impede newcomers into a market or industry sector, thereby limiting competition).
Risk assets, such as equities, commodities, high-yield bonds, real estate, and currencies, carry a degree of risk and generally are subject to significant price volatility.
Value is an investment strategy that is based on acquiring assets at a discount to their fair valuations. Mean reversion is a theory that prices and returns eventually move back towards their historical average.
Important information
Index returns are for illustrative purposes only and do not represent actual investment performance. Index performance returns do not reflect any management fees, transaction costs or expenses. Indexes are unmanaged, and one cannot invest directly in an index. Past performance does not guarantee future results.
This material represents an assessment of the market environment at a specific point in time and is not intended to be a forecast of future events or a guarantee of future results.
Statements that are not factual in nature, including opinions, projections and estimates, assume certain economic conditions and industry developments and constitute only current opinions that are subject to change without notice. Nothing herein is intended to be a forecast of future events, or a guarantee of future results.
Certain economic and market information contained herein has been obtained from published sources prepared by other parties, which in certain cases have not been updated through the date hereof. While such sources are believed to be reliable, neither SEI nor its affiliates assumes any responsibility for the accuracy or completeness of such information and such information has not been independently verified by SEI.
There are risks involved with investing, including loss of principal. The value of an investment and any income from it can go down as well as up. Investors may get back less than the original amount invested. Returns may increase or decrease as a result of currency fluctuations. Past performance is not a reliable indicator of future results. Investment may not be suitable for everyone.
This material is not directed to any persons where (by reason of that person's nationality, residence or otherwise) the publication or availability of this material is prohibited. Persons in respect of whom such prohibitions apply must not rely on this information in any respect whatsoever.
The information contained herein is for general and educational information purposes only and is not intended to constitute legal, tax, accounting, securities, research or investment advice regarding the strategies or any security in particular, nor an opinion regarding the appropriateness of any investment. This information should not be construed as a recommendation to purchase or sell a security, derivative or futures contract. You should not act or rely on the information contained herein without obtaining specific legal, tax, accounting and investment advice from an investment professional.
The views contained herein are not to be taken as advice or a recommendation to buy or sell any investment in any jurisdiction. Our outlook contains forward-looking statements that are judgments based upon our current assumptions, beliefs and expectations. If any of the factors underlying our current assumptions, beliefs or expectations change, our statements as to potential future events or outcomes may be incorrect. We undertake no obligation to update our forward-looking statements.
The opinions and views in this commentary are of SIEL only and are subject to change. They should not be construed as investment advice.
This information is issued by SEI Investments (Europe) Limited (SIEL) 1st Floor, Alphabeta, 14-18 Finsbury Square, London EC2A 1BR, United Kingdom. SIEL is authorised and regulated by the Financial Conduct Authority (FRN 191713).
This commentary is intended for information purposes only and the information in it does not constitute financial advice as contemplated in terms of the Financial Advisory and Intermediary Services Act.
SEI sources data directly from FactSet, Lipper, and BlackRock unless otherwise stated.
The contents of this document have not been reviewed by any regulatory authority in Hong Kong. You are advised to exercise caution in relation to the offer. If you are in any doubt about any of the contents of this document, you should obtain independent professional advice.
This document has not been registered by the Registrar of Companies in Hong Kong. In addition, this document may not be issued or possessed for the purposes of issue, whether in Hong Kong or elsewhere, and the Shares may not be disposed of to any person unless such person is outside Hong Kong, such person is a “professional investor” as defined in the Ordinance and any rules made under the Ordinance or as otherwise may be permitted by the Ordinance.
This information is made available in Latin America, the Middle East, the Nordics, and Australia FOR PROFESSIONAL (non-retail) USE ONLY by SIEL.
Any questions you may have in relation to its contents should solely be directed to your Distributor. If you do not know who your Distributor is, then you cannot rely on any part of this document in any respect whatsoever.
SIEL is not licensed under Israel’s Regulation of Investment Advising, Investment Marketing and Portfolio Management Law, 5755- 1995 (the “Advice Law”) and does not carry insurance pursuant to the Advice Law. No action has been or will be taken in Israel that would permit a public offering or distribution of the SEI Funds mentioned in this email to the public in Israel. This email and any of the SEI Funds mentioned herein have not been approved by the Israeli Securities Authority (the “ISA”).
Issued in South Africa by SEI Investments (South Africa) (Pty) Limited FSP No. 13186 which is a financial services provider authorised and regulated by the Financial Sector Conduct Authority (FSCA). Registered office: 3 Melrose Boulevard, 1st Floor, Melrose Arch 2196, Johannesburg, South Africa.


