SEI Forward
Writing my first Forward of 2024 less than two weeks since the start of spring, I find myself focusing on new beginnings, or better yet, starting points. In short, starting points matter—in life, in business, and in markets. In that vein, I’d like to reflect on a few starting points as we embark on a new season and a new quarter.
U.S. equities are starting from a high point
Firstly, U.S. equity investors are starting from what can only be described as elevated levels. The S&P 500 Index currently trades at a forward price-to-earnings (P/E) ratio of 21. That is well above the historical average of roughly 16 and a good distance away from the rest of the world at just under 14. While it is true that equity performance has broadened thus far in 2024—Japanese equities are enjoying a strong rally and the “Magnificent Seven” are ending their run in favor of the “Fab Four” or maybe the “Terrific Trio”— quite a bit of good news is already priced into the U.S. market. Starting from here, the bar has been set fairly high for earnings to outperform expectations and drive prices higher. We acknowledge that P/E multiples can still expand from these heights, especially if they’re helped along by a pivot to easier monetary policy via interest rates cuts from the Federal Reserve (Fed).
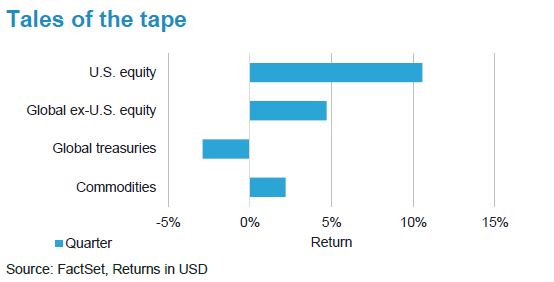
Notables for the quarter
- Japanese equities +21.54%: End of negative interest rates, undervalued currency
- U.S. crude oil +15.66%: Resilient demand, limited supply, geopolitical tensions, and an inflation hedge
- Apple -10.93%, Tesla -29.25%: Some of the Magnificent Seven haven’t been so magnificent
- U.S. Ten-year Treasury yield 4.20%: Longer term yields have been moving higher during the quarter
Central banks change course
Speaking of pivots and policy, the second quarter of 2024 will most likely see the start of new interest-rate cycles from global central banks. A recession in the core of Europe and a close call in the U.K. are clear reasons to consider stimulus despite potentially firming growth and generally above-target inflation rates. Japan has (finally) pivoted in the opposite direction, lifting rates for the first time in 17 years and exiting a negative policy rate regime as inflation and economic growth remain relatively strong. Regarding the U.S., policy-makers will likely join Europe and the U.K. in pivoting to rate cuts in spite of solid gross domestic product (GDP) growth, historically low unemployment, and inflation, which remains stubbornly well above target levels. The Federal Open Market Committee seems to think that the current economic backdrop in the U.S. is the perfect starting point for additional monetary stimulus. Readers should consider us a bit puzzled as we contemplate the potential ramifications of pro-cyclical rate cuts in the U.S.
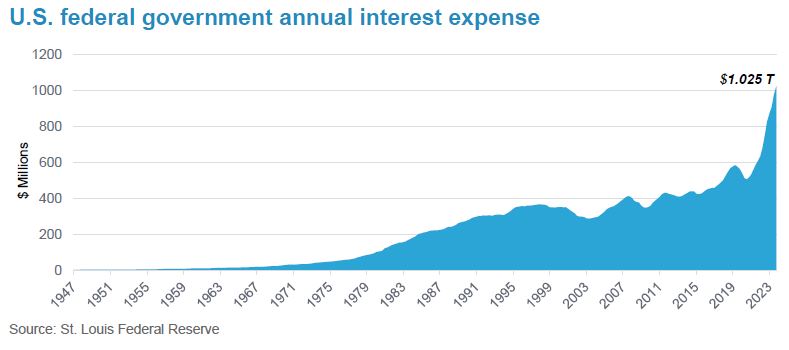
U.S. debt is starting to defy logic
Debt markets deserve our attention as well, particularly in the U.S., as fiscal spending continues unabated in the face of some eye- watering metrics. U.S. government debt has reached $36 trillion as of December 2023, in excess of 120% of GDP, with annual interest costs breaching $1 trillion. That’s $1 trillion, with a “t,” added to the already bloated debt pile, every year, just in interest alone. One would think that would be a good starting point for discussing some austerity measures or some long-term reforms in entitlement programs. Alas, welcome to election year fiscal stimulus. Here we find ourselves thinking about Economics 101 and the basics of supply and demand. There will be no shortage of supply in government debt while demand is, in our view, likely to fall short.
Our portfolios as we start the second quarter
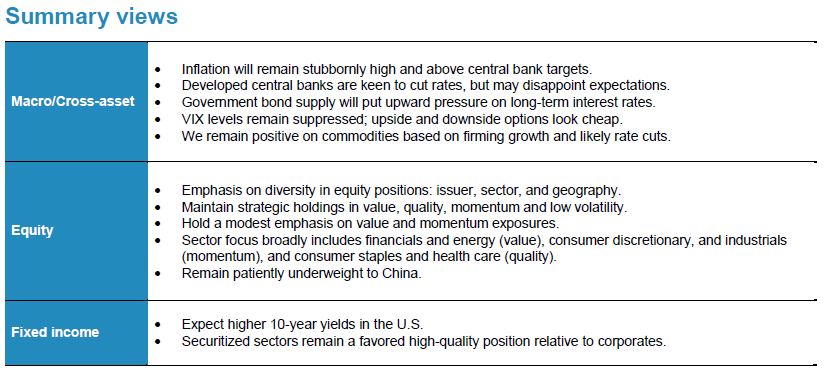
As the second quarter begins, we continue to prefer a more diversified equity posture relative to many developed markets. We seek to achieve this diversification via our preferred focus on high-quality companies with positive earnings momentum and reasonable valuations. We retain a slight preference for value names in U.S. large cap and a modest emphasis on value and momentum across our broader equity complex. From a sector perspective, preferred factor exposures and managers’ stock selection have our portfolios currently leaning into financials and energy (value), consumer discretionary, and industrials (momentum), as well as health care and consumer staples (quality). It is also worth noting that multiple rate cuts are priced in to equity markets across the globe, so while a realization of these cuts may boost risk assets in the near term, any disappointment in stimulus measures could prove challenging. However, we have seen this movie before, as rate-cut expectations in the U.S. have already been halved thus far this year, which has been of no concern to the equity market. We believe the level of rates will be more important than the number of cuts. In other words, if U.S. 10-year Treasury yields revisit 5%, equities may struggle.
On another note, we are also paying some attention to passive investors who, by nature of the strategy, are buyers at any price. For those investors with exclusively passive exposure in U.S. large-cap stocks, the second quarter could be a good starting point to add some active management. We expect an easing in the concentrated nature of the market indexes, which this tends to act as a tailwind for active managers.
To wrap up our views on equity markets, we are compelled to mention the level of implied volatility present in equity option markets. The CBOE Volatility Index (VIX) is the market standard that gives investors a view on the expected volatility of the S&P 500 Index for the next 30 days. The VIX has spent the last few months at or near the lowest levels since the pandemic. Given relatively high valuations, uncertainty around Fed monetary policy, a pending U.S. presidential election, and multiple armed conflicts around the globe, we expect higher volatility through the remainder of the year and are positioning ourselves accordingly. Practically, a low VIX means that option positions are, all else being equal, relatively cheap. When insurance is cheap, we tend to be buyers.
Regarding interest rates, in the U.S., we see stubborn inflation, firming growth, low unemployment, and a deluge of supply putting upward pressure on bond yields, specifically in the mid-to-longer end of the yield curve. The U.S. curve has remained inverted (short-term yields exceed long-term yields) for the longest period of time on record. We expect that to change this year, realized through Fed rate cuts (short-term yields falling) and term premium returning (long-term yields rising). Long story short, we are positioned for both a steepening of the U.S. yield curve, as well as higher 10-year U.S. Treasury yields.
Credit spreads remain tight—indicating non-government bonds are fairly expensive—despite some early warning signs in default levels, and we broadly remain defensive in this space. Our investment-grade portfolios continue to find the high-quality yields available in the securitized sectors as the more attractive options in credit. Our high-yield portfolios continue to hold a more bar-belled portfolio, balancing bottom-up opportunities in CCC rated bonds along with higher-quality exposures.
Our view on commodities remains favorable; although, we recently trimmed our position somewhat. Our thesis continues to focus on heightened geopolitical risks, firming economic growth, and the highly likely central bank rate cuts in the short term, along with our longer-term drivers, including structurally higher inflation and chronic underinvestment, particularly in the energy complex.
As always, we thank you for your continued support.
Indexes
Tales of the tape: U.S. equity: S&P 500 Index (net) USD; Global ex-U.S. equity: MSCI ACWI ex-U.S. Index (net) USD; Global treasuries: Bloomberg Global Treasury Index (USD); Commodities: Bloomberg Commodity Index (USD); Japanese equities: Nikkei 225 Index (USD); U.S. crude oil: NYSE Spot West Texas Intermediate Crude Oil (USD).
Indexes definitions
The Bloomberg Commodity Index comprises futures contracts and tracks the performance of a fully collateralized investment in the index. This combines the returns of the index with the returns on cash collateral invested in 13-week (three-month) U.S. Treasury bills.
The Bloomberg Global Treasury Index tracks fixed-rate, local currency government debt of investment grade countries, including both developed and emerging markets.
The Nikkei 225 Index, or the Nikkei Stock Average, more commonly called the Nikkei or the Nikkei index, is a stock market index for the Tokyo Stock Exchange.
The S&P 500 Index is a market-weighted index that tracks the performance of the 500 largest publicly traded U.S. companies and is considered representative of the broad U.S. stock market.
The MSCI ACWI ex USA Index tracks the performance of both developed-market and emerging market countries, excluding the United States.
West Texas Intermediate (WTI) Crude Oil is a light, sweet crude oil that serves as one of the main global oil benchmarks.
The CBOE Volatility Index (VIX) measures the constant 30-day volatility of the U.S. stock market using real-time, mid-quote prices of S&P 500 Index call and put options. A call option gives the holder the right to buy a stock at a specified price; a put option gives the holder the right to sell a stock at a specified price.
Glossary
Momentum is a trend-following investment strategy that is based on acquiring assets with recent improvement in their price, earnings, or other relevant fundamentals.
Quality comprises a long-term buy-and-hold strategy that is based on acquiring shares of companies with strong and stable profitability with high barriers of entry (factors that can prevent or impede newcomers into a market or industry sector, thereby limiting competition).
Risk assets, such as equities, commodities, high-yield bonds, real estate, and currencies, carry a degree of risk and generally are subject to significant price volatility.
Value is an investment strategy that is based on acquiring assets at a discount to their fair valuations. Mean reversion is a theory that prices and returns eventually move back towards their historical average.
Important information
Index returns are for illustrative purposes only and do not represent actual investment performance. Index performance returns do not reflect any management fees, transaction costs or expenses. Indexes are unmanaged, and one cannot invest directly in an index. Past performance does not guarantee future results. This material represents an assessment of the market environment at a specific point in time and is not intended to be a forecast of future events or a guarantee of future results.
Statements that are not factual in nature, including opinions, projections and estimates, assume certain economic conditions and industry developments and constitute only current opinions that are subject to change without notice. Nothing herein is intended to be a forecast of future events, or a guarantee of future results.
Certain economic and market information contained herein has been obtained from published sources prepared by other parties, which in certain cases have not been updated through the date hereof. While such sources are believed to be reliable, neither SEI nor its affiliates assumes any responsibility for the accuracy or completeness of such information and such information has not been independently verified by SEI.
There are risks involved with investing, including loss of principal. The value of an investment and any income from it can go down as well as up. Investors may get back less than the original amount invested. Returns may increase or decrease as a result of currency fluctuations. Past performance is not a reliable indicator of future results. Investment may not be suitable for everyone.
This material is not directed to any persons where (by reason of that person's nationality, residence or otherwise) the publication or availability of this material is prohibited. Persons in respect of whom such prohibitions apply must not rely on this information in any respect whatsoever.
The information contained herein is for general and educational information purposes only and is not intended to constitute legal, tax, accounting, securities, research or investment advice regarding the strategies or any security in particular, nor an opinion regarding the appropriateness of any investment. This information should not be construed as a recommendation to purchase or sell a security, derivative or futures contract. You should not act or rely on the information contained herein without obtaining specific legal, tax, accounting and investment advice from an investment professional.
The views contained herein are not to be taken as advice or a recommendation to buy or sell any investment in any jurisdiction. Our outlook contains forward-looking statements that are judgments based upon our current assumptions, beliefs and expectations. If any of the factors underlying our current assumptions, beliefs or expectations change, our statements as to potential future events or outcomes may be incorrect. We undertake no obligation to update our forward-looking statements.
The opinions and views in this commentary are of SIEL only and are subject to change. They should not be construed as investment advice.
This information is issued by SEI Investments (Europe) Limited (SIEL) 1st Floor, Alphabeta, 14-18 Finsbury Square, London EC2A 1BR, United Kingdom. SIEL is authorised and regulated by the Financial Conduct Authority (FRN 191713).
This commentary is intended for information purposes only and the information in it does not constitute financial advice as contemplated in terms of the Financial Advisory and Intermediary Services Act.
SEI sources data directly from FactSet, Lipper, and BlackRock unless otherwise stated.
The contents of this document have not been reviewed by any regulatory authority in Hong Kong. You are advised to exercise caution in relation to the offer. If you are in any doubt about any of the contents of this document, you should obtain independent professional advice.
This document has not been registered by the Registrar of Companies in Hong Kong. In addition, this document may not be issued or possessed for the purposes of issue, whether in Hong Kong or elsewhere, and the Shares may not be disposed of to any person unless such person is outside Hong Kong, such person is a “professional investor” as defined in the Ordinance and any rules made under the Ordinance or as otherwise may be permitted by the Ordinance.
This information is made available in Latin America, the Middle East, the Nordics, and Australia FOR PROFESSIONAL (non-retail) USE ONLY by SIEL.
Any questions you may have in relation to its contents should solely be directed to your Distributor. If you do not know who your Distributor is, then you cannot rely on any part of this document in any respect whatsoever.
SIEL is not licensed under Israel’s Regulation of Investment Advising, Investment Marketing and Portfolio Management Law, 5755- 1995 (the “Advice Law”) and does not carry insurance pursuant to the Advice Law. No action has been or will be taken in Israel that would permit a public offering or distribution of the SEI Funds mentioned in this email to the public in Israel. This email and any of the SEI Funds mentioned herein have not been approved by the Israeli Securities Authority (the “ISA”).
Issued in South Africa by SEI Investments (South Africa) (Pty) Limited FSP No. 13186 which is a financial services provider authorised and regulated by the Financial Sector Conduct Authority (FSCA). Registered office: 3 Melrose Boulevard, 1st Floor, Melrose Arch 2196, Johannesburg, South Africa.


