Risk Management: Monitoring and Measurement
Our multi-asset risk measurement platform is the hub for monitoring risk at the factor, security, sector, manager, fund and portfolio strategy levels. But what are we actually measuring?
Tracking Error
Benchmark-relative performance (or alpha) is typically associated with measurement of returns, but it also provides a high-level assessment of risk. Tracking error ― by measuring the variability of alpha ― depicts a strategy’s active risk by aggregating all of its active benchmark-relative risk exposures.
Tracking error serves as an important standalone measure in helping to determine whether a strategy’s overall risk exposure is excessive, in line with our guidelines, or too low to support the potential for meaningful excess returns. We construct portfolio strategies and multi-manager funds based on expected tracking error ranges at the fund and manager levels. Results will fall short in terms of risk or return (or both) if these expectations fail to materialise, so tracking error demands close monitoring and adjustment, when warranted.
Contribution to Risk
We explained in our last paper, Risk Management: Governance, Culture and Technology, that our risk model quantifies a set of risk factors ― economic and market variables that help explain the variability of a security’s return ― for every holding in our strategies. Contribution-to-risk (CtR) analysis measures the proportion of risk attributable to individual securities, sectors or factors, and we are able to aggregate security-level risk factors to assess an individual manager’s contribution to the active risk of a multi-manager fund. This gets to the heart of the manager-of-managers approach: CtR portfolio analysis enables us to effectively mitigate a single manager from dominating portfolio risk.
Value at Risk
Tracking error and CtR analysis seek to gauge active or benchmark-relative risk, while value-at-risk (VaR) analysis focuses on total risk. That is, VaR uses standard deviation, a common measure of volatility that depicts the variability of investment returns, to estimate the loss that may be realised by a portfolio for a given probability level and time period.
We use VaR to focus on expected or higher-probability loss; we also measure more extreme loss with lower probabilities. Since these events fit within the tails at the left edge of a probability distribution, we call them expected tail loss, or conditional VaR (with the condition being that they have exceeded normal or expected losses).
Consider an example intended to measure the loss that is not expected to be exceeded over a one-month time horizon with a 95% level of confidence. A portfolio with a one-month VaR of 6% implies that the probability of a loss of 6% or greater over a one-month period is 5%, or 1 in 20.
Like tracking error, we tend to focus on relative VaR, which compares the portfolio’s maximum expected loss against that of its benchmark. Relative VaR is determined by dividing the VaR of the strategy by the VaR of its benchmark. Similar to tracking error, a portfolio’s VaR is computed based on the risk factors identified at the individual security level. We also decompose the benchmark’s constituent securities into a set of risk factors to measure relative VaR.
In order to continuously improve our VaR model integrity, we compare ex-post (historical or backward-looking) measurements with ex-ante (forecasted) measurements. This provides an opportunity to recalibrate and fine tune our underlying assumptions with the goal of improving the model’s output.
Information Ratio
A multi-manager portfolio necessitates sustained focus on the contributions of every manager, since each strategy fulfils a dedicated role that we expect to produce stronger results under some market conditions than others.
The information ratio has often been a go-to measure to satisfy this need. It measures alpha, or returns in excess of a strategy’s benchmark, against tracking error. It also tends to produce noisy data in the sense that the alpha (the signal) tends to be very small relative to tracking error (the noise). Alpha generation consistency also varies ― we expect managers to perform better in some circumstances than others ― and investing is an inherently volatile practice.
Exhibit 1 presents a hypothetical example of how alpha generation might be depicted over time. It can be difficult to determine if a manager is skilful over short time periods since alpha is highly variable.
Exhibit 1: Simulated Excess Monthly Returns
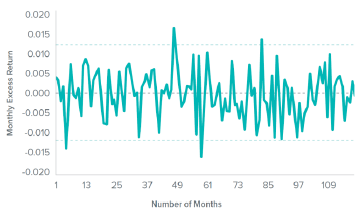
Simulated results are for illustrative purposes only and are not representative of the performance of any specific investment.
CUSUM
In addition to the information ratio, we have adapted CUSUM (short for cumulative sum control chart), a statistical control measure typically used within industrial process settings, to gauge manager alpha generation.
Like the information ratio, a CUSUM control chart enables us to see whether, when, and by how much a manager contributes to benchmark-relative returns. But given that it depicts cumulative excess returns, the chart’s slope over time tells us when a strategy is exceeding its benchmark (upward) or underperforming (downward). A relatively consistent downward slope could indicate a change in the manager’s investment process, the erosion of a manager’s edge, or perhaps just a stretch of adverse market conditions.
Exhibit 2 uses the same data depicted in Exhibit 1, but interpreted with a CUSUM control chart. A trend change is considerably more noticeable.
Exhibit 2: CUSUM Control Chart of Excess Monthly Returns
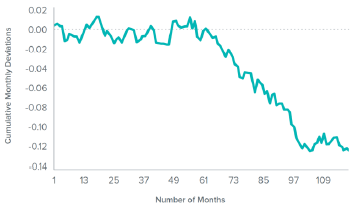
Simulated results are for illustrative purposes only and are not representative of the performance of any specific investment.
As with the other measures we addressed, we have assigned CUSUM control limits for each investment manager derived from their alpha and tracking error assumptions. CUSUM, as a statistical measure, can raise false alarms; if our review confirms that a CUSUM signal is not indicative of a change to the manager’s investment process, then its CUSUM will be reset. However, CUSUM tends to be one of the fastest purely statistical methods for identifying performance breakdowns that result from changes in a manager’s investment process.
CUSUM’s value is most apparent in conjunction with the qualitative analysis conducted by our manager research group. Through an exhaustive evaluation of a manager’s strategy implementation, our analysts can discern if a CUSUM signal indicates a real process breakdown or a just a false alarm.
Scenario Analysis
The risk management team also performs stress tests on portfolios to understand their sensitivity to risk factors and measure the impact of extreme events. These scenarios include, for example, shifts in the yield curve, widened credit spreads, major equity-market declines, spikes in volatility, increased inflation or a decline in the U.S. dollar. We can also simulate liquidity, or market depth, under different conditions to measure changes in the cost of liquidating various amounts of a portfolio.
Consider a scenario in which a rapid decline in oil prices triggered deflationary conditions. Which asset classes would likely be affected, and by how much? Which factors would likely be affected, and where are they present in SEI’s strategies?
Scenario analysis helps us develop forecasts for extreme events, which enables a more thorough interpretation of other measures that we employ. We can see how a set of factors that have little interrelationship under normal conditions suddenly develop high correlations in a shock scenario, which would have implications for CtR analysis. We can also use stress tests to help determine the reliability of a VaR forecast and, if necessary, provide reference points in adjusting limits.
Risk Management: Manager Research
Our series on SEI’s approach to risk management will continue with a paper on manager research (the people, philosophies and processes behind the investment strategies).
We also plan to address the following, in terms of their contributions to risk management, over the coming months:
- Manager due diligence ―systems and controls
- Asset allocation and constructing portfolios
- Balancing risk for goals-based investing
Glossary
Credit spread: Credit spread is the additional yield, usually expressed in basis points (one basis point is 0.01%), that an index or security offers relative to a comparable duration index or security (the latter is often a perceived risk-free credit, such as sovereign government debt). Spread sector generally includes non-government sectors where investors demand additional yield above government bonds for assumed increased risk.
Qualitative: Qualitative refers to analysis based on analyst research and subjective views.
Yield curve: The yield curve represents differences in yields across a range of maturities of bonds of the same issuer or credit rating (likelihood of default). A steeper yield curve represents a greater difference between the yields. A flatter curve indicates the yields are closer together.
Important Information
Past performance is not a guarantee of future performance. Diversification does not ensure a profit or guarantee against a loss.
Investments in SEI Funds are generally medium to long term investments. The value of an investment and any income from it can go down as well as up. Investors may not get back the original amount invested. Additionally, this investment may not be suitable for everyone. If you should have any doubt whether it is suitable for you, you should obtain expert advice.
No offer of any security is made hereby. Recipients of this information who intend to apply for shares in any SEI Fund are reminded that any such application may be made solely on the basis of the information contained in the Prospectus. This material represents an assessment of the market environment at a specific point in time and is not intended to be a forecast of future events, or a guarantee of future results. This information should not be relied upon by the reader as research or investment advice regarding the funds or any stock in particular, nor should it be construed as a recommendation to purchase or sell a security, including futures contracts.
In addition to the normal risks associated with equity investing, international investments may involve risk of capital loss from unfavourable fluctuation in currency values, from differences in generally accepted accounting principles or from economic or political instability in other nations. Bonds and bond funds are subject to interest rate risk and will decline in value as interest rates rise. High yield bonds involve greater risks of default or downgrade and are more volatile than investment grade securities, due to the speculative nature of their investments. Narrowly focused investments and smaller companies typically exhibit higher volatility. SEI Funds may use derivative instruments such as futures, forwards, options, swaps, contracts for differences, credit derivatives, caps, floors and currency forward contracts. These instruments may be used for hedging purposes and/or investment purposes.
While considerable care has been taken to ensure the information contained within this document is accurate and up-to-date, no warranty is given as to the accuracy or completeness of any information and no liability is accepted for any errors or omissions in such information or any action taken on the basis of this information.
This information is issued by SEI Investments (Europe) Limited ("SIEL"), 1st Floor, Alphabeta, 14-18 Finsbury Square, London EC2A 1BR which is authorised and regulated by the Financial Conduct Authority. Please refer to our latest Full Prospectus (which includes information in relation to the use of derivatives and the risks associated with the use of derivative instruments), Key Investor Information Documents and latest Annual or Semi-Annual Reports for more information on our funds. This information can be obtained by contacting your Financial Advisor or using the contact details shown above.
SIEL is the distributor of the SEI UCITS Funds and provides the distribution and placing agency services to the Funds by appointment from the manager of the Funds, namely SEI Investments Global, Limited, a company incorporated in Ireland ("SIGL"). SIGL has in turn appointed SEI Investments Management Corporation ("SIMC"), a US corporation organised under the laws of Delaware and overseen by the US federal securities regulator, as investment adviser to the Funds. SIMC provides investment management and advisory services to the Funds. SIEL, SIGL and SIMC are wholly owned subsidiaries of SEI Investments Company.


