Quarterly Market Commentary: Tale of two halves doesn’t have a happy ending.
A line chart of global equity market performance during the third quarter looks remarkably like a mirror image: climbing higher toward mid-quarter, then tumbling downward thereafter.
The relationship between signs of softening economic activity in late spring and the presumption that it would enable central banks to increase rates by less than feared spurred a rally across equity and fixed-interest markets from June to August. US Federal Reserve (Fed) Chair Jerome Powell shattered this complacency by explaining that lower growth and softer labour markets will likely be the unfortunate costs of hiking rates to fight inflation, and that expectations for a premature pivot to looser policy will probably be disappointed. His remarks sent markets reeling through the end of the quarter.
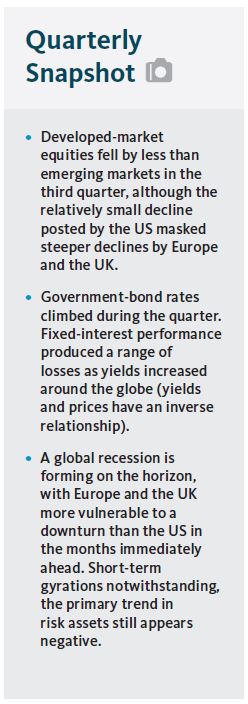
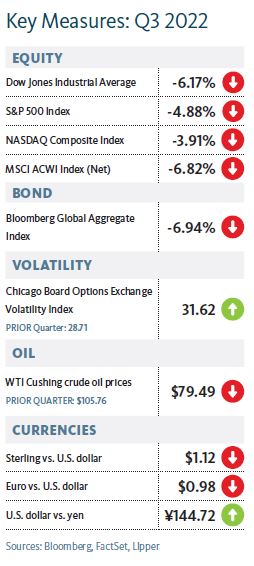
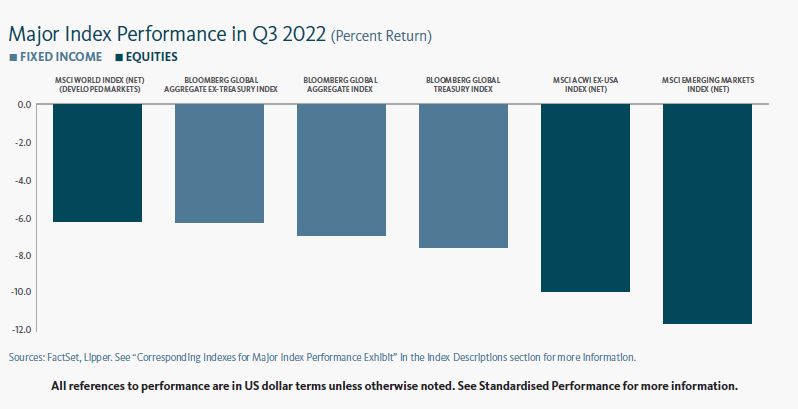
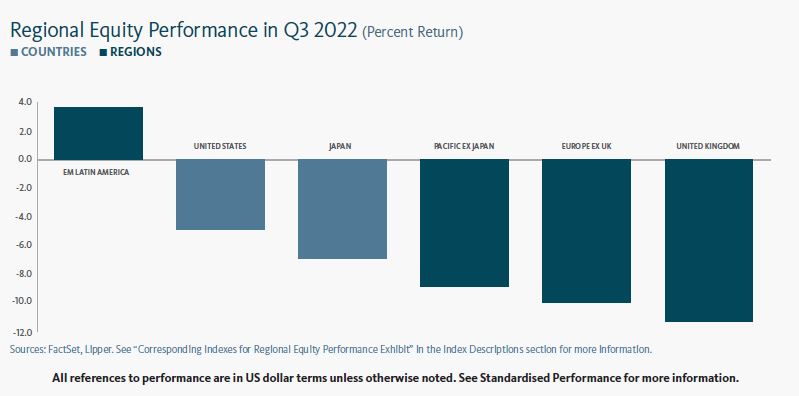
Developed-market equities fell by less than emerging markets during the third quarter, although the relatively small decline posted by the US masked steeper declines by Europe and the UK. Latin American shares had the only positive regional performance for the period, while China and Hong Kong had the steepest declines.
Government-bond rates climbed in the UK, eurozone and US for the full third quarter—declining during July in the UK and eurozone while the US yield curve flattened as short-term rates rose and long-term rates fell; rates then climbed through August and September across all three jurisdictions. The UK and US yield curves grew more inverted (that is, when shorter-term rates are higher than longer-term rates) as the quarter progressed.
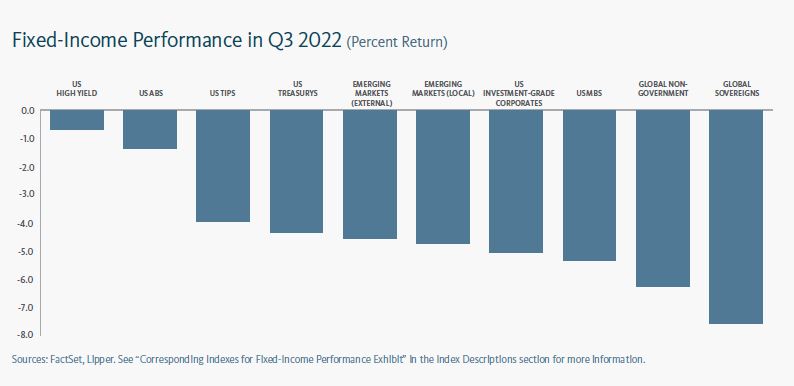
Fixed-interest performance produced a range of losses during the quarter as yields increased around the globe (yields and prices have an inverse relationship). Global government bonds had the deepest losses, while US high-yield bonds had a comparably modest decline.
Commodity markets were mixed during the third quarter. The Bloomberg Commodity Index fell by 4.75% as Brent and West-Texas Intermediate crude-oil prices plummeted 21.91% and 24.84%, respectively. However, natural gas prices jumped 25.60% for the full quarter (including a decline after skyrocketing by 79.59% thru mid-to-late August) and wheat prices increased by 4.24%.
Liz Truss was chosen as leader of the Conservative Party and became UK prime minister in early September, promising tax cuts to stimulate economic growth and relief for mounting electricity bills over the next two years. The tax programme was detailed in a “mini-budget” by Kwasi Kwarteng, the new chancellor of the exchequer, on 23 September. Totalling roughly £45 billion, the tax cuts were perceived as irresponsible; long-term gilt rates spiked to their highest levels in 20 years and sterling fell to its lowest-ever exchange rate versus the US dollar. The disruption strained pension funds, which depend heavily on the long-term gilt market, and forced the Bank of England to offer open-ended gilt purchases to restore order. The new government partially reversed course in early October, announcing that it would scrap its tax-cut plans for top earners.
The German government announced in late September it would nationalise Uniper, a major European electricity producer with heavy dependence on natural gas, after seeking to rescue the company with a recapitalisation in July. At the end of the quarter, Germany announced a €200 billion package intended to cap gas and electricity prices for businesses and consumers amid the energy crisis.
Russia’s pipeline-supplied natural gas flows to Europe via Nord Stream completely ceased by late August. The pipeline and its never-operational counterpart Nord Stream were sabotaged in late September, rendering their future use questionable.
Ukraine mounted a counteroffensive against Russia’s invasion as summer progressed, targeting Kherson in the south and Kharkiv in the east. Its eastern initiative produced a string of successes, enabling defence forces to push south into the northern Donbas region. Russia announced plans to mobilise 300,000 citizens in late September, prompting at least as many draft-eligible Russian men to flee the country. Vladimir Putin also threatened to use nuclear weapons against any outside power that sought to intervene in its invasion of Ukraine. At the end of the quarter, Putin presided over a ceremony to annex four south-east regions of Ukraine based on sham referendums despite limited control over the regions.
Hong Kong concluded its three-day hotel quarantine requirement for foreigners in late September, allowing visitors to travel freely aside from a three-day ban from restaurants, bars, and entertainment venues. Japan also announced looser travel restrictions will begin in early October, with plans to let individual tourists return (as opposed to tour groups), the removal of a cap on daily visitors, and the resumption of visa-free short-term travel. Taiwan entered the fray as well, with plans to end three-day quarantine in October and a return to visa-free entry.
Economic Data
UK
- UK manufacturing activity contracted in August after a few months of softening growth, but the slowdown eased in September.
- UK services sector activity tipped into contraction during September after growing at a modest-to-healthy pace through the summer.
- Broad UK consumer price inflation peaked at 10.1% in the year through July before edging down to 9.9% during August. Core consumer prices, however, continued to accelerate through August, peaking at 6.3% year over year.
- Improvement in the UK claimant count (which calculates the number of people claiming Jobseeker’s Allowance) levelled off during the third quarter—declining by roughly 14,500 from June to July, and then increasing by 6,300 in August—with total claimants holding at 3.9% of the population during the time frame.
Eurozone
- Manufacturing conditions steadily deteriorated in the eurozone during the third quarter. Growth ground to a standstill in July and began to contract modestly through August, before the slowdown accelerated in September.
- Activity in the eurozone services sector contracted during September. Growth in services slowed abruptly beginning in June from a relatively robust pace in May, then continued to cool throughout the third quarter.
- The eurozone consumer price index jumped to 10.0% in September, from 9.1% in August, hitting an all-time high and essentially doubling the inflation rate from the beginning of the calendar year, as consumer prices increased in September at a 1.2% monthly pace.
- Eurozone unemployment held at a 6.6% rate in August for the third straight month, remaining at a record low (since Eurostat began tracking the dataset in 1998).
US
- US manufacturing growth ended with a mild acceleration in September, remaining otherwise modest throughout the third quarter after slowing sharply in June.
- A contraction in US services activity that began in July started to ease back toward breakeven levels at the end of the third quarter.
- The US labour market remained quite healthy during the third quarter. New claims for unemployment benefits declined throughout the quarter, falling back below 200,000 per week in late September for the first time since the spring.
- The US Personal Consumption Expenditures (PCE) Price Index (the Federal Reserve’s preferred inflation gauge) slid to 6.3% in the year through July and 6.2% in August (from 6.8% in June). The core PCE Index, however, climbed to 4.9% in August, its highest level since April, on a monthly increase of 0.6%.
Central Banks
- At its early August meeting, the Bank of England’s (BoE) Monetary Policy Committee hiked its benchmark rate by 0.50%, the largest individual increase in 27 years, and then issued another increase of the same size at its late September meeting, bringing the bank rate to 2.25%.The BoE was compelled to intervene with temporary gilt purchases toward the end of the quarter over concerns about financial stability as long-term rates skyrocketed in response to the new government’s mini-budget.
- The European Central Bank (ECB) increased its three benchmark rates by 0.50% at its July meeting for the first time in 11 years, surprising investors who were expecting hikes of 0.25%.16 At the same meeting, the ECB approved the establishment of a Transmission Protection Instrument (TPI) to ensure the smooth transmission of monetary policy normalisation across eurozone countries. At its early September meeting, the ECB raised rates by 0.75%. ECB President Christine Lagarde emphasized that rates were well below the levels likely needed to get inflation under control and that a few more “large steps” lie ahead.
- The US Federal Reserve’s (Fed) Federal Open Market Committee (FOMC) increased the federal-funds rate by 0.75% toward the end of July, and again in late September, raising the benchmark rate’s target range to 3.0%-3.25%. The central bank also began to accelerate balance sheet reduction in September, doubling the amount of monthly Treasury and mortgage holdings that mature without being replaced to maximum respective paces of $60 billion and $35 billion.
- The Bank of Japan (BOJ) earned the distinction of being the last major central bank with a negative interest-rate target during the third quarter as the ECB began to lift rates.17 Its short-term interest rate remained at -0.1%, and the 10-year Japanese government-bond (JGB) yield target held near 0% at both its July and September meetings. The central bank continued to offer purchases of 10-year JGBs at 0.25% in order to keep its yield within the BOJ’s acceptable range. It also announced its first intervention in currency markets since 1998 to limit the yen’s slide.
SEI’s View
The war in Ukraine and Russia’s energy blackmail against Europe, high global inflation and central banks’ aggressive response to it, and a severe COVID-related slowdown in China are not exactly new; they have simply increased in intensity. Most important, they have forced monetary policy makers to finally admit that they have a major inflation problem on their hands, one that is neither transitory nor likely to be resolved without pain.
In our opinion, investors should be prepared to see a federal funds rate that could exceed 5%. Other central banks are following the Fed’s lead, talking tough and following up with outsized policy-rate increases. In the UK, the bond market has gone haywire and the country’s currency has come under intense downward pressure. To use a newly popular phrase among economists and financial-market participants, things are starting to break.
Europe will continue to be the area most under the gun owing to Russia’s suspension of natural gas exports. Although storage facilities within the European Union are now 80%-to-90% full, the continent still needs to have a steady flow of gas to get through the high-usage winter months.19 Governments may be forced to impose disruptive energy-saving restrictions on businesses and citizens. Heavy users of electricity, from aluminium smelters to glassmakers, have already been shutting down.
The UK’s new Prime Minister, Liz Truss, has rolled out a plan to cap the cost of residential electricity at £2,500 per year over the next 18 months. Along with other measures previously announced, funding totals £180 billion, or 6.5% of GDP. Other countries that have allocated funds for energy-related relief in excess of 3% of GDP include Croatia, Greece, Italy and Latvia.
It would not be surprising to see more energy-related relief come down the pike. Deficits could balloon in the same way they did during the early months of the COVID crisis as policy makers do what they must to protect their populations.
Central bankers are forced by their mandates to lean hard against the rising trend in prices, although they are essentially working at cross purposes against their own governments’ stimulus efforts. Unfortunately, they’re running just to keep up with the Fed. Interest-rate differentials versus the US are still wide, with only Canada on par with the US.
The large differential in favour of the US, along with the perception that it’s better positioned economically, are two major reasons behind the US dollar’s extraordinary appreciation this year. Although a declining currency may give a competitive boost to domestic firms that export goods and services to the US market, it exacerbates the inflationary pressures stemming from imports that are priced in dollars, most importantly, oil and liquefied natural gas.
Several large US multinational companies have warned that dollar strength is beginning to exert a negative impact on revenues, suggesting that the currency’s value has risen well beyond its purchasing power parity (PPP) level. But discrepancies can last for a long time between PPP and market-based exchange rates.
That noted, it would not be surprising to see at least a temporary reversal in the dollar’s trend. Given a catalyst—coordinated government action to weaken the dollar or a surprisingly weak US unemployment report, for example—traders might cover their long positions in a major way, causing the dollar to fall abruptly.
The rise in US hourly compensation has been extensive, with annualized gains exceeding 6% even when measured over a three-year span. This is the sharpest increase in almost four decades. Similar to the 1970s experience, compensation gains have been accelerating even as productivity growth has slowed. This divergence is concerning.
The difference between the change in compensation and the change in productivity equals the change in unit labour costs.
Although unit labour costs are more volatile than inflation, there is still a strong positive correlation between the two.
Unfortunately, history shows that it usually takes an outright recession to beat down inflation, especially when it gets this intense. Fed Chairman Powell’s hope for a soft landing appears to be an exercise in wishful thinking. Unit labour costs have run far ahead of inflation, and we see no reason to expect a major reversal in the near term, even if the economy stumbles into a bona fide recession.
US companies have been able to push higher employment and supply costs onto the consumer. There hasn’t been much of a decline in profit margins yet—they’ve remained above all the previous cyclical peaks going back to 1947. But we suspect that margins are on the cusp of a substantial erosion. It’s typical for profit margins to decline well before an economic recession materializes.
If the economy does fall into recession and profits decline, analysts will probably be forced to mark down earnings estimates aggressively to catch up with reality. Investors aren’t waiting for those earnings revisions. They have been pushing equities lower in reaction to the Fed’s aggressive shift and in anticipation of a recession, both in the US and globally.
A funds rate in the 4.4%-to-4.9% range next year, as projected by Fed policymakers, might still be lower than the actual out-turn. But unless the Fed is truly ready to engineer a severe recession, we think PCE price inflation could settle in a 3%-to-4% range instead of the sub-2% pace recorded over much of the past 25 years.
Several asset classes look sharply oversold again, including equities, bonds, currencies and commodities.
The dollar’s sharp climb has reversed most of this year’s appreciation in the commodities complex. If the dollar breaks to the downside, commodities should break to the upside.
We are still bullish on commodities despite the demand destruction that is occurring in Europe and other parts of the globe. Years of underinvestment in fossil fuels and metals mines will likely lead to periodic shortages over the next few years.
In recent weeks, the Chinese central government has allowed Hong Kong and Macau to open up. This might be a preview of what will happen on the Mainland once the Communist Party National Congress installs President Xi Jinping for an unprecedented third term as General Secretary of the party in October.
President Xi’s position may seem unassailable, but we bet he’s looking for a way out of his zero-COVID policy. The loosening of restrictions and return to stronger economic growth is the only logical way out.
Other emerging economies would be big beneficiaries of a revival in Chinese economic activity. Yet dollar strength is a central factor for investors in emerging market equities. The relative performance of the MSCI Emerging Market Total Return Index versus the MSCI World Index peaked in 2010, more-or-less concurrent with the trough in the trade-weighted value of the US dollar. EM equity has now given up almost all of its relative gains versus advanced-country stock markets achieved between 2000 and 2010 as the dollar has grown stronger.
The rate-hiking cycle actually began far sooner in less-developed economies, during the latter months of 2020. Interest-rate hikes in the emerging world have accelerated significantly this year, in both frequency and magnitude. Three-month government bonds are in double digits in Brazil (14.3%), Colombia (10.4%), Hungary (10.0%) and Turkey (17.8%).
Among these four, only Brazil’s rate is comfortably above the inflation rate. Turkey, by contrast, is facing an inflation rate of close to 80%. Little wonder that the Brazilian real has maintained its value against the dollar this year, while the Turkish lira has declined by almost 30%.
The bottom line is that a global recession is forming on the horizon, with Europe and the UK more vulnerable to a downturn than the US in the months immediately ahead.
Short-term gyrations notwithstanding, the primary trend in risk assets still appears negative. Inflation in the US has probably peaked, but we do not expect it to fall as rapidly or as far as the Fed projects. The central bank may still be underestimating the extent to which it needs to tighten policy in order to slow the economy and produce slack in the labour markets.
Glossary of Financial Terms
Anti-fragmentation tool: An anti-fragmentation tool refers to the ECB’s plans to mitigate widening spreads between German government bond yields and those of economically weaker EU members.
Asset Purchase Programme (APP): The ECB’s APP is part of a package of non-standard monetary policy measures that also includes targeted longer-term refinancing operations, and which was initiated in mid-2014 to support the monetary policy transmission mechanism and provide the amount of policy accommodation needed to ensure price stability.
Bull market: A bull market refers to a market environment in which prices are generally rising (or are expected to rise) and investor confidence is high.
Commercial paper: Commercial paper is a type of short-term loan that is not backed by collateral and does not tend to pay interest.
European Commission: The European Commission is the executive branch of the European Union. It operates as a cabinet government, with 27 members of the Commission headed by a President.
Fiscal policy: Fiscal policy relates to decisions about government revenues and outlays, like taxation and economic stimulus.
Gilt: Gilts are sovereign debt securities issued by the UK government.
Group of 7 (G7): The G7 is an inter-governmental forum for the leaders of major advanced democratic nations that includes Canada, France, Germany, Italy, Japan, the UK and the US.
Hawk: Hawk refers to a central-bank policy advisor who has a negative view of inflation and its economic impact, and thus tends to favour higher interest rates.
Inflation: Inflation refers to rising prices.
Monetary policy: Monetary policy relates to decisions by central banks to influence the amount of money and credit in the economy by managing the level of benchmark interest rates and the purchase or sale of securities. Central banks typically make policy decisions based on their mandates to target specific levels or ranges for inflation and employment.
Mortgage-Backed Securities: Mortgage-backed securities (MBS) are pools of mortgage loans packaged together and sold to the public. They are usually structured in tranches that vary by risk and expected return.
NATO: The North Atlantic Treaty Organization (NATO) is an intergovernmental military alliance among 28 European countries and 2 North American countries.
Pandemic Emergency Purchase Programme (PEPP): PEPP is a temporary asset-purchase programme of private and public sector securities established by the European Central Bank to counter the risks to monetary-policy transmission and the outlook for the euro area posed by the COVID-19 outbreak.
Price-to-earnings (PE) ratio: The PE ratio is equal to the market capitalization of a share or index divided by trailing (over the prior 12 months) or forward (forecasted over the next 12 months) earnings. The higher the PE ratio, the more the market is willing to pay for each dollar of annual earnings.
Purchasing power parity (PPP): Purchasing power parity is the exchange rate at which the currency of one country would have to be converted into that of another country to buy the same amount of goods and services in each country.
Quantitative easing: Quantitative easing refers to expansionary efforts by central banks to help increase the supply of money in the economy.
Recession: Recession refers to a period of economic decline and is generally defined by a drop in GDP over two successive quarters.
Summary of Economic Projections: The Fed’s Summary of Economic Projections (SEP) is based on economic projections collected from each member of the Fed Board of Governors and each Fed Bank president on a quarterly basis.
Transmission Protection Instrument (TPI): The European Central Bank established the TPI to ensure the smooth transmission of monetary policy normalisation across eurozone countries. According to the ECB, the TPI “can be activated to counter unwarranted, disorderly market dynamics” by making “secondary market purchases of securities issued in jurisdictions experiencing a deterioration in financing conditions.”
Yield: Yield is a general term for the expected return, in percentage or basis points (one basis point is 0.01%), of a fixed-income investment.
Yield curve: The yield curve represents differences in yields across a range of maturities of bonds of the same issuer or credit rating (likelihood of default). A steeper yield curve represents a greater difference between the yields. A flatter curve indicates the yields are closer together.
Index Descriptions
Consumer Price Indexes measure changes in the price level of a weighted-average market basket of consumer goods and services purchased by households. A consumer price index is a statistical estimate constructed using the prices of a sample of representative items whose prices are collected periodically.
The Bloomberg Commodity Index is composed of futures contracts and reflects the returns on a fully collateralised investment in the Index. This combines the returns of the Index with the returns on cash collateral invested in 13-week (3-month) US Treasury bills.
The Bloomberg Global Aggregate Index is an unmanaged market-capitalisation-weighted benchmark that tracks the performance of investment-grade fixed-income securities denominated in 13 currencies. The Index reflects reinvestment of all distributions and changes in market prices.
The MSCI ACWI Index is a market-capitalisation-weighted index composed of over 2,000 companies, and is representative of the market structure of 46 developed- and emerging-market countries in North and South America, Europe, Africa and the Pacific Rim. The Index is calculated with net dividends reinvested in US dollars.
The MSCI Emerging Markets Index is a free float-adjusted market-capitalisation-weighted index designed to measure the performance of global emerging-market equities. Total return indexes reflect the price performance of index constituents and the income from constituent dividend payments.
The MSCI World Index is a free float-adjusted market-capitalisation-weighted index that is designed to measure the equity market performance of developed markets.
The US Personal Consumption Expenditures (PCE) Price Index is the primary inflation index used by the Federal Reserve when making monetary-policy decisions
The S&P 500 Index is a market-capitalization-weighted index that consists of 500 publicly-traded large US companies that are considered representative of the broad US stock market.
Important Information
Data refers to past performance. Past performance is not a reliable indicator of future results.
Investments in SEI Funds are generally medium- to long-term investments. The value of an investment and any income from it can go down as well as up. Investors may get back less than the original amount invested. Returns may increase or decrease as a result of currency fluctuations. Additionally, this investment may not be suitable for everyone. If you should have any doubt whether it is suitable for you, you should obtain expert advice.
No offer of any security is made hereby. Recipients of this information who intend to apply for shares in any SEI Fund are reminded that any such application may be made solely on the basis of the information contained in the Prospectus. This material represents an assessment of the market environment at a specific point in time and is not intended to be a forecast of future events, or a guarantee of future results. This information should not be relied upon by the reader as research or investment advice regarding the funds or any stock in particular, nor should it be construed as a recommendation to purchase or sell a security, including futures contracts.
In addition to the normal risks associated with equity investing, international investments may involve risk of capital loss from unfavourable fluctuation in currency values, from differences in generally accepted accounting principles or from economic or political instability in other nations. Bonds and bond funds are subject to interest rate risk and will decline in value as interest rates rise. High yield bonds involve greater risks of default or downgrade and are more volatile than investment grade securities, due to the speculative nature of their investments. Narrowly focused investments and smaller companies typically exhibit higher volatility. SEI Funds may use derivative instruments such as futures, forwards, options, swaps, contracts for differences, credit derivatives, caps, floors and currency forward contracts. These instruments may be used for hedging purposes and/or investment purposes.
While considerable care has been taken to ensure the information contained within this document is accurate and up-to-date, no warranty is given as to the accuracy or completeness of any information and no liability is accepted for any errors or omissions in such information or any action taken on the basis of this information.
This information is issued by SEI Investments (Europe) Limited, 1st Floor, Alphabeta, 14-18 Finsbury Square, London EC2A 1BR which is authorised and regulated by the Financial Conduct Authority.
SEI sources data directly from FactSet, Lipper, and BlackRock, unless otherwise stated.
The opinions and views in this commentary are of SEI only and should not be construed as investment advice.
Please refer to our latest Prospectus (which includes information in relation to the use of derivatives and the risks associated with the use of derivative instruments), Key Investor Information Document, Summary of UCITS Shareholder rights (which includes a summary of the rights that shareholders of our funds have) and the latest Annual or Semi-Annual Reports for more information on our funds, which can be located at Fund Documents. And you should read the terms and conditions contained in the Prospectus (including the risk factors) before making any investment decision.
This information is being made available in Hong Kong by SEIAL. The contents of this document have not been reviewed by any regulatory authority in Hong Kong. You are advised to exercise caution in relation to the offer. If you are in any doubt about any of the contents of this document, you should obtain independent professional advice.
The SEI UCITS Funds have not been authorised by the SFC in Hong Kong and will be an unregulated collective investment scheme for the purpose of the Securities and Futures Ordinance of Hong Kong (the “SFO”). Shares of the SEI UCITS Funds may not be offered or sold by means of any document in Hong Kong other than (a) to professional investors as defined in the SFO and its subsidiary legislation or (b) in other circumstances which do not result in the document being a “prospectus” as defined in the Companies Ordinance (“CO”) or which do not constitute an offer to the public within the meaning of the CO. This document does not constitute an offer or invitation to the public in Hong Kong to acquire shares in the SEI UCITS Funds. These materials have not been delivered for registration to the Registrar of Companies in Hong Kong.
It is the responsibility of every recipient to understand and observe applicable regulations and requirements in their jurisdiction. This information is only directed at persons residing in jurisdictions where the SEI UCITS Funds are authorised for distribution or where no such authorisation is required.
The Shares may not be offered, sold or delivered directly or indirectly in the US or to or for the account or benefit of any US Person except pursuant to an exemption from, or in a transaction not subject to, the registration requirements of the Securities Act of 1933 and any applicable state laws.
This information is made available in Latin America FOR PROFESSIONAL (non-retail) USE ONLY by SIEL.
Any questions you may have in relation to its contents should solely be directed to your Distributor. If you do not know who your Distributor is, then you cannot rely on any part of this document in any respect whatsoever.
SEI has not considered the suitability or appropriateness of any of the SEI UCITS Funds against your individual needs and risk tolerance. SEI shall not be liable for, and accepts no liability for, the use or misuse of this document by the Distributor. For all Distributors of the SEI UCITS Funds please refer to your sub-distribution agreement with SIEL before forwarding this information to your clients. It is the responsibility of every recipient to understand and observe applicable regulations and requirements in their jurisdiction. The Distributor is, amongst other things,
responsible for ensuring that the Shares are only offered, and any literature relating to the SEI UCITS Funds (including this document) are only distributed, in jurisdictions where such offer and/or distribution would be lawful.
Issued in South Africa by SEI Investments (South Africa) (Pty) Ltd. FSP No. 13186 which is a financial services provider authorised and regulated by the Financial Sector Conduct Authority (FSCA). Registered office: 3 Melrose Boulevard, 1st Floor, Melrose Arch 2196, Johannesburg, South Africa.
A number of sub-funds of the SEI Global Master Fund plc and the SEI Global Investment Fund plc (the “SEI UCITS Funds”) have been approved for distribution in South Africa under s.65 of the Collective Investment Schemes Control Act 2002 as foreign collective investment schemes in securities. If you are unsure at any time as to whether or not a portfolio of SEI is approved by the Financial Sector Conduct Authority (“FSCA”) for distribution in South Africa, please consult the FSCA’s website (www.fsca.co.za).
Collective Investment Schemes (CIS) are generally medium to long term investments and investors may not get back the amount invested. The value of participatory interests or the investment may go down as well as up. SEI does not provide any guarantee either with respect to the capital or the return of an SEI UCITS Fund. The SEI UCITS Funds are traded at ruling prices and can engage in borrowing and scrip lending. A schedule of fees and charges and maximum commissions is available upon request from SEI. The SEI UCITS Funds invest in foreign securities. Please note that such investments may be accompanied by additional risks such as: potential constraints on liquidity and the repatriation of funds; macroeconomic, political/emerging markets, foreign currency risks, tax and settlement risks; and limits on the availability of market information.
This commentary is intended for information purposes only and the information in it does not constitute financial advice as contemplated in terms of the Financial Advisory and Intermediary Services Act.
Please refer to our latest Prospectus (which includes information in relation to the use of derivatives and the risks associated with the use of derivative instruments), Key Investor Information Document and the latest Annual or Semi-Annual Reports for more information on our funds, which can be located at Fund Documents.


