Quarterly Market Commentary: Stocks grab a lead at the half.
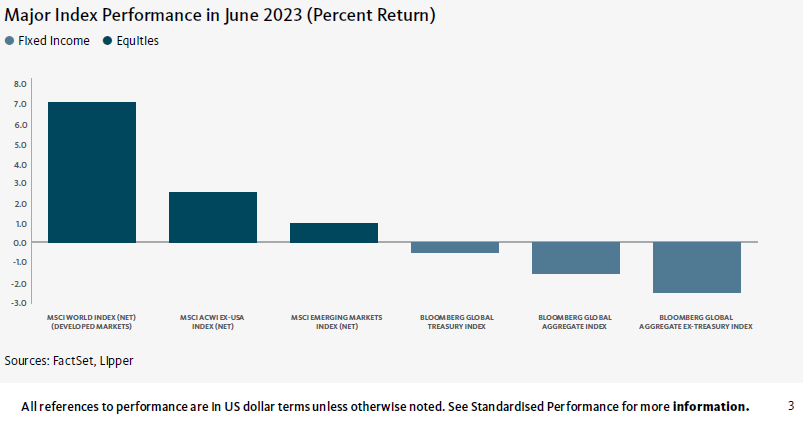
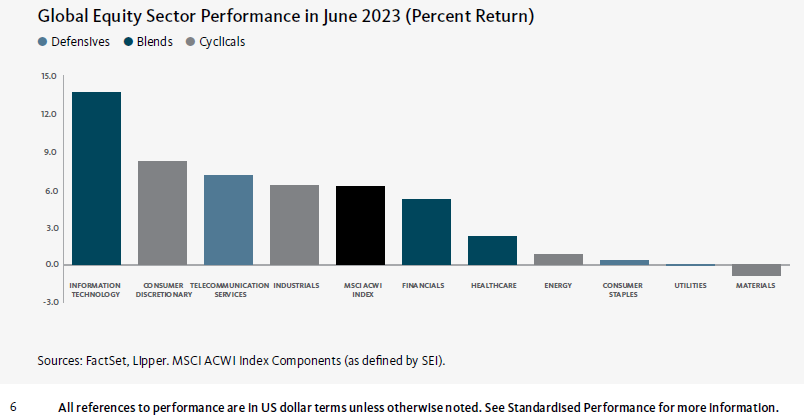
Global equity markets put up big scores in both the second quarter and the first half of 2023, amid periods of volatility. Markets were buoyed by a sharp rally in technology stocks, investors’ optimism regarding generally favorable economic data, as well as the resolution of the politically charged debt-ceiling standoff in the U.S. These positive contributors offset concerns about tighter central bank monetary policy and the stability of regional banks. Developed markets outperformed emerging markets during the quarter.
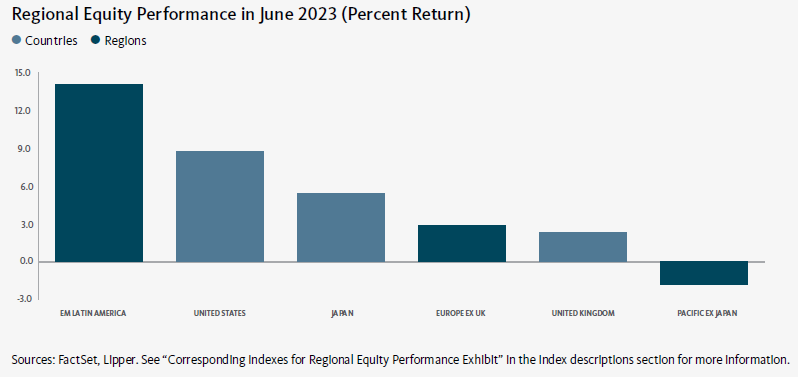
North America was the top-performing region among developed markets for the quarter due primarily to strength in the U.S. Pacific ex Japan was the primary market laggard due to weakness in New Zealand and Singapore. Eastern Europe led the emerging markets, benefiting mainly from strong performance in Hungary, Poland, and Greece. Latin America also performed well during the period. Conversely, emerging markets in the Far East posted negative returns, hampered by a downturn in China amid investors’ worries about relatively weak economic data.1
President Joe Biden and Kevin McCarthy, Speaker of the U.S. House of Representatives, reached an agreement on raising the $31.4 trillion debt ceiling during the last week of May. Both the U.S. House of Representatives and the Senate passed the legislation—the Fiscal Responsibility Act—by wide margins, with strong support from Republicans and Democrats. The bill suspends the debt ceiling through January 1, 2025, maintains non-military spending close to current levels for the 2024 fiscal year, which begins in October, and implements a 1% cap on increases in non-military spending for the 2025 fiscal year. The fast-track approval of the legislation, which Biden subsequently signed into law, enabled the government to avoid a potential default on its debt on June 5, the “X-date” on which Treasury Secretary Janet Yellen had warned that the U.S. would no longer be able to meet its financial obligations.
The U.S. Federal Reserve (Fed) maintained the federal-funds rate in a range of 5.00% to 5.25% following its meeting in mid-June. During an appearance before the U.S. House of Representatives Committee on Financial Services the following week, Fed Chair Jerome Powell stated, “Nearly all [Federal Open Market Committee] participants expect that it will be appropriate to raise interest rates somewhat further by the end of the year…We will continue to make our decisions meeting by meeting, based on the totality of incoming data and their implications for the outlook for economic activity and inflation, as well as the balance of risks. We remain committed to bringing inflation back down to our 2 percent goal and to keeping longer-term inflation expectations well anchored.”
Powell attended the Banco de Espana Fourth Conference on Financial Stability in Madrid, Spain, toward the end of June to discuss the instability in the U.S. banking sector earlier this year. The Fed chair commented, “The banking system remains sound and resilient, deposit flows have stabilized, and strains have eased.” He acknowledged that the failures of several regional banks “were painful reminders that we cannot predict all of the stresses that will inevitably come with time and chance. We therefore must not grow complacent about the financial system’s resilience.”
U.S. regional bank stocks continued to experience significant volatility during the second quarter, and ended the period with notable losses. The KBW Regional Banking Index, which tracks the performance of publicly traded U.S. regional banks and thrifts, fell 6.7% in the second quarter, and was down more than 27% for the year to date.
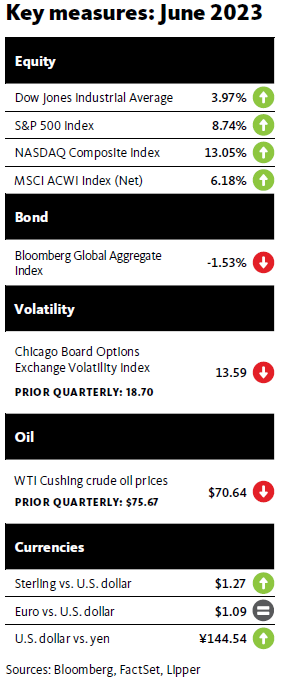
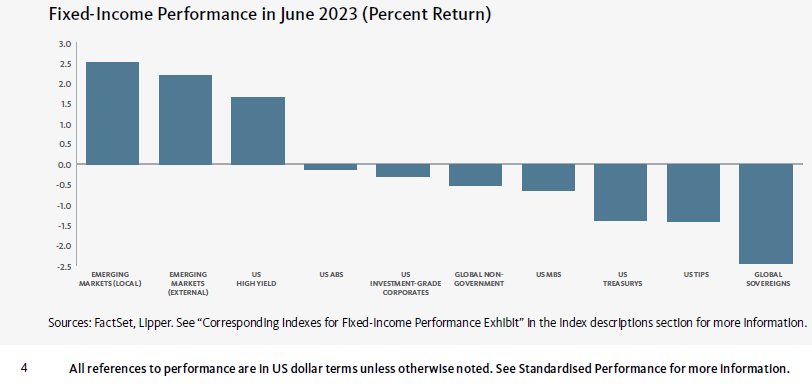
The performance of global fixed-income assets was mixed over the second quarter. High-yield bonds recorded positive returns and were the top performers within the U.S. market for the period. 2 Corporate bonds, mortgagebacked securities (MBS) and U.S. Treasurys ended the quarter in negative territory.3 U.S. Treasury yields moved sharply higher across the curve during the quarter. Between late April and late May, yields on 1-month U.S. Treasury bills (T-bills) with maturities close to the U.S. government’s “X-date” of June 5 for the default on its financial obligations climbed 167 basis points (1.67%) to 6.02%–the highest level since the introduction of the 1-month T-bill in July 20014—before tumbling to 5.28% over the last two days of the month following the announcement of a potential agreement on raising the debt ceiling. The yield on the 1-month T-bill ended the quarter at 5.24%. Investors had demanded higher yields as compensation for the additional risk that the U.S. government could default on its debt in early June. The yields on 2-, 3-, 5-, and 10-year Treasury notes climbed 0.81%, 0.68%, 0.53%, and 0.33%, respectively, over the second quarter. The spread between 10- and 2-year notes widened from -0.58% to -1.06% during the three-month period, further inverting the yield curve.
Global commodity prices moved lower during the second quarter. The West Texas Intermediate (WTI) crude-oil spot price and the Brent crude oil price fell 6.6% and 5.6%, respectively, in U.S. dollar terms, hampered by investors’ concerns about waning demand for oil. The 25.1% rise in the New York Mercantile Exchange (NYMEX) natural gas price for the quarter was attributable to investors’ expectations that a hot summer season and the possibility of hurricanes in the U.S. will boost demand. Wheat prices were down 6.0% over the quarter, as Ukraine and Russia renewed an agreement that allows the shipment of Ukrainian grain through the Black Sea, increasing supply. The wheat price rallied briefly in late June after the Wagner Group, a Russian paramilitary organization that had been fighting in Ukraine on behalf of the Russian government, organized a short-lived mutiny against Russian President Vladimir Putin’s regime. The group occupied Rostov-On-Don in southern Russia, a significant command center for the Russian government’s invasion of Ukraine. The wheat price subsequently fell near the end of the month when the Wagner Group’s leader, Yevgeny Prigozhin, agreed to be exiled to Belarus, and the mercenaries retreated from Rostov-On-Don.5 The gold spot price declined 2.9% during the quarter, hampered by the Fed’s outlook for more interest-rate hikes in the near future; the resolution of debt ceiling in the U.S., which reduced demand for the precious metal as a “safe-haven” asset; and U.S. dollar strength.6
Economic data
U.S.
- According to the third estimate from the Department of Commerce, U.S. gross domestic product (GDP) grew at a better-than-expected annualized rate of 2.0% in the first quarter of 2023, up significantly from the second estimate of 1.3%, but down from the 2.6% rise in the fourth quarter of 2022. The largest increases for the first quarter of this year were in consumer spending, exports, and federal government spending. These gains offset reductions in private inventory investment (a measure of the changes in values of inventories from one time period to the next) and residential fixed investment (purchases of private residential structures and residential equipment that property owners use for rentals). The government attributed the increase in the GDP growth rate relative to the previous estimate to upward revisions to exports, consumer spending, state and local government spending, and residential fixed investment. These offset downward revisions to nonresidential fixed investment (purchases of both nonresidential structures and equipment and software) and federal government spending.
- The U.S. employment outlook remains resilient, with robust hiring and notable increases in job openings. The Department of Labor reported that U.S. payrolls expanded by a greater-than-expected total of 338,000 in May, though the unemployment rate rose 0.3 percentage point to 3.7%. The professional and business services, government, and health care sectors saw the largest employment gains during the month. Average hourly earnings rose 0.3% in May and 4.3% year-over-year. The 12-month increase was marginally lower than the 4.4% annual rise in April. Furthermore, according to the Department of Labor’s Job Openings and Labor Turnover Survey (JOLTS), the number of job openings in the U.S. rose by 358,000 (3.7%) to 10.1 million in April (the most recent reporting period)—well above the pre-pandemic level of 7 million in February 2020.
- Higher mortgage rates continue to weigh on the U.S. housing market. The National Association of Realtors (NAR) reported that sales of existing homes rose 0.2% in May, but were down 20.4% versus the same period a year earlier. The median existing-home sale price fell 3.1% year-over-year to $396,000. The inventory of unsold existing homes increased 3.8% month-over-month to 1.08 million, equivalent to a three-month supply at the current monthly sales pace. According to the NAR, a six-month supply of homes historically has indicated a “balanced market,” in which prices rise modestly. Inventories of greater than six months typically favor buyers, while a supply of homes that will be depleted in less than six months constitutes a “seller’s market.”
- The Conference Board’s Leading Economic Index® (LEI) fell 0.7% to 106.7 in May, following a 0.6% decline in April. The LEI retreated 4.3% over the previous six-month period. The downturn in the index in May resulted from consumers’ tempered expectations for business conditions, a decline in the Institute for Supply Management (ISM®) New Orders Index—which tracks new-order volumes for 18 manufacturing industries—the inverted U.S. Treasury yield curve, and deteriorating credit conditions. The LEI has declined for 14 consecutive months, indicating weaker economic activity.
U.K.
- According to the Office for National Statistics (ONS), consumer prices in the U.K. rose 0.6% month-over-month in May, matching the 0.6% increase in April. The inflation rate rose 7.9% over the previous 12-month period, up 0.1% from the 7.8% annual increase in April. Food and non-alcoholic beverages, as well as restaurants and hotels, were the most notable contributors to the annual increase in prices. Core inflation, which excludes volatile food and energy prices, rose at an annual rate of 6.5% in May, an upturn from the 6.2% year-over-year increase in for the previous month.
- The ONS also reported that U.K. GDP ticked up 0.1% over the three-month period ending April 30, 2023. Construction and production increased 1.6% and 0.2%, respectively, versus the previous three-month period, while the services sector dipped 0.1%.
- The S&P Global/CIPS Flash UK Manufacturing Output was unchanged at 47.7 in June due to a decrease in orders, along with customer destocking (a planned reduction in stock or inventory). A reading below 50 indicates contraction in the manufacturing sector.
- The S&P Global/CIPS Flash UK Services PMI Business Activity Index declined 1.5 to 53.7 in June, but indicated expansion for the fourth consecutive month. The slowdown in the rate of growth relative to the previous month resulted mainly from a reduction in consumer spending, as well as weaker demand in the construction and real estate sectors.
Eurozone
- Eurostat estimated that the inflation rate in the eurozone fell 0.6% to 5.5% for the 12-month period ending in June. Energy prices decreased 5.6% yearover-year in June, following a 1.8% decline in May. While prices for food, alcohol and tobacco, as well as industrial goods, led the upturn in the annual inflation rate in June, the pace of acceleration slowed. Core inflation, which excludes energy and food, rose 5.4% for the month, up from 5.3% in May.7
- Eurozone manufacturing remained in contraction territory in June, with the HCOB Flash Eurozone Manufacturing PMI Output Index falling 1.8 to an eight-month low of 44.6.
- Services activity in the eurozone expanded in June, but the HCOB Flash Eurozone Services PMI Business Activity Index was down 2.7 to a fivemonth low of 52.4.
- According to Eurostat’s third estimate, eurozone GDP dipped 0.1% in the first quarter of 2023, down 0.2% from the initial estimate of a 0.1% increase. Eurozone GDP also declined 0.1% in the fourth quarter of 2022. GDP increased 1.0% over the 12-month period ending in March 2023. Poland’s economy was the strongest performer, expanding 3.8% in the first quarter, while Ireland’s GDP decreased at an annual rate of 4.6% year-over-year.
Central banks
- The Fed maintained the federal-funds rate in a range of 5.00% to 5.25% following its meeting in mid-June. In a statement announcing the pause, the Federal Open Market Committee (FOMC) commented, “Tighter credit conditions for households and businesses are likely to weigh on economic activity, hiring, and inflation…Holding the target range steady at this meeting allows the Committee to assess additional information and its implications for monetary policy.”
- The Fed’s so-called dot plot of economic projections, released in June, indicated a median federal-funds rate of 5.6% at the end of 2023, up from its previous estimate of 5.1% issued in March, implying that the central bank could implement two more 0.25% rate increases in the coming months. The Fed also raised its estimate for personal-consumptionexpenditures (PCE) price inflation by 0.3% to an annual rate of 3.6% as of the end of this year. The PCE price index is the Fed’s preferred gauge of inflation, as it tracks the change in prices paid by or on behalf of consumers r a more comprehensive set of goods and services than that of the CPI. In a split 7-2 vote, the Bank of England (BOE) raised its benchmark rate by 0.50% to 5.00% on June 21. The BOE’s Monetary Policy Committee (MPC) expects U.K. GDP to tick up 0.25% in the second quarter of this year.
- However, it anticipates that there will be a modest increase in underlying economic output in the second half of 2023. Additionally, the MPC projects that the U.K.’s inflation rate, as measured by the consumer-price index, will fall significantly over the remainder of this year attributable mainly to lower energy costs. The central bank anticipates that core inflation, which excludes volatile food and energy prices, will decline later this year due to lower costs in the supply chain. Additionally, the MPC believes that food price inflation will decelerate over the next several months.
- The European Central Bank (ECB) increased its benchmark interest rate by 0.25% to 4.00% following its meeting on June 15. In a statement announcing the rate hike, the ECB’s Governing Council noted, “Indicators of underlying price pressures remain strong, although some show tentative signs of softening. Staff have revised up their projections for inflation excluding energy and food, especially for this year and next year, owing to past upward surprises and the implications of the robust labour market for the speed of disinflation.”
- The Bank of Japan (BOJ) left its benchmark interest rate unchanged at -0.1% at its meeting on June 15. The central bank noted that it will “will purchase a necessary amount of Japanese government bonds (JGBs) without setting an upper limit so that 10-year JGB yields will remain at around zero percent.” Additionally, the BOJ indicated that it will maintain its yield control program, allowing 10-year JGB yields to fluctuate in the range of around +0.5% to -0.5% from the 0% target.
SEI’s view
Economists have been spending much of their time this year arguing when or if economic growth, inflation, corporate profits, interest rates, and equities will peak. Optimists and pessimists alike have been confounded by the ebb and flow of the data and the gyrations of the financial markets. Waiting for a decisive break in the U.S. economy, for example, has been akin to “waiting for Godot.”8
In general, input-price inflation has decelerated dramatically. Canada’s industrial producer price index has registered an outright decline in its price level, with a year-over-year change of -6.3% through May. The Eurozone’s producer-price index (PPI) has witnessed the sharpest deceleration, falling from a peak yearover- year rate of 43% through August 2022 to an April 2023 reading of just 1%. By contrast, the improvement in producer prices has been less dramatic in Japan (still rising at a 5.1% year-over-year pace as of May), although the country has logged a steep deceleration from earlier this year. These year-over-year inflation PPI readings should continue to show improvement in the months immediately ahead owing to favorable base effects.
The good news at the corporate level is feeding only slowly down to the consumer. This is especially true for core inflation, which excludes food and energy prices. Inflation is still accelerating in both the U.K. (reaching 7.1% in May) and in Japan (+2.7%). Improvement in the U.S. and the euro area has been modest, with annual core inflation running at 5.3% and 6.1%, respectively, in May.9 Only Canada has recorded significant progress in its core inflation rate, declining from 6.0% in June 2022 to 3.6% as of May 2023.
On a longer-term basis, we believe that demographic shifts are likely to keep labor markets tighter than has been the case at any point since the baby boomers—who were born between 1946 and 1964—first made their presence felt in the workforce in the 1970s. The new focus on supply-chain resiliency, reduced dependence on China as a manufacturing hub, the transition away from relatively cheap fossil-fuel energy to greener but more expensive sources of power, and the likelihood of significantly higher corporate taxes and financing costs in the years ahead, all suggest to us that inflation will tend to settle at 3% or more in advanced industrial economies instead of the previous norm of 2% or less.
Persistent inflation and ongoing labor-market tightness have forced most major developed-country central banks to keep raising their benchmark interest rates. The Fed, the Bank of Canada, and the ECB already have benchmark rates that match or exceed the peak recorded in 2008.10 We think it’s likely that the BOE will soon join this group.
Although the FOMC chose to keep the funds rate unchanged at its June 2023 meeting, the central bank warned that it may well raise the federal-funds rate by another 25 basis points (0.25%) at its next meeting in July. It also left open the possibility of yet another rate hike after that, which Fed Chair Powell underscored during his recent Congressional testimony. It wasn’t too long ago that markets were pricing in a June 2023 peak in the federal-funds rate, followed by at least three rate cuts before the end of 2023. Those cuts have now been taken out of the equation. As of the end of June, the CME Group’s
FedWatch Tool implied an 87% probability of a 25-basis point increase, into the 5.25%-to-5.50% range, at the next FOMC meeting on July 26. The odds of the first rate cut have now been pushed out to January 2024, with a year-end 2024 implied rate at roughly 4%.
SEI does not dispute the fact that inflation will continue to decelerate, especially given the current weakness in energy and goods prices. It is only a question of timing and end point. We maintain our view that inflation pressures will remain persistent in laborintensive service industries, at least until some slack opens up in the labor markets and spending by households fades more dramatically.
The rally in U.S. equities broadened in June, but the valuation in the market again is a problem. The price-to-earnings ratio of the broad-market S&P 500 Index has been on the rise this year, now almost reaching 19 times analysts’ estimated earnings for the next 12 months.11 This expansion in the multiple on forward earnings has occurred despite the additional monetary tightening by the Fed and other central banks and a rebound in bond yields from the dip that took place following the mid-March bank panic. Furthermore, this upturn in expected forward earnings over the next 12 months is not likely to last if a recession materializes later this year or in 2024. The overall market also appears to be overvalued relative to today’s bond yields. If earnings experience a substantial contraction, history suggests that stock valuations also will fall.
Glossary of financial terms
The debt ceiling is the total amount of money that the U.S. government is authorized to borrow to meet its existing legal obligations, including Social Security and Medicare benefits, military salaries, interest on the national debt, tax refunds, and other payments. Failing to increase the debt limit would cause the government to default on its legal obligations.
Yield is the income returned on an investment, such as the interest received from holding a security. The yield is usually expressed as an annual percentage rate based on the investment’s cost, current market value, or face value.\
Mortgage-backed securities (MBS) are pools of mortgage loans packaged together and sold to the public. They are usually structured in tranches (a slice or portion of a structured security) that vary by risk and expected return.
Yield curve represents differences in yields across a range of maturities of bonds of the same issuer or credit rating (are (which is used to assess the risk of default of companies or countries). A steeper yield curve represents a greater difference between the yields. A flatter curve indicates the short- and long-term yields are closer together.
An inverted yield curve occurs when short-term yields exceed long-term yields. While an inverted yield curve historically has predicted economic recessions, it is an indicator—not a forecast.
The federal-funds rate is the interest rate charged to lending institutions on unsecured overnight loans. It is set by the U.S. Federal Reserve’s Federal Open Market Committee. The rate is increased when the Federal Reserve wants to discourage borrowing and slow the economy and decreased when the Federal Reserve wants to spur economic growth.
Economic output comprises a quantity of goods or services produced in a specific time period.
Monetary policy refers to decisions by central banks to influence the amount of money and credit in the economy by managing the level of benchmark interest rates and the purchase or sale of securities. Central banks typically make policy decisions based on their mandates to target specific levels or ranges for inflation and employment.
A recession is a significant and prolonged downturn in economic activity.
U.S. Treasury bills are short-term debt obligations backed by the U.S. Treasury Department with a maturity of one year or less.
U.S. Treasury notes are debt obligations backed by the U.S. Treasury Department with a maturity between one and 10 years.
The New York Mercantile Exchange (NYMEX) is the world's largest physical commodity futures exchange and is part of the Chicago Mercantile Exchange Group (CME Group), which is the world’s leading derivatives marketplace.
The National Association of Realtors (NAR) is a trade association that is involved in all aspects of the residential and commercial real estate industries.
The Conference Board’s Leading Economic Index® is designed to signal peaks and troughs in the business cycle in the U.S.
The Institute for Supply Management (ISM®) New Orders Index tracks new-order volumes for 18 manufacturing industries.
The CME Group’s FedWatch Tool analyzes the probability of Federal Open Market Committee (FOMC) rate moves for upcoming meetings, using the 30-Day federal-funds futures pricing data, which have long been relied upon to express the market’s views on the likelihood of changes in U.S. monetary policy.
Input price inflation measures changes in the prices of materials and fuels purchased by manufacturers for processing.
Index definitions
The MSCI All Country World Index (ACWI) is a market capitalization-weighted index that tracks the performance of over 2,000 companies, and is representative of the market structure of 48 developed and emerging-market countries in North and South America, Europe, Africa, and the Pacific Rim. The index is calculated with net dividends reinvested in U.S. dollars.
The ICE BofA U.S. High Yield Constrained Index is a market capitalization-weighted index which tracks the performance of U.S. dollar-denominated below-investment-grade (rated BB+ or lower by S&P Global Ratings and Fitch Ratings or Ba1 or lower by Moody’s Investors Service) corporate debt publicly issued in the U.S. domestic market.
The ICE BofA U.S. Corporate Index includes publicly issued, fixed-rate, nonconvertible investment-grade (rated BBB- or higher by S&P Global Ratings and Fitch Ratings or Baa3 or higher by Moody’s Investors Service) dollar-denominated, U.S. Securities and Exchange (SEC)-registered corporate debt having at least one year to maturity.
The ICE BofA U.S. Treasury Index tracks the performance of fixed-rate, nominal debt issued by the U.S. Treasury.
The S&P U.S. Mortgage-Backed Securities Index tracks the performance of U.S. dollar-denominated, fixed-rate and adjustable-rate/hybrid mortgage pass-through securities issued by Ginnie Mae (GNMA), Fannie Mae (FNMA) and Freddie Mac (FHLMC).
The KBW Regional Banking Index tracks the performance of U.S. regional banks and thrifts that are publicly traded in the U.S.
Consumer-price indexes measure changes in the price level of a weighted-average market basket of consumer goods and services purchased by households. A consumer price index is a statistical estimate constructed using the prices of a sample of representative items whose prices are collected periodically.
A purchasing managers’ index (PMI) tracks the prevailing direction of economic trends in the manufacturing and service sectors.
The S&P Global/CIPS Flash UK Manufacturing Output Index measures the activity level of purchasing managers in the manufacturing sector of the U.K. A reading above 50 indicates expansion in the sector; below 50 indicates contraction.
The S&P Global/CIPS Flash UK Services PMI Business Activity Index measures the activity level of purchasing managers in the services sector. A reading above 50 indicates expansion in the sector; a reading below 50 indicates contraction.
The HCOB Flash Eurozone Manufacturing Output Index measures the activity level of purchasing managers in the manufacturing sector of the eurozone. A reading above 50 indicates expansion in the sector; below 50 indicates contraction.
The HCOB Eurozone Services PMI Activity Index measures the activity level of purchasing managers in the services sector of the eurozone. A reading above 50 indicates expansion in the sector; below 50 indicates contraction.
Producer-price indexes (PPI) measure the average change over time in selling prices received by domestic producers of goods and services.
The S&P 500 Index is a market-weighted index that tracks the performance of the 500 largest publicly traded U.S. companies and is considered representative of the broad U.S. stock market.
Important Information
The information contained herein is for general and educational information purposes only and is not intended to constitute legal, tax, accounting, securities, research or investment advice regarding the Strategies or any security in particular, nor an opinion regarding the appropriateness of any investment. This information should not be construed as a recommendation to purchase or sell a security, derivative
or futures contract. You should not act or rely on the information contained herein without obtaining specific legal, tax, accounting and investment advice from an investment professional. This material represents an assessment of the market environment at a specific point in time and is not intended to be a forecast of future events, or a guarantee of future results. There is no assurance as of the date of this
material that the securities mentioned remain in or out of the SEI Strategies. Positioning and holdings are subject to change. All information as of 30 June 2023.
Information contained herein that is based on external sources or other sources is believed to be reliable, but is not guaranteed by SEI, and the information may be incomplete or may change without notice. This document may not be reproduced, distributed to another party or used for any other purpose.
There are risks involved with investing, including loss of principal. Diversification may not protect against market risk. There may be other holdings which are not discussed that may have additional specific risks. Narrowly focused investments and smaller companies typically exhibit higher volatility. International investments may involve risk of capital loss from unfavourable fluctuation in currency values, from differences in generally accepted accounting principles or from economic or political instability in other nations. Emerging markets involve heightened risks related to the same factors, in addition to those associated with their relatively small size and lesser liquidity. Bonds will decrease in value as interest rates rise. High yield bonds involve greater risks of default or downgrade and are more volatile than investment grade securities, due to the speculative nature of their investments. SEI products may use derivative instruments such as futures, forwards, options, swaps, contracts for differences, credit
derivatives, caps, floors and currency forward contracts. These instruments may be used for hedging purposes and/or investment purposes.
While considerable care has been taken to ensure the information contained within this document is accurate and up-to-date, no warranty is given as to the accuracy or completeness of any information and no liability is accepted for any errors or omissions in such information or any action taken on the basis of this information.
The value of an investment and any income from it can go down as well as up. Investors may get back less than the original amount invested. Returns may increase or decrease as a result of currency fluctuations. Past performance is not a reliable indicator of future results. Investment may not be suitable for everyone. If you should have any doubt whether it is suitable for you, you should obtain expert advice.
Index returns are for illustrative purposes only, and do not represent actual account performance. Index returns do not reflect any management fees, transaction costs or expenses. Indexes are unmanaged and one cannot invest directly in an index.
Not all strategies discussed may be available for your investment.
This material is not directed to any persons where (by reason of that person’s nationality, residence or otherwise) the publication or availability of this material is prohibited. Persons in respect of whom such prohibitions apply must not rely on this information in any respect whatsoever.
The views and opinions within this document are of SEI only and are subject to change. They should not be construed as investment advice.
The views contained herein are not to be taken as advice or a recommendation to buy or sell any investment in any jurisdiction. Our outlook contains forward-looking statements that are judgments based upon our current assumptions, beliefs and expectations. If any of the factors underlying our current assumptions, beliefs or expectations change, our statements as to potential future events or outcomes may be incorrect. We undertake no obligation to update our forward-looking statements.
The SEI Global Assets Fund Plc, SEI Global Investments Fund Plc, and SEI Global Master Fund Plc (the “SEI UCITS Funds”) are structured as open-ended collective investment schemes and are authorised in Ireland by the Central Bank as a UCITS pursuant to the UCITS Regulations. The SEI UCITS Funds are managed by SEI Investments, Global Ltd (“SIGL”). SIGL has appointed SEI Investments (Europe) Ltd (“SIEL”) to provide general distribution services in relation to the SEI UCITS Funds either directly or through the appointment of other sub-distributors. The SEI UCITS Funds may not be marketed to the general public except in jurisdictions where the funds have been registered by the relevant regulator. The matrix of the SEI UCITS fund registrations can be found here seic.com/GlobalFundRegistrations.
No offer of any security is made hereby. Recipients of this information who intend to apply for shares in any SEI UCITS Fund are reminded that any such application may be made solely on the basis of the information contained in the Prospectus. Please refer to our latest Prospectus (which includes information in relation to the use of derivatives and the risks associated with the use of derivative instruments),
Key Investor Information Document, Summary of UCITS Shareholder rights (which includes a summary of the rights that shareholders of our funds have) and the latest Annual or Semi-Annual Reports for more information on our funds,which can be located at Fund Documents.
No exempt offer of the Shares for subscription or purchase (or invitation to subscribe for or purchase the Shares) may be made, and no document or other material (including this Information Memorandum) relating to the exempt offer of Shares may be circulated or distributed, whether directly or indirectly, to any person in Singapore except in accordance with the restrictions and conditions under the Act. By
subscribing for Shares pursuant to the exempt offer under this Information Memorandum, you are required to comply with restrictions and conditions under the Act in relation to your offer, holding and subsequent transfer of Shares.
This information is being made available in Hong Kong by SEIAL. The contents of this document have not been reviewed by any regulatory authority in Hong Kong. You are advised to exercise caution in relation to the offer. If you are in any doubt about any of the contents of this document, you should obtain independent professional advice.
The SEI UCITS Funds have not been authorised by the SFC in Hong Kong and will be an unregulated collective investment scheme for the purpose of the Securities and Futures Ordinance of Hong Kong (the “SFO”). Shares of the SEI UCITS Funds may not be offered or sold by means of any document in Hong Kong other than (a) to professional investors as defined in the SFO and its subsidiary legislation or (b) in other circumstances which do not result in the document being a “prospectus” as defined in the Companies Ordinance (“CO”) or which do not constitute an offer to the public within the meaning of the CO. This document does not constitute an offer or invitation to the public in Hong Kong to acquire shares in the SEI UCITS Funds. These materials have not been delivered for registration to the Registrar of Companies in Hong Kong.
It is the responsibility of every recipient to understand and observe applicable regulations and requirements in their jurisdiction. This information is only directed at persons residing in jurisdictions where the SEI UCITS Funds are authorised for distribution or where no such authorisation is required.
The Shares may not be offered, sold or delivered directly or indirectly in the US or to or for the account or benefit of any US Person except pursuant to an exemption from, or in a transaction not subject to, the registration requirements of the Securities Act of 1933 and any applicable state laws.
This information is made available in Latin America FOR PROFESSIONAL (non-retail) USE ONLY by SIEL.
Any questions you may have in relation to its contents should solely be directed to your Distributor. If you do not know who your Distributor is, then you cannot rely on any part of this document in any respect whatsoever.
SIEL has appointed SEI Investments (Asia) Limited (SEIAL) of Suite 904, The Hong Kong Club Building, 3 Jackson Road, Central, Hong Kong as the sub-distributor of the SEI UCITS funds.
Singapore
The offer or invitation to subscribe for or purchase shares of the Sub-Funds (the “Shares), which is the subject of this Information Memorandum, is an exempt offer made only: (i) to “institutional investors” pursuant to Section 304 of the Securities and Futures Act, Chapter 289 of Singapore (the “Act”), (ii) to “relevant persons” pursuant to Section 305(1) of the Act, (iii) to persons who meet the requirements of an offer made pursuant to Section 305(2) of the Act, or (iv) pursuant to, and in accordance with the conditions of, other applicable exemption provisions of the Act.
SEI has not considered the suitability or appropriateness of any of the SEI UCITS Funds against your individual needs and risk tolerance. SEI shall not be liable for, and accepts no liability for, the use or misuse of this document by the Distributor. For all Distributors of the SEI UCITS Funds please refer to your sub-distribution agreement with SIEL before forwarding this information to your clients. It is the responsibility of every recipient to understand and observe applicable regulations and requirements in their jurisdiction. The Distributor is, amongst other things, responsible for ensuring that the Shares are only offered, and any literature relating to the SEI UCITS Funds (including this document) are only distributed, in jurisdictions where such offer and/or distribution would be lawful.
Issued in South Africa by SEI Investments (South Africa) (Pty) Ltd. FSP No. 13186 which is a financial services provider authorised and regulated by the Financial Sector Conduct Authority (FSCA). Registered office: 3 Melrose Boulevard, 1st Floor, Melrose Arch 2196, Johannesburg, South Africa.
A number of sub-funds of the SEI Global Master Fund plc and the SEI Global Investment Fund plc (the “SEI UCITS Funds”) have been approved for distribution in South Africa under s.65 of the Collective Investment Schemes Control Act 2002 as foreign collective investment schemes in securities. If you are unsure at any time as to whether or not a portfolio of SEI is approved by the Financial Sector Conduct Authority (“FSCA”) for distribution in South Africa, please consult the FSCA’s website (www.fsca.co.za).
Collective Investment Schemes (CIS) are generally medium to long term investments and investors may not get back the amount invested. The value of participatory interests or the investment may go down as well as up. SEI does not provide any guarantee either with respect to the capital or the return of an SEI UCITS Fund. The SEI UCITS Funds are traded at ruling prices and can engage in borrowing and
scrip lending. A schedule of fees and charges and maximum commissions is available upon request from SEI. The SEI UCITS Funds invest in foreign securities. Please note that such investments may be accompanied by additional risks such as: potential constraints on liquidity and the repatriation of funds; macroeconomic, political/emerging markets, foreign currency risks, tax and settlement risks; and limits on the availability of market information.
This commentary is intended for information purposes only and the information in it does not constitute financial advice as contemplated in terms of the Financial Advisory and Intermediary Services Act.
Please refer to our latest Prospectus (which includes information in relation to the use of derivatives and the risks associated with the use of derivative instruments), Key Investor Information Document and the latest Annual or Semi-Annual Reports for more information on our funds, which can be located at Fund Documents.