Quarterly Market Commentary: Markets Adapt in a Season of Change
The first quarter of 2021 was marked by transitions. Geopolitically, the UK bid the EU adieu after more than four years of anticipation, while the US federal government came under the leadership of the Biden administration and unified control of his Democratic Party in the Congress.
This season of change was perhaps most evident in the trajectory of COVID-19’s toll: case counts and daily deaths began the calendar year at or near their all-time peaks in many parts of the world, which created a sense for much of the quarter that the state of COVID-19 affairs was improving—albeit from a bleak starting point—and this impression was boosted by the increasing availability of vaccines. Case counts began to rise again in several countries toward the end of the quarter, and herd immunity was estimated to still be a couple months away at best, leading to the extension or re-imposition of restrictive public health measures to varying degrees around the globe yet again.
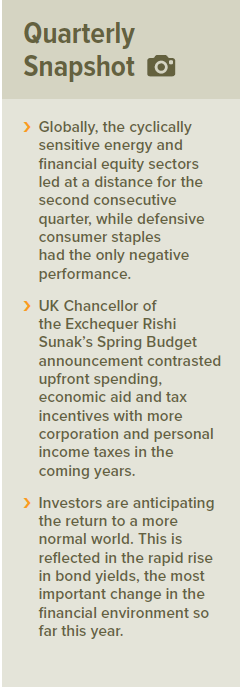
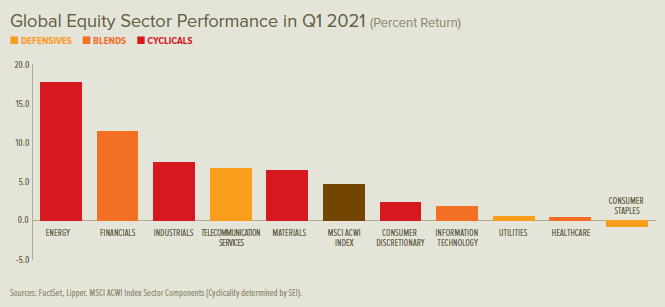
Forward-looking capital markets focused on the brightening outlook throughout the first quarter. Globally, the cyclically sensitive energy and financial equity sectors led at a distance for the second consecutive quarter, while defensive consumer staples had the only negative performance.
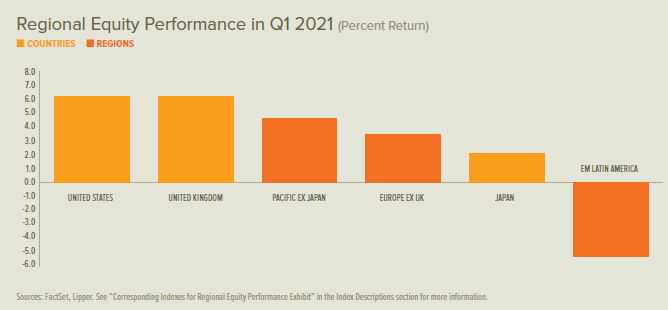
At the country level, Chile delivered the first quarter’s top equity market gain. Chile has the world’s largest copper reserves and is responsible for roughly one-third of global copper output, and has also established one of the most expedient vaccination programmes on the planet. Energy producers Saudi Arabia and UAE were the next-best performers. Among major markets, Hong Kong had the best performance, followed by the UK, the US, Europe, and then Japan. Mainland Chinese shares were slightly negative.
As equity performance implies, commodities delivered large gains on the anticipated transition back to normal life. The West Texas Intermediate crude oil price increased by 21.9% during the quarter. OPEC+ (the Organization of the Petroleum Exporting Countries, led by Saudi Arabia—plus Russia) announced on 1 April a planned increase in crude oil production beginning in May and escalating to more than 2 million additional barrels per day by July.
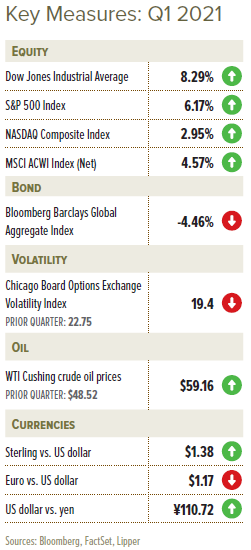
Government bond rates in major developed countries generally increased during the first quarter, and yield curves steepened as longer-term rates rose by more than shorter-term rates. The greatest increase in long-term rates came during February, and was most pronounced in the US, although UK and EU rates followed a similar path. In the US, short-term rates fell throughout the quarter, while they only began falling in the UK and EU during March. The 10-year US Treasury rate nearly doubled during the quarter—moving from 0.93% to 1.74%.
UK Chancellor of the Exchequer Rishi Sunak’s Spring Budget announcement contrasted upfront spending and tax incentives with higher taxes in the coming years. The budget extends income replacement schemes for furloughed employees and the self-employed, provides payments for non-essential retail, hospitality and leisure businesses, Restart grants for businesses that were required to shut down, and more.
The budget also offers businesses nearer-term investment incentives— principally in the form of a 130% tax credit for capital expenditures over the next two years—followed by an increase in the corporation tax rate from 19% to 25% in 2023. According to the Office for Budget Responsibility, a five-year freeze on the tax-free personal allowance and higher rate tax threshold is projected to create 1.3 million new taxpayers and push 1 million taxpayers into a higher tax bracket, raising $8 billion in tax revenue between 2022 and 2025.
In the US, President Biden signed an aid package totalling $1.9 trillion into law on 11 March, providing funding for extended and expanded US unemployment benefits, direct stimulus payments, child tax credits, schools, state and local governments, and elsewhere.
On the last day of March, Biden announced a $2.3 trillion package targeted at modernising travel and utility infrastructure, care for the elderly and disabled, manufacturing, affordable housing, and expanded access to broadband internet, coupled with a broad low-carbon electricity generation mandate. This was the first of a two-part long-term economic plan with costs spread over eight years—the second part will focus on child and health care, and more details are expected in late April. The price tag for Biden’s proposal would be offset by increasing the corporate tax rate from 21% to 28% for a 15 year period and raising taxes on overseas corporate profits.
The Biden administration re-visited US tariffs in March, agreeing with the EU to suspend $11.5 billion in tariffs ($4 billion in EU tariffs on US goods and $7.5 billion in US tariffs on EU goods) for a four-month period in an effort to negotiate a resolution, and struck a similar but smaller truce with the UK. US tariffs on Chinese goods, however, would remain, according to US Trade Representative Katherine Tai.
Economic Data
- UK manufacturing growth slowed to a modest pace in January, before accelerating through February and March to end the first quarter with a robust expansion. UK services activity contracted sharply in January, and essentially maintained pace in February, before returning to strong growth in March. The UK claimant count (which calculates the number of people claiming Jobseeker’s Allowance) decreased slightly in January to 7.2%, then jumped in February to 7.5%, tying August 2020 for the highest level since 1995 and representing about 2.68 million total claimants. The overall UK economy grew by 1.3% during the fourth quarter, down from 16.0% during the third quarter’s sharp recovery, and contracted by 7.3% year over year through the fourth quarter.
- Growth in eurozone manufacturing activity started at healthy levels in January before climbing through February and March to a red-hot pace. Eurozone services, meanwhile, continued to contract throughout the first quarter, worsening through January and February after a partial recovery in December, and then improving in March to the mildest levels since September. The overall eurozone economy contracted by 0.7% during the fourth quarter of 2020 after expanding by 12.4% during the third quarter snapback.
- US manufacturing growth continued to increase at very strong levels throughout the first quarter. US services sector growth also accelerated throughout the first quarter starting with a robust increase in the rate of expansion during January. New US jobless claims climbed back to nearly 1 million per week in mid-January before declining unevenly to almost 700,000 by the end of the quarter. The overall US economy grew by a 4.3% annualised rate in the fourth quarter, down from 33.4% during the third quarter’s huge rebound.
Central Banks
- The Bank of England’s Monetary Policy Committee (MPC) kept the bank rate at 0.1% and retained a maximum allowance for asset purchases of £895 billion throughout the first quarter. Following its early-February meeting, the MPC communicated that it had no intention of lowering rates into negative territory within the next six months; by mid-March— faced with rising rates—the MPC stated it wouldn’t increase rates “at least until there is clear evidence that significant progress is being made in eliminating spare capacity and achieving the 2% inflation target sustainably.”
- The European Central Bank (ECB) announced plans in mid-March to increase the pace of asset purchases under its €1.85 trillion Pandemic Emergency Purchase Programme (PEPP) relative to the speed and size of purchases made in early 2021. This move is intended to counter the negative economic impact of rising rates. The ECB’s latest forecast showed a modest improvement in GDP for 2021.
- The US Federal Open Market Committee (FOMC) held the federal funds rate near zero throughout the first quarter and continued its asset purchases apace ($80 billion in US Treasurys and $40 billion in agency mortgage-backed securities per month). Its latest Summary of Economic Projections (SEP), release in mid-March, showed marked improvements in 2021 estimates for GDP and US employment, as well as a significant increase in the inflation rate, compared to the December SEP. Federal Reserve (Fed) Chair Jerome Powell followed the March meeting by communicating that the FOMC would not seek to pre-empt rising inflation with tighter monetary policy.
- The Bank of Japan (BOJ) detailed the results of its Assessment for Further Effective and Sustainable Monetary Easing, which recommended establishing a programme subsidizing banks to compensate for the impact of negative interest rates. Other changes generally concerned shifting to market interventions on an as needed rather than a programmatic basis. The BOJ established a band in which the 10-year Japanese government bond rate would be allowed to fluctuate before intervening with purchases to control the level. Purchases of exchange-traded funds and Japanese real estate investment trusts also remained part of the policy mix, but rather than making routine purchases, the BOJ will shift to intervening when faced with market weakness. The central bank also plans to continue purchasing corporate paper and bonds to a total of about ¥20 trillion through September 2021.
SEI’s View
The war against COVID-19 is not over, but the path to victory has become clearer. Investors are anticipating the return to a more normal world. This is reflected in the rapid rise in bond yields, the most important change in the financial environment so far this year. This jump has caused outsized price drops in long-term fixed-income securities and has helped fuel the sharp rotation in the equity market away from expensively priced growth shares and into value-oriented and cyclical sectors, both in the US and internationally.
At the start of the year, most economists and bond investors expected higher rates. Few, however, predicted the speed and extent of the increases. While yields on US sovereign debt are setting the pace, they are rising in other countries too.
With the passage of the latest US fiscal stimulus package, the cumulative amount of US fiscal support over the past 12 months totals a remarkable $6 trillion, approaching 30% of US GDP. The Fed has gone to great lengths to protect the bond market from the rising tide of Treasury issuance with its purchases of outstanding issues. In the 12 months ended March 2021, the Fed has bought $2.1 trillion of Treasury securities; as of February, the federal deficit over the past 12 months amounted to $3.55 trillion.
Higher bond yields may cause bouts of indigestion for equities, but they should not derail the bull market. We expect to see cyclical and value oriented shares continue to advance relative to growth and defensively oriented sectors. In most cycles, value shares outperform growth when the yield curve is rising or is very wide (rates on long-term Treasury bonds are well above those on short-term securities). Value’s performance against growth bottomed on 1 September, and has been on a tear since.
While value-oriented shares have been making a comeback against growth in the US, other countries’ equity markets are making a comeback against the US.
Japan has been a strong performer among countries with the highest market capitalisations. The economy has benefited from strong exports to China and the US over the past year. Real GDP at the end of 2020 was only 1.3% below the year-ago level, better than most other developed countries, including the United States.
France also has seen a 20%-plus gain in its equity market since August. This might be an even greater surprise than the run-up in Japanese share prices, since the country has been enduring a difficult COVID-19 wave like much of Europe.
Although the United Kingdom has lagged the MSCI World Index over the past seven months, its 14.53% total return nonetheless is slightly ahead of the US. Considering all the uncertainty surrounding Brexit and the harsh lockdowns associated with COVID-19 in recent months, this is not a bad outcome.
As spring arrives and lockdowns end on the back of the country’s successful vaccination effort, we look for the UK to experience a strong recovery in consumer demand and business activity that should outpace the rest of Europe’s.
UK government policy remains supportive in the near-term. But the recently proposed fiscal budget appears rather restrained compared to the measures taken by the Biden Administration, adding only about 3% of GDP to the budget deficit for the 2021/22 fiscal year. From fiscal year 2023/24 and beyond, policy actions begin to reduce the deficit, mostly through an increase in the corporation tax rate from 19% to 25% and through the freezing of income tax thresholds.
Although not as high as the valuation metrics found in the US equity market, shares outside the US still appear expensive. Currently, the MSCI World ex USA Index is priced at almost 17 times the earnings per share forecast for the next 12 months, the highest level since 2004.
To repeat, developed country equity markets still look cheap compared to the United States. The forward price-to-earnings ratio for the MSCI USA index is still above 22. The MSCI World ex USA Index therefore trades at an unusually wide 25% discount. Although longer-term growth differentials justify a structurally higher multiple for US equities, rebounding economies and rising interest rates should lead to a narrower valuation gap.
The jump in US bond yields this year has raised investor concerns that emerging markets will be the victims of a 2013-style taper tantrum. Rising rates are a headwind, but we believe emerging economies are generally in a better position to withstand the pressure than they were eight years ago. Strong growth in the world economy over the next year should help lift most emerging markets.
World trade volumes, for example, had already reached pre-pandemic levels by the end of last year. Over the course of 2021, the expansion in trade should continue. When trade volumes are strong, developing-country equity markets tend to perform well against those of the economically advanced countries.
We believe the economic backdrop strongly supports cyclical and value oriented equities in the emerging markets, just as it does in developed markets. The MSCI Emerging Markets Value total-return Index is highly correlated with industrial commodity prices, which have already vaulted higher from their year-ago lows.
We project that more commodity-price gains are on the way. Strong manufacturing and construction demand in the US and China, recovery in Europe and Latin America as vaccines become more widely available, the global push into electric vehicles and other climate projects, and the major infrastructure package that is next on the Biden Administration’s to-do list all promise to stoke demand for metals and other commodities.
Emerging economies also look less susceptible to a 2013-style taper tantrum because their external positions are much healthier. Current account balances as a percentage of GDP are generally much smaller now than eight years ago.
Emerging-market local-currency and US-dollar bond yields have moved higher this year, but the increase has so far been quite modest. Option adjusted spreads are still near their lows of the past three years, certainly not qualifying as a taper tantrum.
Granted, some big countries face continuing problems. Besides Turkey, debt dynamics among the larger countries appear most worrying in Brazil and South Africa. However, most of the debt in these two countries is denominated in local currency, allowing their governments to engage in some form of financial repression (like quantitative easing) in order to temper the pressure on their bond markets.
SEI’s base case is an optimistic one. Developing countries will likely take longer to reopen fully since vaccination distribution will take time. Yet, even these countries will benefit economically from the upswing in developed market consumer demand.
Having confidence is not the same as being complacent, however. Beyond COVID concerns, investors will be increasingly focused on the next multitrillion dollar US infrastructure package. Tax increases on corporations and high-income households will also be part of this package. Compromises will be needed to keep the Democratic caucus unified.
Generally speaking, the tax and regulatory changes championed by the Biden administration are not business- or equity-market friendly. But the same could be said of the economic policies pursued during the Obama Administration. That did not prevent one of the strongest and most enduring bull-market runs in US history. We caution against making broad asset-allocation changes based on perceived shifts in the political winds.
As for monetary policy, we will be watching whether the Fed can maintain its stance of a near-zero federal funds rate through 2023. If the acceleration in inflation proves stronger and longer-lasting than investors expect, bond yields could climb appreciably from today’s levels.
If the Fed accelerates policy rate hikes, we would expect a neutral-to negative reaction in equities and other risk assets. Suppressing the rise in bond yields through even more aggressive policy actions, on the other hand, could lead to a weaker dollar and a sharper investor focus on inflation-hedging. Equity valuations could get even more expensive than they are now as investors grow even more exuberant. Interesting times, indeed.
Glossary of Financial Terms
Bear market: A bear market refers to a market environment in which prices are generally falling (or are expected to fall) and investor confidence is low .
Bull market: A bull market refers to a market environment in which prices are generally rising (or are expected to rise) and investor confidence is high.
Cyclical stocks: Cyclical stocks or sectors are those whose performance is closely tied to the economic environment and business cycle. Managers with a pro-cyclical market view tend to favour stocks that are more sensitive to movements in the broad market and therefore tend to have more volatile performance.
Fiscal policy: Fiscal policy relates to decisions about government revenues and outlays, like taxation and economic stimulus.
Fiscal stimulus: Fiscal stimulus refers to government spending intended to provide economic support.
Forward price-to-earnings (PE) ratio: The forward PE ratio is equal to the market capitalisation of a share or index divided by forecasted earnings over the next 12 months. The higher the PE ratio, the more the market is willing to pay for each dollar of annual earnings.
Monetary policy: Monetary policy relates to decisions by central banks to influence the amount of money and credit in the economy by managing the level of benchmark interest rates and the purchase or sale of securities. Central banks typically make policy decisions based on their mandates to target specific levels or ranges for inflation and employment.
Mortgage-Backed Securities: Mortgage-Backed Securities (MBS) are pools of mortgage loans packaged together and sold to the public. They are usually structured in tranches that vary by risk and expected return.
OPEC+: OPEC+ combines OPEC—a permanent intergovernmental organization of 13 oil-exporting developing nations that coordinates and unifies the petroleum policies of its member countries—with Russia, a major oil exporter, to make collective high-level decisions about oil production levels.
Pandemic Emergency Purchase Programme (PEPP): PEPP is a temporary asset purchase programme of private and public sector securities established by the ECB to counter the risks to monetary policy transmission and the outlook for the euro area posed by the COVID-19 outbreak.
Paycheck Protection Program: The Paycheck Protection Program is a loan offer by the U.S. government’s Small Business Administration (SBA) designed to provide a direct incentive for small businesses to keep their workers on the payroll. SBA will forgive loans if all employees are kept on the payroll for eight weeks and the money is used for payroll, rent, mortgage interest, or utilities.
Quantitative easing: Quantitative easing refers to expansionary efforts by central banks to help increase the supply of money in the economy.
Summary of Economic Projections: The Fed’s Summary of Economic Projections (SEP) is based on economic projections collected from each member of the Fed Board of Governors and each Fed Bank president on a quarterly basis.
Taper tantrum: Taper tantrum describes the 2013 surge in U.S. Treasury yields, resulting from the U.S. Federal Reserve’s announcement of future tapering of its policy of quantitative easing.
Yield: Yield is a general term for the expected return, in percentage or basis points (one basis point is 0.01%), of a fixed-income investment.
Index Descriptions
The MSCI Emerging Markets Value Index measures the performance of large- and mid-cap stocks exhibiting overall value style characteristics across 27 emerging-market countries.
The MSCI USA Index measures the performance of the large- and mid-cap segments of the U.S. market. The Index covers approximately 85% of the free float-adjusted market capitalization in the U.S.
The MSCI World Index is a free float-adjusted market-capitalization-weighted index that is designed to measure the equity-market performance of developed markets.
The MSCI World ex USA Index is a free float-adjusted market-capitalization-weighted index that is designed to measure the equity market performance of developed markets, excluding the U.S.
The S&P 500 Index is an unmanaged market-capitalisation-weighted index comprising 500 of the largest publicly-traded US companies and is considered representative of the broad US stock market.
Important Information
Data refers to past performance. Past performance is not a reliable indicator of future results.
Investments in SEI Funds are generally medium- to long-term investments. The value of an investment and any income from it can go down as well as up. Investors may get back less than the original amount invested. Returns may increase or decrease as a result of currency fluctuations. Additionally, this investment may not be suitable for everyone. If you should have any doubt whether it is suitable for you, you should obtain expert advice.
No offer of any security is made hereby. Recipients of this information who intend to apply for shares in any SEI Fund are reminded that any such application may be made solely on the basis of the information contained in the Prospectus. This material represents an assessment of the market environment at a specific point in time and is not intended to be a forecast of future events, or a guarantee of future results. This information should not be relied upon by the reader as research or investment advice regarding the funds or any stock in particular, nor should it be construed as a recommendation to purchase or sell a security, including futures contracts.
In addition to the normal risks associated with equity investing, international investments may involve risk of capital loss from unfavourable fluctuation in currency values, from differences in generally accepted accounting principles or from economic or political instability in other nations. Bonds and bond funds are subject to interest rate risk and will decline in value as interest rates rise. High yield bonds involve greater risks of default or downgrade and are more volatile than investment grade securities, due to the speculative nature of their investments. Narrowly focused investments and smaller companies typically exhibit higher volatility. SEI Funds may use derivative instruments such as futures, forwards, options, swaps, contracts for differences, credit derivatives, caps, floors and currency forward contracts. These instruments may be used for hedging purposes and/or investment purposes.
While considerable care has been taken to ensure the information contained within this document is accurate and up-to-date, no warranty is given as to the accuracy or completeness of any information and no liability is accepted for any errors or omissions in such information or any action taken on the basis of this information.
This information is issued by SEI Investments (Europe) Limited, 1st Floor, Alphabeta, 14-18 Finsbury Square, London EC2A 1BR which is authorised and regulated by the Financial Conduct Authority. Please refer to our latest Full Prospectus (which includes information in relation to the use of derivatives and the risks associated with the use of derivative instruments), Key Investor Information Documents and latest Annual or Semi-Annual Reports for more information on our funds. This information can be obtained by contacting your Financial Adviser or using the contact details shown above.
SEI sources data directly from FactSet, Lipper, and BlackRock, unless otherwise stated.
The opinions and views in this commentary are of SEI only and should not be construed as investment advice.


