Quarterly Market Commentary: Falling Rates and Climbing Vaccinations Boost Equities, Bonds and Commodities
The broad-based advance in equities, commodities and riskier fixed-interest asset classes since earlier this year accelerated during the second quarter.
Trendwise, a shift among global investors toward favouring cyclical and value-oriented asset classes that began in the second half of 2020 halted in mid-June. Market observers attributed this to the US Federal Open Market Committee (FOMC) deciding to increase its projection for the federal-funds rate in 2023. Meanwhile, for the first time since April this year, the seven-day moving average of new COVID-19 cases reported in the US stopped falling in mid-June after an impressive period of declines that brought cases to their lowest levels since March 2020. The FOMC development and the bottoming of COVID-19 cases can both be taken as evidence that the rebound taking place as the US economy reopens may be near its peak.
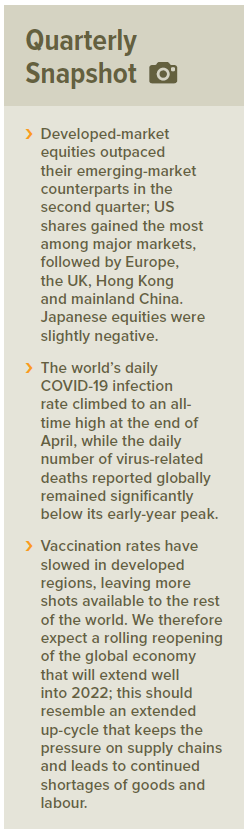
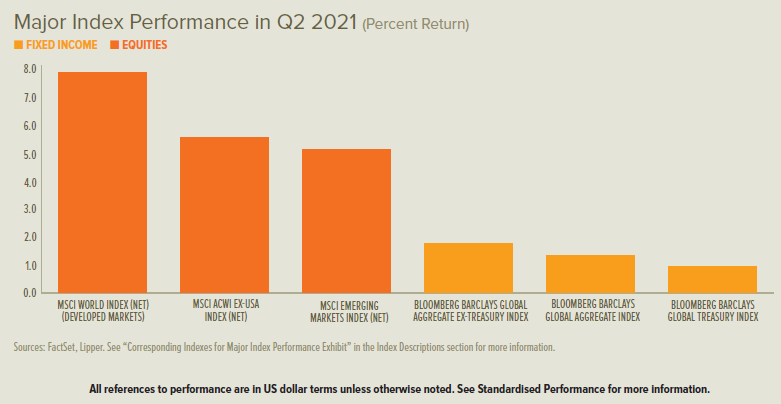
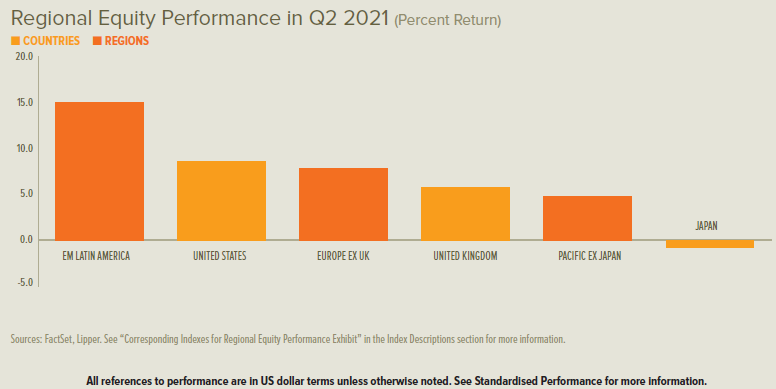
Developed-market equities outpaced emerging markets for the second quarter. US shares gained the most among major markets, followed by Europe, the UK, Hong Kong and mainland China. Japanese equities were modestly negative.
UK gilt and US Treasury rates declined across most maturities for the first two months of the second quarter; short-term rates bounced in June to finish higher for the second quarter as intermediate-to-long-term rates continued to drop—resulting in flatter yield curves. Conversely, eurozone government-bond rates climbed throughout April and May before falling in June, but generally ended up higher compared to the beginning of the quarter.
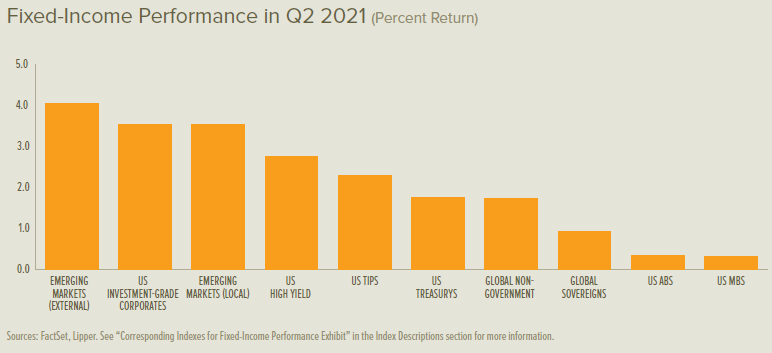
Emerging-market debt was the best-performing fixed-interest asset class. US corporate bonds followed—with investment grade outpacing high yield, and inflation-protected securities also performed notably well.
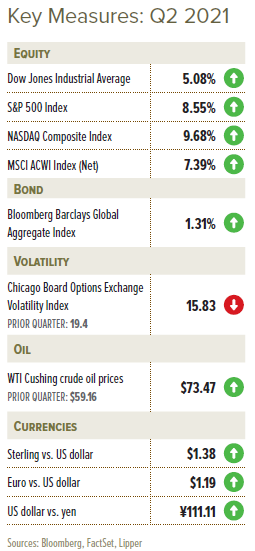
The Bloomberg Commodity Index increased by 13.3% during the second quarter, with most of the advance occurring in April and May. The FOMC’s modest evolution toward tighter monetary policy spurred the US dollar higher in June, tempering the rally in commodities; although the US dollar finished the three-month period slightly lower (according to the DXY Index). The price of West Texas Intermediate crude oil increased by 24.2% during the quarter to $73.47 per barrel.
The world’s daily infection rate climbed past the peak recorded in January to an all-time high at the end of April as India continued to battle a severe COVID-19 outbreak. While the daily number of virus-related deaths reported globally also increased during the second quarter, it remained significantly below its early-year peak. India’s daily case count began to rapidly decline in early May, leaving Brazil with the highest country-level count by the end of the second quarter. At this time, countries reporting cases at or near their all-time peaks were concentrated in Southeast Asia, Sub-Saharan Africa and the Caribbean-Central America region.
As for COVID-19 vaccination trends, Canada, the UK and Chile reported the largest numbers of people (relative to their total populations) that received at least one vaccine dose by the end of the three-month period. Perhaps as a result, the daily average number of deaths in the UK attributed to COVID-19 remained in the low double digits despite a resurgence in new infections that began in mid-May and topped 20,000 cases per day as the quarter came to a close.
The prospect of a bipartisan US infrastructure deal appeared to brighten in mid-June as a group of Senate Republicans and Democrats agreed to a White House compromise that would direct $1.2 trillion toward improving the country’s structures and facilities over an eight-year period. The plan would provide about $580 billion in new spending and sidestep tax increases. However, the possibility of a party-line vote on a larger package by President Biden’s Democrats remained on the table as Republicans took issue with plans by the Democrats to enact other parts of their spending agenda once the infrastructure deal had concluded.
Economic Data
- The UK’s manufacturing frenzy reached the fastest pace of growth since 1994 in May before cooling ever so slightly in June, according to the IHS Markit / CIPS UK Manufacturing Purchasing Managers’ Index (PMI) survey. Similarly, services growth peaked in May at its strongest pace since 1997 before slowing somewhat in June. The UK claimant count (which calculates the number of people claiming Jobseeker’s Allowance) declined by about 56,000 in April and 93,000 in May, with claimants representing 6.2% of the population as at May’s reading. The overall UK economy contracted by 1.6% during the first quarter and 6.1% year over year through March.
- Eurozone manufacturing measured its fourth straight month of record high growth in June, according to IHS Markit’s PMI survey, with Spain and Greece reaching their greatest levels in more than 20 years. Services activity in the eurozone emerged from contraction to start the second quarter before accelerating to the fastest rate of growth in more than three years by June, according to IHS Markit’s PMI survey. The eurozone unemployment rate declined steadily, from 8.1% at the end of the first quarter to 8.0% in April and 7.9% in May. The overall eurozone economy shrank by 0.3% during the first quarter and 1.3% year over year in March.
- Multiple PMI surveys depicted US manufacturing at red-hot growth levels during the second quarter. The Institute for Supply Management reported record manufacturing activity during May, while IHS Markit’s June reading was the strongest on record since 2007. US services activity peaked during May at the highest level on record dating back to 2009, according to IHS Markit’s PMI survey, before slowing to a still-remarkable pace of growth in June. US nonfarm payrolls increased at an accelerating pace throughout the second quarter—by 269,000 in April, 583,000 in May, and 850,000 in June (with 343,000 new leisure and hospitality jobs during June alone)—as new US jobless claims declined from about 700,000 per week at the end of the first quarter to 364,000 in late June. The overall US economy grew by a 6.4% annualised rate during the first quarter.
Central Banks
- The Bank of England’s (BOE) Monetary Policy Committee (MPC) kept the bank rate at 0.1% and retained an £895 billion maximum allowance for asset purchases throughout the second quarter. It shared a projection following its late-June meeting that inflation would temporarily top 3% amid the country’s economic reopening before returning toward 2%.
- The European Central Bank (ECB) began the second quarter with a pledge to increase the pace of asset purchases under its €1.85 trillion Pandemic Emergency Purchase Programme (PEPP). It reaffirmed the acceleration at its June meeting. Purchases averaged about €80 billion per month during the second quarter after running closer to a monthly pace of €60 billion during the first quarter.
- The US FOMC held the federal-funds rate near zero throughout the second quarter and continued its asset purchases apace ($80 billion in US Treasurys and $40 billion in agency mortgage-backed securities per month). Its latest Summary of Economic Projections (SEP), released in mid-June, featured a projected increase in the federal-funds rate to 0.6% in 2023 (up from 0.1% in its March projection). The SEP also depicted significantly higher real gross domestic product (GDP) and inflation projections for 2021, although out-year projections were only modestly higher.
- The Bank of Japan (BOJ) announced following its June meeting that the central bank’s emergency pandemic-related programmes would extend past their scheduled September 2021 end date. A new programme targeted at promoting lending to counteract climate change was also announced in June. The BOJ intends to announce final plans for the programme by the end of 2021, but has said it will likely be based on offering banks attractive loan terms when their lending supports mitigating the effects of climate change.
SEI’s View
Equity markets have long anticipated the economic improvement we now are watching unfold. There is increasing concern, however, that equity prices have risen so much that there is little appreciation potential left, even if the global economy continues to forge ahead into 2022.
The last several weeks have witnessed a partial unwinding of the rotation trade that began last autumn. So far, this appears to us as a temporary pause in a longer-term upswing. The global recovery and expansion have a long way to go, especially since many countries are still imposing lockdown measures to varying degrees.
We can’t rule out a choppier and more lacklustre performance for US equities in the months ahead given their strong outperformance since March 2009 and elevated stock-market valuations relative to much of the rest of the world. We don’t think there’s reason to be overly concerned if stock-market volatility increases; corrections that range from 5% to 10% can occur without any fundamental reason.
In today’s environment, with economies opening up and interest rates still at extraordinarily low levels, the dominant trend favours further price gains over the next year or two. Still, investors must take into account that the US economy appears to have reached “peak growth.”
Growth slowdowns, not just recessions, can lead to equity underperformance versus bonds. The relative performance of equites versus bonds was phenomenal over the past 15 months; a major narrowing of the performance gap is inevitable. Yet, with interest rates still at exceptionally low levels, it is hard to see equities losing ground to fixed income securities while economic growth remains so robust. Not only should consumer demand remain strong as the economy opens up, but businesses, too, are in a spending mood, desperately seeking materials and workers.
In the meantime, companies are expected to enjoy a great deal of pricing power and will almost certainly pass along at least a portion of their increased costs to customers. Unfortunately, one person’s pricing power is another person’s inflation. The big question is whether the price pressures seen this year are transitory, as central bankers around the world say they are.
Investors in the bond market seem to agree with the central bankers. Although US bond yields rose sharply in the first quarter, they have fallen over the past three months. There’s no telling how long bond investors will maintain such a calm perspective if prices keep rising at a pace that has not been seen in almost 30 years.
In his latest testimony, Federal Reserve (Fed) Chairman Jerome Powell reiterated that the US labour market still has a long way to go before it reaches full employment. Job openings in the country are now soaring. If the rise in the Employment Cost Index accelerates as we expect, inflation could become a greater concern for investors than appears to be the case at the moment.
Markets reacted negatively to a surprising extent when the central bank revealed the FOMC’s updated “dot plot” of federal-funds rate projections on 16 June. The median FOMC forecast now calls for two rate hikes in 2023, which was exactly what futures traders had already priced in. Those same traders have now priced in three rate hikes by the end of 2023, but a lot can happen between now and then.
The recent stumble in the rotation theme was exacerbated by the shift in Fed expectations. It is clear, however, that the US central bank will be cautiously moving away from its current policy stance. The first move will likely be the tapering of its bond-buying programme, which may be announced in late August at the annual Jackson Hole conference, with actual tapering beginning in the first quarter of 2022 (at the earliest).
The path of US fiscal policy is harder to decipher given strained bipartisanship and the narrowness of the Democratic majority in the Congress. A traditional infrastructure bill is a good bet, but the push for non-traditional forms of infrastructure—and the taxes to pay for all the added spending—will depend on whether the Democrats in the Senate can come to terms with each other.
The combination of (1) above-average economic growth, (2) significantly higher inflation than seen in the past decade, (3) a fiscal policy that expands the size of federal government spending, and (4) extreme monetary ease aimed at suppressing interest rates is the perfect backdrop for risk assets— and for the creation of speculative bubbles.
The relative success of the US vaccination effort and the country’s stateby- state response have resulted in a significantly stronger economy this year than in other major developed countries. Fortunately, vaccination rates are accelerating in Europe and Japan. We anticipate that other advanced economies will record strong economic results in the second half of the year and into 2022, exceeding the pace in the US.
Although economists correctly point out that the US has employed direct fiscal measures (emergency spending, income support and tax breaks) more aggressively than any other nation, other countries have used different tactics that far exceed the US effort.
Several European nations and Japan have relied on equity injections, loans and guarantees. Italy (35% of GDP), Japan and Germany (both at 28%) are the most notable, according to the International Monetary Fund. In the eurozone, some of these loan commitments have only just begun to flow. Italy and Spain are big beneficiaries of the eurozone’s €750 billion in loans and grants as part of the so-called NextGenerationEU program.
The ECB also seems dedicated to maintaining its pandemic-related monetary support at least through March 2022. As a percentage of GDP, the ECB’s balance sheet has risen more than 25% since the beginning of the COVID-19 crisis, more than any other major central bank besides the BOJ (30%). The ECB’s actions have succeeded in keeping peripheral Europe’s sovereign bond yields well behaved through the crisis period.
While the US, the UK and Canada seem to be enduring a much sharper inflationary increase than Japan or the eurozone, the latter two are probably relieved to have a respite from the deflationary pressures that have been afflicting their economies for many years. There seems little reason for the ECB or BOJ to join the Fed when it comes to discussing a near-term reduction in asset purchases, much less raising their policy rates ahead of the US.
The trade-weighted US dollar jumped to its highest level in three months against other major currencies in the days following the Fed’s latest announcement, although the currency remains some 10% below its 19 March 2020 high. Since any serious policy move by the Fed is still rather far in the future, we continue to expect the US dollar to weaken over time as the rest of the world gains economic strength.
In the meantime, we do not see much sign that the Fed’s shift toward an earlier lift-off in rates is leading to a 2013-style “taper tantrum” among emerging economies. A strong US dollar would certainly threaten the bull market in commodity prices.
We are still bullish on the outlook for commodities, but we are watching price trends carefully. Commodity prices of all types have enjoyed a spectacular run since March 2020 and were already in the process of consolidating or correcting in the weeks before the Fed revised its views.
We remain optimistic that the more cyclical and value-oriented areas within emerging markets will bounce back from their modest stumble in June. But there are near-term challenges besides the shift in perceptions about Fed policy and the future course of the US dollar and commodity prices. Credit growth has decelerated significantly in China, similar to the slowdowns recorded in 2013 and 2018—years when the performance of emerging markets was less than stellar.
Another potential source of market volatility could stem from the increasingly fraught relationship between China and the US and its allies. If there is any consensus in Washington nowadays, it is focused on countering China’s growing economic and military strength; although market participants have mostly managed to look past political tensions to date.
Fundamentally, emerging markets continue to look relatively cheap versus most other regions. The forward price-to-earnings multiple of the MSCI Emerging Markets Index is still selling at a 36.5% discount to that of the MSCI USA Index. Outside the March-to-April 2020 low point, this is as cheap a relative multiple against the US as seen at any time in the past 16 years.
We are counting on the advanced economies to take up the slack while vaccines ramp up in developing countries. There is a tremendous amount of excess savings and pent-up demand in North America and Europe. That said, as the northern hemisphere enters the autumn and winter, the possibility of regional spikes in COVID-19 cases cannot be dismissed. If severe enough, markets could switch back to a decidedly risk-off position.
As vaccination rates slow in the developed world, more shots will be available for the rest of the world. We expect a rolling reopening of the global economy that will extend well into 2022. This wave of recovery could resemble a prolonged up-cycle that keeps the pressure on supply chains, leading to continued shortages of goods and labour. Investor faith in the “transitory inflation” narrative probably will be tested as we head into year end and enter 2022.
Glossary of Financial Terms
Bear market: A bear market refers to a market environment in which prices are generally falling (or are expected to fall) and investor confidence is low.
Bull market: A bull market refers to a market environment in which prices are generally rising (or are expected to rise) and investor confidence is high.
Cyclical stocks: Cyclical stocks or sectors are those whose performance is closely tied to the economic environment and business cycle. Managers with a pro-cyclical market view tend to favour stocks that are more sensitive to movements in the broad market and therefore tend to have more volatile performance.
Fiscal policy: Fiscal policy relates to decisions about government revenues and outlays, like taxation and economic stimulus.
Fiscal stimulus: Fiscal stimulus refers to government spending intended to provide economic support.
Forward price-to-earnings (PE) ratio: The forward PE ratio is equal to the market capitalisation of a share or index divided by forecasted earnings over the next 12 months. The higher the PE ratio, the more the market is willing to pay for each dollar of annual earnings.
Hawk: Hawk refers to a central bank policy advisor who has a negative view of inflation and its economic impact and thus tends to favour higher interest rates.
Inflation-Protected Securities: Inflation-protected securities are typically indexed to an inflationary gauge to protect investors from the decline in the purchasing power of their money. The principal value of an inflation-protected security typically rises as inflation rises, while the interest payment varies with the adjusted principal value of the bond. The principal amount is typically protected so that investors do not risk receiving less than the originally invested principal.
Monetary policy: Monetary policy relates to decisions by central banks to influence the amount of money and credit in the economy by managing the level of benchmark interest rates and the purchase or sale of securities. Central banks typically make policy decisions based on their mandates to target specific levels or ranges for inflation and employment.
Mortgage-Backed Securities: Mortgage-Backed Securities (MBS) are pools of mortgage loans packaged together and sold to the public. They are usually structured in tranches that vary by risk and expected return.
NextGenerationEU: NextGenerationEU is an economic recovery fund established by the EU and totalling more than €800 billion projected to be spent between 2021 and 2027. The centrepiece of the programme is a €723.8 billion facility for loans and grants to EU countries for investments.
OPEC+: OPEC+ combines OPEC—a permanent intergovernmental organization of 13 oil-exporting developing nations that coordinates and unifies the petroleum policies of its member countries—with Russia, a major oil exporter, to make collective high-level decisions about oil production levels.
Pandemic Emergency Purchase Programme (PEPP): PEPP is a temporary asset purchase programme of private and public sector securities established by the ECB to counter the risks to monetary policy transmission and the outlook for the euro area posed by the COVID-19 outbreak.
Quantitative easing: Quantitative easing refers to expansionary efforts by central banks to help increase the supply of money in the economy.
Summary of Economic Projections: The Fed’s Summary of Economic Projections (SEP) is based on economic projections collected from each member of the Fed Board of Governors and each Fed Bank president on a quarterly basis.
Taper tantrum: Taper tantrum describes the 2013 surge in U.S. Treasury yields, resulting from the U.S. Federal Reserve’s announcement of future tapering of its policy of quantitative easing.
Transitory inflation: Transitory inflation refers to a temporary increase in the rate of inflation.
Yield: Yield is a general term for the expected return, in percentage or basis points (one basis point is 0.01%), of a fixed-income investment.
Yield curve: The yield curve represents differences in yields across a range of maturities of bonds of the same issuer or credit rating (likelihood of default). A steeper yield curve represents a greater difference between the yields. A flatter curve indicates the yields are closer together.
Index Descriptions
The Bloomberg Commodity Index is composed of futures contracts and reflects the returns on a fully collateralised investment in the Index. This combines the returns of the Index with the returns on cash collateral invested in 13-week (3-month) US Treasury bills.
The Employment Cost Index is a quarterly economic series published by the U.S. Bureau of Labor Statistics that details the growth of total employee compensation. The index tracks movement in the cost of labour, as measured by wages and benefits, at all levels of a company.
The MSCI Emerging Markets Index is a free float-adjusted market-capitalization-weighted index designed to measure the performance of global emerging-market equities.
The MSCI USA Index measures the performance of the large- and mid-cap segments of the U.S. market.
Important Information
Data refers to past performance. Past performance is not a reliable indicator of future results.
Investments in SEI Funds are generally medium- to long-term investments. The value of an investment and any income from it can go down as well as up. Investors may get back less than the original amount invested. Returns may increase or decrease as a result of currency fluctuations. Additionally, this investment may not be suitable for everyone. If you should have any doubt whether it is suitable for you, you should obtain expert advice.
No offer of any security is made hereby. Recipients of this information who intend to apply for shares in any SEI Fund are reminded that any such application may be made solely on the basis of the information contained in the Prospectus. This material represents an assessment of the market environment at a specific point in time and is not intended to be a forecast of future events, or a guarantee of future results. This information should not be relied upon by the reader as research or investment advice regarding the funds or any stock in particular, nor should it be construed as a recommendation to purchase or sell a security, including futures contracts.
In addition to the normal risks associated with equity investing, international investments may involve risk of capital loss from unfavourable fluctuation in currency values, from differences in generally accepted accounting principles or from economic or political instability in other nations. Bonds and bond funds are subject to interest rate risk and will decline in value as interest rates rise. High yield bonds involve greater risks of default or downgrade and are more volatile than investment grade securities, due to the speculative nature of their investments. Narrowly focused investments and smaller companies typically exhibit higher volatility. SEI Funds may use derivative instruments such as futures, forwards, options, swaps, contracts for differences, credit derivatives, caps, floors and currency forward contracts. These instruments may be used for hedging purposes and/or investment purposes.
While considerable care has been taken to ensure the information contained within this document is accurate and up-to-date, no warranty is given as to the accuracy or completeness of any information and no liability is accepted for any errors or omissions in such information or any action taken on the basis of this information.
This information is issued by SEI Investments (Europe) Limited, 1st Floor, Alphabeta, 14-18 Finsbury Square, London EC2A 1BR which is authorised and regulated by the Financial Conduct Authority. Please refer to our latest Full Prospectus (which includes information in relation to the use of derivatives and the risks associated with the use of derivative instruments), Key Investor Information Documents and latest Annual or Semi-Annual Reports for more information on our funds. This information can be obtained by contacting your Financial Adviser or using the contact details shown above.
SEI sources data directly from FactSet, Lipper, and BlackRock, unless otherwise stated.
The opinions and views in this commentary are of SEI only and should not be construed as investment advice.


