Quarterly Market Commentary: Equity Rally Turns into a Pumpkin as Market Magic Fades
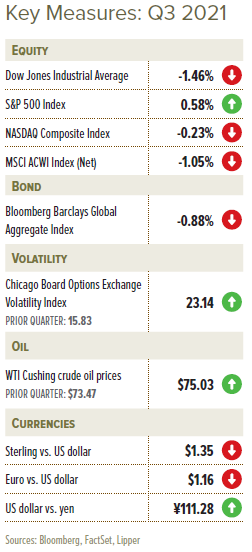
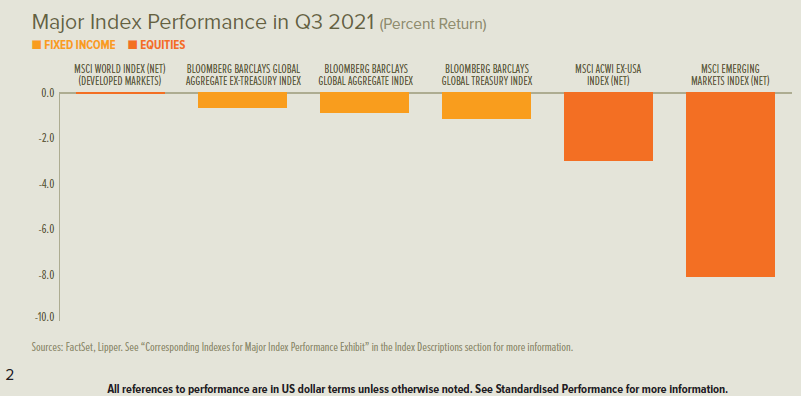
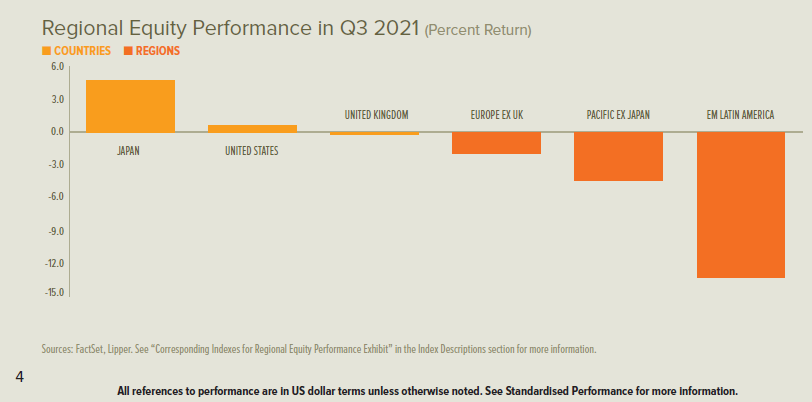
The global equity rally staged a modest retreat for the third quarter, with challenges accumulating as the clock ticked toward the final hours of September, flipping performance from positive to negative in most regions. Developed-market equities were mixed for the period but generally remained quite strong in the year to date; Japan was a rare bright spot among major markets during the quarter. Meanwhile, China and Brazil registered deep losses for the three-month period that sank emerging-market equity returns for the quarter, which tipped returns negative for the year to date.
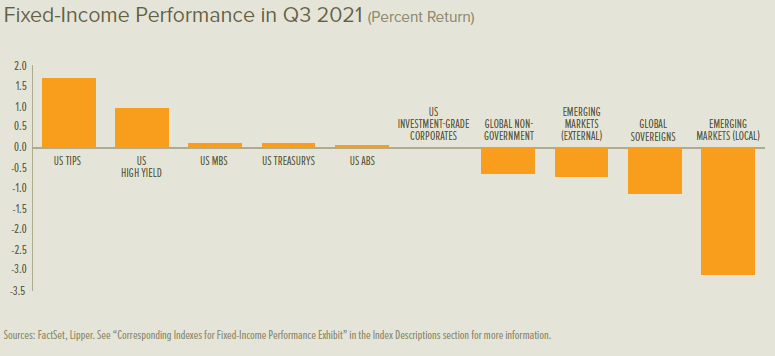
Across the UK, eurozone and US, government bond rates generally increased for the full three-month period. After declining across the yield curve in July, rates rose in August and accelerated their climb in September. Inflation-indexed sovereign debt was the top-performing segment of fixed-interest markets during the quarter; high yield followed, while emerging-market debt and non-indexed sovereigns had the steepest losses.
Crude-oil prices moved lower during the first half of the quarter but then reversed to end the period higher. OPEC+ (the Organization of the Petroleum Exporting Countries led by Saudi Arabia, plus Russia) decided at the beginning of October to maintain (rather than accelerate) the monthly increase in production of 400,000 barrels per day, which sent the price of West Texas Intermediate crude oil to its highest level since 20141.
The Delta wave of new COVID-19 cases peaked in the UK during mid-July, and had a smaller resurgence in early September. Both episodes roughly coincided with high points in the hospitalisation rate, while the number of daily deaths crested along with the early September infections surge. US infection and hospitalisation counts topped at the beginning of September, just two weeks ahead of the country’s mid-September peak in daily deaths2.
Regions that were at or near all-time high infection rates included Northern South America and the Lesser Antilles of the Caribbean; Eastern Europe; Australia; and pockets within Sub-Saharan Africa and Asia-Pacific.
Countries with the highest percent of their populations having received at least one dose of the COVID-19 vaccine through the end of the third quarter were the United Arab Emirates (95%), Portugal (86%), Cuba (83%) and Singapore (82%), while Canada (78%), the UK (73%) and US (65%) lagged.
Cuba’s vaccination pace led the world as at 30 September, administering more than 2,000 daily doses per 100,000 people3.
The People’s Republic of China (PROC) had an outsized sway over capital markets during the third quarter. President Xi Jinping’s “Common Prosperity” campaign accelerated in July with a number of regulatory steps to rein in e-commerce companies and for-profit schools. Evergrande, one of China’s largest real estate developers, also faced a pivotal turning point in July when several banks began denying mortgages on its backlog of unfinished projects. The late-September selloff in shares around the globe exacerbated concerns about the extent of potential fallout effects if the company defaulted on its roughly $300 billion in debt.
Germany’s centre-left Social Democrats (SPD)—led by current vice chancellor and finance minister Olaf Scholz—earned the greatest share of votes in the country’s September election, edging out its coalition partner CDU/CSU. A coalition with SPD at its head will likely form this fall, leaving Chancellor Angel Merkel to remain at the top of a caretaker government in the interim.
In the US, a razor-thin majority that President Joe Biden’s Democrats have enjoyed in the US Congress has created an evolving array of challenges during the quarter. The progressive and moderate wings of his party debated through the end of September over the size and scope of legislation necessary to fund an infrastructure plan, the overall federal budget, and an increase in the US government’s debt ceiling (that is, the total borrowing limit). US Secretary of the Treasury Janet Yellen had warned that the debt ceiling would need to be increased by mid-October in order to avoid a government shutdown.
Economic Data
UK
- The fever pitch of UK manufacturing activity that defined conditions heading into July steadily declined over the course of the third quarter, leaving manufacturing growth at strong, perhaps more sustainable-levels in September4.
- Services-sector growth also slowed from multi-decade highs, but at an even faster pace, settling at moderately healthy levels toward the end of the quarter5.
- The UK claimant count (which calculates the number of people claiming Jobseeker’s Allowance) continued to decline during the third quarter, by roughly 107,000 between June and August, with claimants representing 5.4% of the population as at August’s reading.
- The UK economy expanded by 5.5% during the second quarter and 23.6% year over year after contracting by 1.4% during the first quarter.
Eurozone
- Eurozone manufacturing conditions followed a path similar to the UK’s during the third quarter, but growth remained slightly stronger than the UK throughout the period after setting an all-time high in June6.
- Services growth continued to strengthen through July, but softened notably during September7.
- The eurozone unemployment rate’s decline persisted throughout the third quarter, sliding from 7.7% in June to 7.6% in July, and to 7.5% in August.
- The overall eurozone economy grew by 2.2% during the second quarter and 14.3% year over year after contracting by 0.3% during the first quarter.
US
- Growth in the US manufacturing sector moderated during most of the third quarter, yet strengthened somewhat in September8.
- The services sector remained healthy but unremarkable for the third quarter as growth continued to slow from the record-fast pace registered in May9.
- New weekly US jobless claims essentially finished the third quarter where they started—between 360,000 and 375,000 filings per week—after ranging widely throughout the period from 310,000 to 420,000 claims per week.
- The US economy expanded at a 6.7% annual rate during the secondquarter, up from 6.3% during the first quarter.
Central Banks
- The Bank of England’s (BOE) Monetary Policy Committee (MPC) voted twice during the second quarter to maintain its policy path; the bank rate remained 0.1% and the maximum allowance for asset purchases was unchanged at £895 billion. Elevated inflation pressures provoked the BOE to acknowledge in its September Monetary Policy Summary that modest policy tightening may eventually be warranted.
- The European Central Bank (ECB) began the third quarter adopting a symmetric inflation target of 2% over the medium-term (meaning that it views deviations above or below its target as undesirable) and acknowledging that it anticipates greater fluctuations over shorter time
- frames. After reaffirming in July that purchases under the pandemic emergency purchase programme (PEPP) would be conducted at a significantly higher pace than during the first months of the year (approximately €80 billion per month compared to €60 billion), ECB President Christine Lagarde stated in September that the eurozone’s economic rebound and higher inflation would enable “a moderately lower pace of net asset purchases.”
- Over the course of the third quarter, the US Federal Open Market Committee (FOMC) moved incrementally closer to declaring a start date for tapering (reducing) asset purchases. Its late-September statement said, “If progress continues broadly as expected, the Committee judges that a moderation in the pace of asset purchases may soon be warranted.” The FOMC currently purchases $80 billion in US Treasurys and $40 billion in agency mortgage-backed securities per month; Federal Reserve (Fed) Chairman Jerome Powell indicated that the tapering timeline could be determined at the November FOMC meeting. The central bank noted in its latest quarterly Summary of Economic Projections that the projected timing of the next fed-funds interest-rate hike has moved up to 2022 from 2023 (as projected in June).
- The Bank of Japan (BOJ) maintained its monetary-policy path throughout the third quarter, with its short-term interest rate at -0.1% and 10-year government bond yield target near 0%; it also continued open-ended asset purchases. The central bank’s green lending programme came into focus: starting in December, 0% interest-rate loans will be made available to banks for lending that supports efforts to counteract climate change. Banks will be able to roll these loans forward until 2030.
SEI’s View
In a natural reaction to the prospect of more lockdowns and delayed returns to normal life given the surge in COVID-19 infections that began this past May, investors revisited stocks that benefited the most during 2020—namely the work-at-home, big technology companies and other large-cap stocks that do well when interest rates fall (lower interest rates make future cash flows of these types of stocks more attractive). However, the subsequent bounce-back in growth- and momentum-oriented large-cap stocks at the expense of value and cyclical stocks has already shown signs of deteriorating as rates spiked at the end of the third quarter.
We expect economic growth—in the US and globally—to continue over the next year or two at a pace that meaningfully exceeds the sluggishness of the years that followed the 2007-to-2009 global financial crisis; the recent gloom about flagging economic growth is likely a bit overdone.
Household wealth is at an all-time high, owing to booming stock and home prices10. A big decline in the saving rate has helped cushion the blow to consumer spending; still, saving as a percentage of disposable income remains elevated compared to pre-pandemic levels. We think households generally can adjust to a decline in pandemic relief payments without necessitating a sharp contraction in their expenditures.
The impact of COVID-19 on global supply chains has been a more significant impediment. Vendor deliveries have seldom been as slow in the 74-year history of the Institute for Supply Management’s (ISM) survey as they are now, even with the situation having eased slightly since May. Inventories remain exceedingly low relative to demand.
Input costs have been rising rapidly, but companies have been able to compensate by passing along their increased costs to customers. After-tax corporate margins on an economy-wide basis hit a new all-time high in the second quarter, rising to 14.9% of sales11.
Corporate pricing power is the good news. The bad news is that inflation keeps exceeding consensus expectations. We still expect inflation to run at higher rate for a longer period than has been commonly assumed, not just over the next one or two years, but well into the decade.
Growth in unit labour costs typically plummets when the economy emerges from recession. Now, however, unit labour costs are running near a 2.7% rate—the fastest pace since the peak of the 2002-to-2007 expansion.
While commodity inflation and parts shortages may indeed prove transitory, it isn’t clear whether the labour shortage and resultant pressure on compensation growth will be as quick to revert to lower levels. The tax and regulatory initiatives of the Biden administration will likely add to the cost pressures facing businesses in the years immediately ahead.
Since US demand is expected to remain robust as economic growth normalises, it would not be surprising to see companies continue passing along their increased costs. Inflation over the long haul could thus be closer to 3% than the 2% or so currently expected by the Fed and most investors.
If that turns out to be the case, the Fed may be forced to raise interest rates higher and faster over the next three years than anticipated.
A concern that is much nearer in timeframe is the fight in Washington over infrastructure spending and the debt limit. We assume President Biden will get about half of what he is seeking, but the devil will be in the details. Investors are probably right not to react too dramatically to every development. The debt-limit drama, however, could elicit a more significant disruption as the deadline for must-pass legislation nears. Although the debt ceiling will be raised, the wrangling over it will almost certainly come down to the wire.
We suggest focusing on longer-term considerations: The latest COVID-19 wave will eventually pass. Economic growth should stay relatively strong in 2022. Households are in solid financial shape and will benefit as employment and wages continue to move higher. Companies are still able to pass along increased costs and maintain high profit margins. Fed policy is still biased toward easing, allowing the economy to run hot at the risk of higher inflation. This should all create a favourable backdrop for risk assets and support a resumption in the coming months of the cyclical/financial/value trend versus growth/technology.
Other developed countries are broadly on the same path as the US, and are reacting to the same catalysts.
Purchasing managers’ surveys from recent months show that US economic growth is cooling, yet still strong versus pre-pandemic levels. Activity in Europe, led by Germany, appears to be on the upswing—boosted by a decline in Delta (which has allowed for more travel and tourism in Europe) and an increase in EU fiscal support.
The major outlier is Japan, which has been rather weak so far this year versus its industrial-country peers. Inflation-adjusted GDP fell in the first quarter and posted only a tepid gain in the second quarter. Economists blame COVID-19-related restrictions. The global shortage in the supply of semiconductor chips, meanwhile, has impeded auto production. Citizens nonetheless blamed Prime Minister Yoshihide Suga. In response, he pledged to cede leadership of the Liberal Democratic Party to former foreign minister Fumio Kishida, who is expected to also succeed Suga as prime minister following the November elections.
US inflation may be near a peak, but a further acceleration appears in store for Europe. The immediate concern for households in the region is the cost of energy. Even without energy-production shortages, electricity prices across Europe tend to be much higher than in North America—especially for households, particularly in Germany. The UK is in the midst of a petrol crisis due to an inability to make deliveries to gas stations amid a severe truck-driver shortage.
Europe’s energy woes probably won’t cause the region’s governments to deviate from the climate-change agenda they have put in place. The German election underscores this point. Although it will take a couple of months to cobble together a coalition, all political parties are committed to reducing carbon admissions.
Beyond energy, Europe’s reopening should cause the price of services to rise as they have in the US, albeit to far less of an extent. The overwhelming assumption is that any pickup in inflation will be short-lived.
China is dominating investor perceptions of emerging markets. The Xi government’s push to enforce “common prosperity” has had far-reaching effects on corporate China. The country’s 20-year boom has exacerbated social inequality. Crackdowns on for-profit tutoring companies, major gig employers, and individuals (notably, Jack Ma) is a brutal but effective way of addressing disparities in wealth and income.
Although some of these moves have hurt foreign equity investors, it’s unclear whether the economy itself will be severely constrained. China is a huge country with tremendous internal capital upon which to draw. Foreign companies probably won’t cut and run, but they will certainly be forced to play by Beijing’s rules if they stay.
We expect diversification of supply chains away from China at the margin, but this has been happening anyway. It is in advanced countries’ interests to be more self-sufficient in producing critical products. But China is too big, too efficient and too important a manufacturer for the world to turn its back on.
China’s economic growth rate should nevertheless slow as a result of the government’s actions. Property development has been the driving force behind its rapid expansion over the past 15 years. Critics of China’s economic model have wondered for years if the bill would ever come due. It might be coming due now.
We are watching the trend in commodity prices for hints that pressure on China’s construction activity is beginning to reverberate beyond its borders. So far, there has been little sign of that occurring. Iron ore prices have plunged, but that appears to have been caused primarily by governmentmandated closures of steel plants in an effort to curb pollution.
Even within China itself, investors seem to be taking the Evergrande debacle in stride. The effective yield on the country’s high-yield bonds has been rising sharply since May, but it is nowhere near the 40% yield reached in 2008. It also remains some six percentage points below the high reached in 2011, when the government clamped down on excessive credit growth and rampant speculation in the property and stock markets.
In contrast to high yield, the yield on Chinese investment-grade bonds is currently at its lowest level in the past 20 years—indicating no sign of contagion.
One explanation for the resiliency of the MSCI Emerging Markets Index is the strength of the global economy outside China. The US has been leading the way, but other advanced countries—notably Europe—continue to post improved economic activity.
If history is any guide, however, upside inflation surprises in the G-10 countries suggest that emerging economies will follow suit over the next few months. Unlike advanced countries, where inflation expectations tend to better anchored, central banks in vulnerable emerging economies are forced to raise interest rates sooner than they would prefer in order to dampen inflation pressures and defend their currencies.
Given these concerns, investors might be tempted to avoid emergingmarket equities. We believe that would be a mistake. Valuations, particularly relative to the developed world, look especially cheap.
Globally, the earnings of publicly traded companies generally remain robust; we believe that analysts are still underestimating that strength. With the exception of Japan, earnings estimates for 2021 have been raised dramatically versus just six months ago. Forecasts for 2022 earnings have been cut in half from where they were six months ago, but they still are expected to show mid-to-high single-digit gains.
This lowering of the bar for next year could allow for upward revisions in analysts’ earnings estimates—assuming, as we do, that the renormalisation of global economic growth gets back on track with wider vaccine distribution and a declining COVID-19 wave.
Glossary of Financial Terms
Bear market: A bear market refers to a market environment in which prices are generally falling (or are expected to fall) and investor confidence is low.
Bull market: A bull market refers to a market environment in which prices are generally rising (or are expected to rise) and investor confidence is high.
Cyclical stocks: Cyclical stocks or sectors are those whose performance is closely tied to the economic environment and business cycle. Managers with a pro-cyclical market view tend to favour stocks that are more sensitive to movements in the broad market and therefore tend to have more volatile performance.
Fiscal policy: Fiscal policy relates to decisions about government revenues and outlays, like taxation and economic stimulus.
Fiscal stimulus: Fiscal stimulus refers to government spending intended to provide economic support.
Forward price-to-earnings (PE) ratio: The forward PE ratio is equal to the market capitalisation of a share or index divided by forecasted earnings over the next 12 months. The higher the PE ratio, the more the market is willing to pay for each dollar of annual earnings.
Hawk: Hawk refers to a central-bank policy advisor who has a negative view of inflation and its economic impact, and thus tends to favour higher interest rates.
Inflation-Protected Securities: Inflation-protected securities are typically indexed to an inflationary gauge to protect investors from the decline in the purchasing power of their money. The principal value of an inflation-protected security typically rises as inflation rises, while the interest payment varies with the adjusted principal value of the bond. The principal amount is typically protected so that investors do not risk receiving less than the originally invested principal.
Monetary policy: Monetary policy relates to decisions by central banks to influence the amount of money and credit in the economy by managing the level of benchmark interest rates and the purchase or sale of securities. Central banks typically make policy decisions based on their mandates to target specific levels or ranges for inflation and employment.
Mortgage-Backed Securities: Mortgage-backed securities (MBS) are pools of mortgage loans packaged together and sold to the public. They are usually structured in tranches that vary by risk and expected return.
NextGenerationEU: NextGenerationEU is an economic recovery fund established by the EU and totalling more than €800 billion projected to be spent between 2021 and 2027. The centrepiece of the programme is a €723.8 billion facility for loans and grants to EU countries for investments.
OPEC+: OPEC+ combines OPEC—a permanent intergovernmental organisation of 13 oil-exporting developing nations that coordinates and unifies the petroleum policies of its member countries—with Russia, a major oil exporter, to make collective high-level decisions about oil production levels.
Pandemic Emergency Purchase Programme (PEPP): PEPP is a temporary asset-purchase programme of private and public sector securities established by the European Central Bank to counter the risks to monetary-policy transmission and the outlook for the euro area posed by the COVID-19 outbreak.
Quantitative easing: Quantitative easing refers to expansionary efforts by central banks to help increase the supply of money in the economy.
Sovereign: A sovereign refers to government-issued debt.
Summary of Economic Projections: The Fed’s Summary of Economic Projections (SEP) is based on economic projections collected from each member of the Fed Board of Governors and each Fed Bank president on a quarterly basis.
Taper tantrum: Taper tantrum describes the 2013 surge in US Treasury yields resulting from the US Federal Reserve’s announcement of future tapering of its policy of quantitative easing.
Transitory inflation: Transitory inflation refers to a temporary increase in the rate of inflation.
Yield: Yield is a general term for the expected return, in percentage or basis points (one basis point is 0.01%), of a fixed-income investment.
Yield curve: The yield curve represents differences in yields across a range of maturities of bonds of the same issuer or credit rating (likelihood of default). A steeper yield curve represents a greater difference between the yields. A flatter curve indicates the yields are closer together.
Index Descriptions
The Bloomberg Commodity Index is composed of futures contracts and reflects the returns on a fully collateralised investment in the Index. This combines the returns of the Index with the returns on cash collateral invested in 13-week (3-month) US Treasury bills.
The Employment Cost Index is a quarterly economic series published by the US Bureau of Labor Statistics that details the growth of total employee compensation. The index tracks movement in the cost of labour, as measured by wages and benefits, at all levels of a company.
The MSCI Emerging Markets Index is a free float-adjusted market-capitalisation-weighted index designed to measure the performance of global emerging-market equities.
The MSCI USA Index measures the performance of the large- and mid-cap segments of the US market.
Important Information
Data refers to past performance. Past performance is not a reliable indicator of future results.
Investments in SEI Funds are generally medium- to long-term investments. The value of an investment and any income from it can go down as well as up. Investors may get back less than the original amount invested. Returns may increase or decrease as a result of currency fluctuations. Additionally, this investment may not be suitable for everyone. If you should have any doubt whether it is suitable for you, you should obtain expert advice.
No offer of any security is made hereby. Recipients of this information who intend to apply for shares in any SEI Fund are reminded that any such application may be made solely on the basis of the information contained in the Prospectus. This material represents an assessment of the market environment at a specific point in time and is not intended to be a forecast of future events, or a guarantee of future results. This information should not be relied upon by the reader as research or investment advice regarding the funds or any stock in particular, nor should it be construed as a recommendation to purchase or sell a security, including futures contracts.
In addition to the normal risks associated with equity investing, international investments may involve risk of capital loss from unfavourable fluctuation in currency values, from differences in generally accepted accounting principles or from economic or political instability in other nations. Bonds and bond funds are subject to interest rate risk and will decline in value as interest rates rise. High yield bonds involve greater risks of default or downgrade and are more volatile than investment grade securities, due to the speculative nature of their investments. Narrowly focused investments and smaller companies typically exhibit higher volatility. SEI Funds may use derivative instruments such as futures, forwards, options, swaps, contracts for differences, credit derivatives, caps, floors and currency forward contracts. These instruments may be used for hedging purposes and/or investment purposes.
While considerable care has been taken to ensure the information contained within this document is accurate and up-to-date, no warranty is given as to the accuracy or completeness of any information and no liability is accepted for any errors or omissions in such information or any action taken on the basis of this information.
This information is issued by SEI Investments (Europe) Limited, 1st Floor, Alphabeta, 14-18 Finsbury Square, London EC2A 1BR which is authorised and regulated by the Financial Conduct Authority. Please refer to our latest Full Prospectus (which includes information in relation to the use of derivatives and the risks associated with the use of derivative instruments), Key Investor Information Documents and latest Annual or Semi-Annual Reports for more information on our funds. This information can be obtained by contacting your Financial Adviser or using the contact details shown above.
SEI sources data directly from FactSet, Lipper, and BlackRock, unless otherwise stated.
The opinions and views in this commentary are of SEI only and should not be construed as investment advice.


