Quarterly Market Commentary: Consequences of War Drive Record High Inflation
Investors faced inhospitable conditions on multiple fronts during the first three months of 2022. Global equities delivered their poorest quarterly performance since early 2020—bottoming in mid-March before mounting a sharp partial recovery. Global bonds fared worse, tumbling by the most since late 2016.1
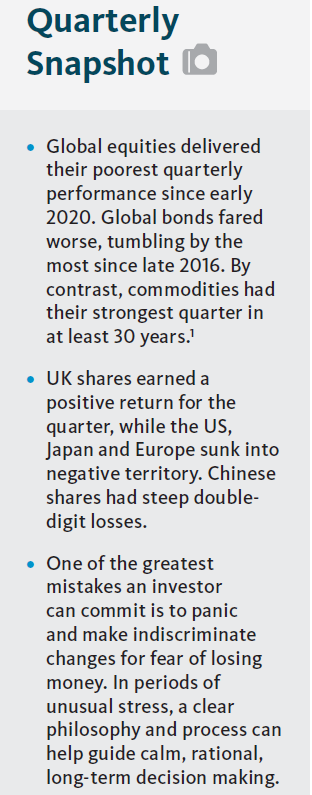
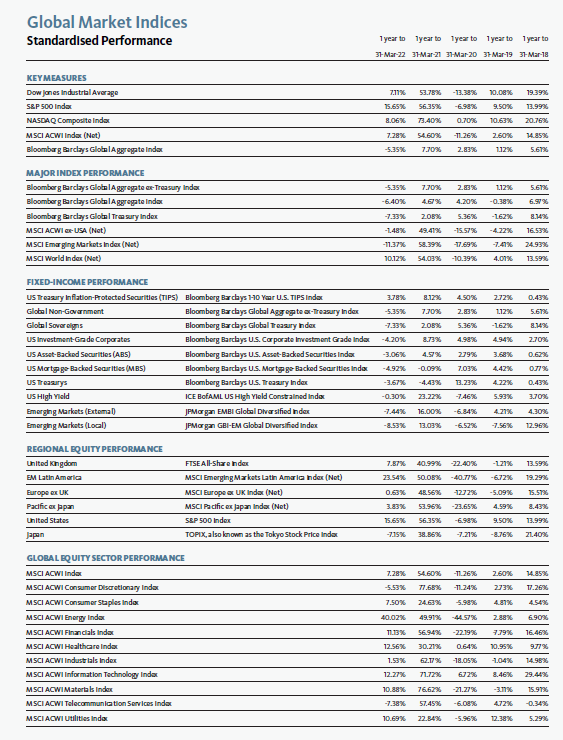
UK shares earned a positive return during the quarter, outpacing other major markets. Hong Kong was slightly negative, while the US, Japan and Europe had steeper losses.
Mainland Chinese shares bounced higher after plummeting from mid-February to mid-March, but still finished the quarter with double-digit losses. The selloff in Chinese equities was most severe in technology companies, forcing Vice Premier Liu He—China’s top economic advisor—to pledge that the government would take a “standardised, transparent and predictable” approach to the regulation of technology; this comes after more than a year of interventions. Beijing also made broader overtures to soothe investors, including prioritising the stability of capital markets, supporting overseas stock listings, and pledging to manage the risks associated with solvency issues plaguing property developers.
Meanwhile, with commodities markets having been the epicentre of the financial fallout from Russia’s attacks on Ukraine, commodities had their strongest quarter in at least 30 years.1 The price of natural gas spiked by more than 50%, while West-Texas Intermediate and Brent crude-oil prices both climbed by over 30%. The price of wheat also increased by more than 30%. Commodity-producing nations, therefore, were the first quarter’s big winners, led at a distance by Latin American equities’ double-digit gains.
On the other side of the spectrum was Russia—the greatest loser by a wide margin—as its aggression against Ukraine opened the door to an expansive set of coordinated economic restrictions, imposed rapidly and with a high degree of uniformity across Western powers. The country’s banishment from global financial systems translated into massive declines in the value of Russian securities.
Government bond rates increased across maturities in the UK, eurozone and US during the first quarter. Shorter-term rates climbed by more than longer-term rates, leading to flatter yield curves across the three jurisdictions. An inversion of US Treasury rates that began at the long end of the yield curve in late 2021 broadened in March to include the 3-year/10-year segment of the curve as well.
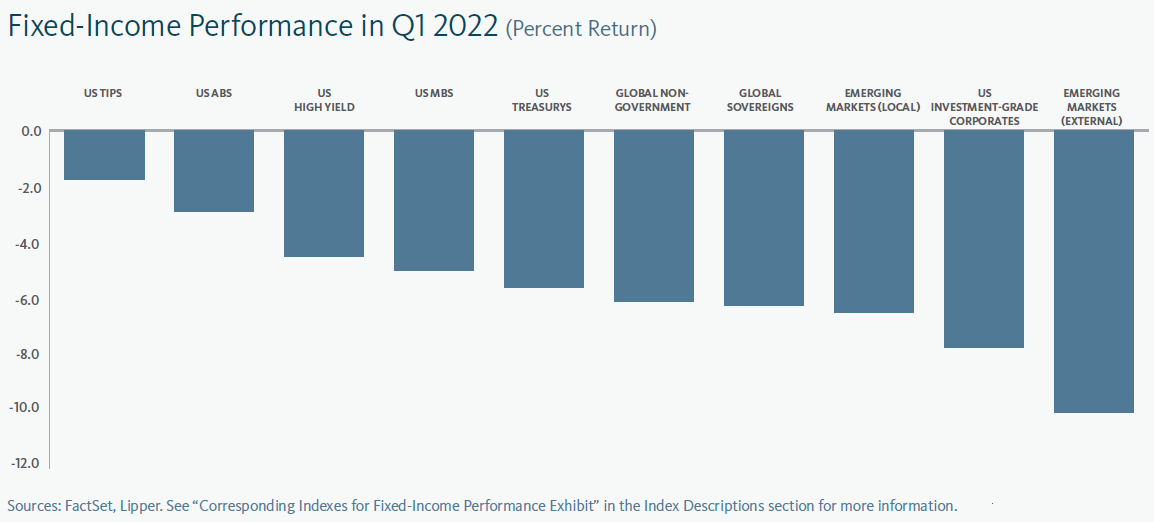
Bonds delivered an array of negative performances as interest rates climbed (yields and prices have an inverse relationship). Inflation-indexed securities had relatively mild declines, while emerging-market debt and investment-grade corporates tumbled dramatically. The longest-term government bonds in advanced economies posted double-digit losses.
In the immediate aftermath of the invasion, the European Commission, France, Germany, Italy, the UK, Canada, and the US committed to taking several actions including removing Russian banks from the SWIFT (Society for Worldwide Interbank Financial Telecommunication) messaging system for financial payments; blocking the Russian Central Bank from deploying its international reserves; limiting the sale of citizenship to wealthy Russians; and launching a transatlantic task force to freeze the assets of sanctioned entities.
The imposition of these coordinated sanctions has effectively blocked Russian entities from trade in major foreign currencies. The Russian Central Bank was forced to increase its benchmark rate by a considerable 10.5%, to 20.0%; offer unlimited liquidity support to banks as they faced runs; raise capital controls on exporters and residents; and shutter its financial markets. 2
By mid-March, the EU had instituted a broad ban on investments in Russia as well as exports to and imports from the country (although imports of Russian metals and energy are still permitted). Russian state-controlled companies across an array of industries are blocked from trading with the EU, while prominent Russian individuals (including business executives, media personalities and oligarchs) faced asset freezes and travel bans.
The US went a step further in banning all new purchases of Russian energy imports, allowing a 45-day wind-down period for existing agreements.
Also in mid-March, Russia legalised the nationalisation of more than 500 airplanes leased to Russian airlines by Western companies. This came after an early-March move to restrict the export of more than 200 products and raw materials until the end of 2022; although its chief commodity exports were not included.
More recently, Russia began to demand ruble payments for gas exports to Europe instead of accepting US dollars or euros, sending European gas prices soaring. The Group of 7 (G7) explicitly rejected the Russian demand in late March. At the end of the quarter, Russia’s Transneft—the largest oil pipeline network in the world— alerted local oil-producing companies that it would cap acceptance of oil that had
not already been sold as storage capacity was full.
The European Commission announced in mid-March that the electricity grids of Ukraine and Moldova were now synchronised with that of Continental Europe rather than with Russia; this was done in an effort to help the two countries reduce their dependence on Russia and improve their electricity system reliability.
Economic Data
UK
- UK manufacturing growth dropped in March to its lowest (albeit still healthy) level since February 2021—falling below the range that defined the fourth quarter of 2021 and the first two months of this year.3
- Growth in the UK services sector accelerated sharply in February and March after a low-growth lull as we moved into the New Year.4
- Inflation climbed to 6.2% in the UK for the 12-month period through February, the highest level since 1992.5
- The UK claimant count (which calculates the number of people claiming Jobseeker’s Allowance) continued to improve in the first two months of the year—declining by roughly 125,000, with total claimants representing 4.4% of the population in February compared to 4.6% in December.
Eurozone
- The expansion in eurozone manufacturing stumbled at the end of the first quarter, diluting an otherwise strong start to the New Year as March delivered the slowest monthly rate of growth since January 2021.6
- Growth in the eurozone services sector cooled to still-healthy levels in March, having accelerated in February after slowing to a near standstill to start the year.7
- The year-over-year rate of consumer price inflation in the eurozone climbed to 7.5% in March, hitting an all-time high for the fifth successive month.8
- Labour-market improvements persisted into 2022—with the eurozone unemployment rate declining to 7.0% in January and 6.8% in February, the lowest level since Eurostat began tracking the dataset in 1998.9
US
- US manufacturing growth started 2022 by continuing to cool from the red hot activity of last summer, bottoming in January before accelerating through February and March.10
- Services-sector growth jumped to notably high levels in March after recovering in February from a near-standstill at the start the year.11
- US joblessness remained on a multi-year downward path, with the March unemployment rate of 3.6% sitting just above the lows attained in late 2019 and early 2020.
- The US Consumer Price Index climbed to 7.9% year over year in February, while the Federal Reserve’s (Fed) Personal Consumption Expenditures (PCE) Price Index (the central bank’s preferred inflation gauge) rose to 6.4%—both measures reaching their highest respective levels since January 1982.12


Central Banks
- The Bank of England’s (BoE) Monetary Policy Committee (MPC) issued three consecutive rate hikes—first in December 2021, then in early February, and finally in mid-March—bringing the bank rate to 0.75%. MPC members voted unanimously in February to begin reducing the size of the BoE’s balance sheet by ceasing to re-invest proceeds from its asset-purchase programme and through corporate bond sales. The wind-down cannot be completed any earlier than toward the end of 2023.
- The European Central Bank (ECB) announced plans following its mid-March meeting to conclude its Asset Purchase Programme in the third quarter after decreasing net purchases from €40 billion in April to €30 billion in May, and then to €20 billion in June. The final net purchases under the Pandemic Emergency Purchase Programme (PEPP) concluded during the first quarter.
- Following Russia’s invasion of Ukraine, ECB President Christine Lagarde pledged that the ECB “will ensure smooth liquidity conditions and access of citizens to cash,” and that it “stands ready to take whatever action is needed to fulfil its responsibilities to ensure price stability and financial stability in the euro area.”13
- The US Federal Open Market Committee (FOMC) voted to increase the federal funds rate by 0.25% in mid-March—its first rate hike since December 2018—after making a final $30 billion round of new asset purchases. The central bank had released a statement in January outlining principles for reducing the size of its balance sheet and stated in March that it “expects to begin reducing its holdings of Treasury securities and agency debt and agency mortgage-backed securities at a coming meeting.” Its latest quarterly Summary of Economic Projections, released in conjunction with its March policy statement, showed a decline in the median real gross domestic product (GDP) projection for 2022 (to 2.8% from 4.0% in December) as well as an increase in broad inflation expectations for 2022 (to 4.3% from 2.6%) and smaller increases for anticipated inflation in 2023 and 2024. The median outlook for the federal-funds rate increased to 1.9% for 2022 (from 0.9% in December) and 2.8% for 2023 (from 1.6%).
- The Bank of Japan’s (BOJ) policy orientation was unchanged following its mid-January and late-March meetings, with its short-term interest rate at -0.1% and the 10-year government-bond-yield target near 0%, as the country’s inflation pressures remained subdued relative to other major developed economies. The global rise in long-term bond yields compelled the BOJ to make standing offers of unlimited 5-to-10-year Japanese government bond (JGB) purchases as the 10-year yield touched 0.25% in late March, reaching a six-year high. Previously, the BOJ announced that it would revert purchases of corporate bonds and commercial paper to pre-pandemic levels beginning in April.
SEI’s View
Three months ago, we noted in our outlook that geopolitical uncertainty was on the rise. The Russian troop build-up on the Ukrainian border topped the list of our near-term concerns, and we warned that an invasion would have major economic consequences.
Like the pandemic that hit with full force this time two years ago, no one knows how long the conflict will last or how extensive its impact will be on the global economy. However, our experience with COVID-19 and the economic and financial response to prior geopolitical events serve as a guide.
Pre-invasion, we were optimistic that global economic growth would remain solid as countries eased their COVID-19-related restrictions. Europe was expected to improve at least as fast as the US, if not faster. This is now a questionable assumption. We cannot emphasise enough how uncertain the economic environment has become. Instead of seeing a normalisation of activity with fewer supply-chain snafus and easing COVID-19 restrictions, we are witnessing a war that is expected to extend and exacerbate the “everything shortage.”
Although Russia’s GDP amounted to just 1.8% of the world’s total in 2020 (about the same as Brazil), its importance as a commodity exporter cannot be denied. Disruption to the supply of several globally traded commodities has had a predictable result: yet another leap in commodity-price inflation.
While supply-chain pressures eased in January and February, they were still at exceptionally high levels relative to history. We think the odds favour a return to their previous peaks as freight carriers suspend Russian bookings and increase rates in response to pileups, higher energy costs, and hazardous geopolitical conditions. COVID-19-related disruptions in Asia also remain an ever-present threat.
It is fortunate for the advanced economies that households and businesses were in mostly good financial shape coming into the crisis. Year-over-year growth in employment was continuing to accelerate heading into 2022 despite the Omicron outbreak. The US, Canada, France, and Italy have been recording gains well ahead of their longer-term trends. Job growth in Germany and
the UK is still at or slightly above the pre-pandemic trend after having experienced smaller year-on-year declines during the 2020 pandemic lockdowns.
Despite this labour-market vibrancy, workers’ wages have begun to fall behind the high inflation rates recorded in the US and elsewhere. One would think that a contraction in real compensation is a sure sign that an economic recession is already underway. Yet that is not the case. Median wage growth in the US for the lowest-income quartile is up 5.9% over the 12 months ended February, nearly matching the rise in the Fed’s PCE Price index for overall personal-consumption expenditures. By comparison, the overall median wage gain for this period
amounted to only 4.3%.
While wage gains are lagging inflation at the upper quartiles, higher-incomegroups have benefited from the boom in home prices and the long bull market in financial assets; they also hold the bulk of excess saving that built up during the pandemic.
Although incomes in the aggregate are not keeping up with inflation, we anticipate that households will draw down savings and increase debt in an effort to maintain living standards. In the US, the household saving rate has already fallen to 6.3% of disposable income from an average of 7.5% over the 2014-to-2019 period. Between 2005 and 2007, by contrast, the saving rate averaged less than 4%. Today, each percentage-point drop in the saving rate would translate into a 4% gain in nominal GDP. Businesses face a similar scenario. The long period of ultra-low interest rates has allowed companies to engage in a refinancing boom. Earnings before interest and taxes in the US non-financial corporate sector cover interest expense 7.9 times, the highest ratio in more than 50 years.14
Meanwhile, Russia’s aggression toward Ukraine has placed government leaders in the US, Europe and other advanced countries in a quandary. They have been tasked with responding urgently to the crisis by providing support while simultaneously pulling back on monetary and fiscal excesses that are partially to blame for the worst inflation in decades. European governments will seek to mitigate the invasion-induced impact of spiking fuel and electricity costs, the influx of Ukrainian refugees, and make a significant upward adjustment in defence spending.
By contrast, the US fiscal response to inflation is likely to be far less robust as it remains bedevilled by political gridlock. Not only has the US registered one the largest increases in emergency spending among the major economies over the last two years, it also has one of the worst inflation problems at a time when the domestic political environment is in an extremely fractious state. Granted, the Democrats and the Republicans in Congress have been able to work together recently to finally enact a budget agreement for the current fiscal year (almost six months late), along with a debt-ceiling increase and a $13.6 billion aid package for Ukraine. It probably will be difficult to pass additional legislation aimed at supporting the domestic economy between now and the November mid-term elections.
Turning to monetary policy, the move toward higher interest rates and the end of quantitative easing appear to be a global trend (with the main exception of Japan).
Households and businesses were in strong financial shape coming into this rate hiking cycle at a time when there is a great deal of pent-up demand. It may well take some time to put a big dent in this economic momentum. Of course, the economy will eventually tip into recession if the Fed and other central banks are forced to raise rates well above the inflation rate. That may happen during the current cycle if inflation proves harder to tamp down than currently anticipated.
There is no denying that these conditions present major challenges for financial assets beyond the uncertainties caused by war. This is especially so for long duration assets such as growth-oriented equities that trade at higher price-to earnings ratios and longer-maturity bonds.
Commodity markets have been surging due to the shortages caused by COVID-19 disruptions, and now by the war in Ukraine. US value stocks have held up relatively well in the year to date, led by a large absolute price gain in the energy sector and better-than-benchmark performances in financials, utilities, industrials, materials and healthcare (as measured by the S&P 500 Index). Meanwhile, technology
companies and equities with high valuations have suffered as earnings multiples contracted amid the climb in bond yields, while the decline in the bond market itself is especially notable.
In emerging markets, Latin America has bucked the trend seen in other geographies as the region generally benefits from the rise in commodity prices. The jump in interest rates in countries like Brazil and Mexico has also stabilized their currencies against the US dollar despite currently high domestic rates of inflation.
Europe and Asia have been comparatively poor performers thus far in 2022. Even before the invasion, the emerging stock markets in Europe were giving ground as tensions ramped up between Russia and Ukraine. Emerging Asia, a major consumer of commodities, also has lost ground. COVID-19 has continued to exert an impact on economic activity. The technology sector in China remains under pressure, although strong government verbal support resulted in a big rally in the middle of March.
Amid all this variability in performance, emerging markets appear to be fertile ground for active management. Volatile environments provide an opportunity for active managers to review exposures in an effort to weed out likely losers from winners.
Periods of crisis and instability are worrying for all investors, particularly as the turn of events in the short term can be difficult to predict. We saw this in the first weeks following Russia’s invasion of Ukraine, as impacts from the crisis overwhelmed more traditional market drivers. During times like these, one of the greatest mistakes an investor can commit is to panic and indiscriminately make changes for fear of losing money. In periods of unusual stress, a clear philosophy and process can guide calm, rational, long-term decision making.
Glossary of Financial Terms
Asset Purchase Programme (APP): The ECB’s APP is part of a package of non-standard monetary policy measures that also includes targeted longer-term refinancing operations, and which was initiated in mid-2014 to support the monetary policy transmissio mechanism and provide the amount of policy accommodation needed to ensure price stability.
Bull market: A bull market refers to a market environment in which prices are generally rising (or are expected to rise) and investor confidence is high.
Commercial paper: Commercial paper is a type of short-term loan that is not backed by collateral and does not tend to pay interest.
European Commission: The European Commission is the executive branch of the European Union. It operates as a cabinet government, with 27 members of the Commission headed by a President.
Fiscal policy: Fiscal policy relates to decisions about government revenues and outlays, like taxation and economic stimulus.
Group of 7 (G7): The G7 is an inter-governmental forum for the leaders of major advanced democratic nations that includes Canada, France, Germany, Italy, Japan, the UK and the US.
Hawk: Hawk refers to a central-bank policy advisor who has a negative view of inflation and its economic impact, and thus tends to favour higher interest rates.
Monetary policy: Monetary policy relates to decisions by central banks to influence the amount of money and credit in the economy by managing the level of benchmark interest rates and the purchase or sale of securities. Central banks typically make policy decisions based on their mandates to target specific levels or ranges for inflation and employment.
Mortgage-Backed Securities: Mortgage-backed securities (MBS) are pools of mortgage loans packaged together and sold to the public. They are usually structured in tranches that vary by risk and expected return.
Pandemic Emergency Purchase Programme (PEPP): PEPP is a temporary asset-purchase programme of private and public sector securities established by the European Central Bank to counter the risks to monetary-policy transmission and the outlook for the euro area posed by the COVID-19 outbreak.
Price-to-earnings (PE) ratio: The PE ratio is equal to the market capitalization of a share or index divided by trailing (over the prior 12 months) or forward (forecasted over the next 12 months) earnings. The higher the PE ratio, the more the market is willing to pay for each dollar of annual earnings.
Quantitative easing: Quantitative easing refers to expansionary efforts by central banks to help increase the supply of money in the economy. Summary of Economic Projections: The Fed’s Summary of economic Projections (SEP) is based on economic projections collected from each member of the Fed Board of Governors and each Fed Bank president on a quarterly basis.
Yield: Yield is a general term for the expected return, in percentage or basis points (one basis point is 0.01%), of a fixed-income investment.
Yield curve: The yield curve represents differences in yields across a range of maturities of bonds of the same issuer or credit rating (likelihood of default). A steeper yield curve represents a greater difference between the yields. A flatter curve indicates the yields are closer together.
Index Descriptions
The Bloomberg Commodity Index is composed of futures contracts and reflects the returns on a fully collateralised investment in the Index. This combines the returns of the Index with the returns on cash collateral invested in 13-week (3-month) US Treasury bills.
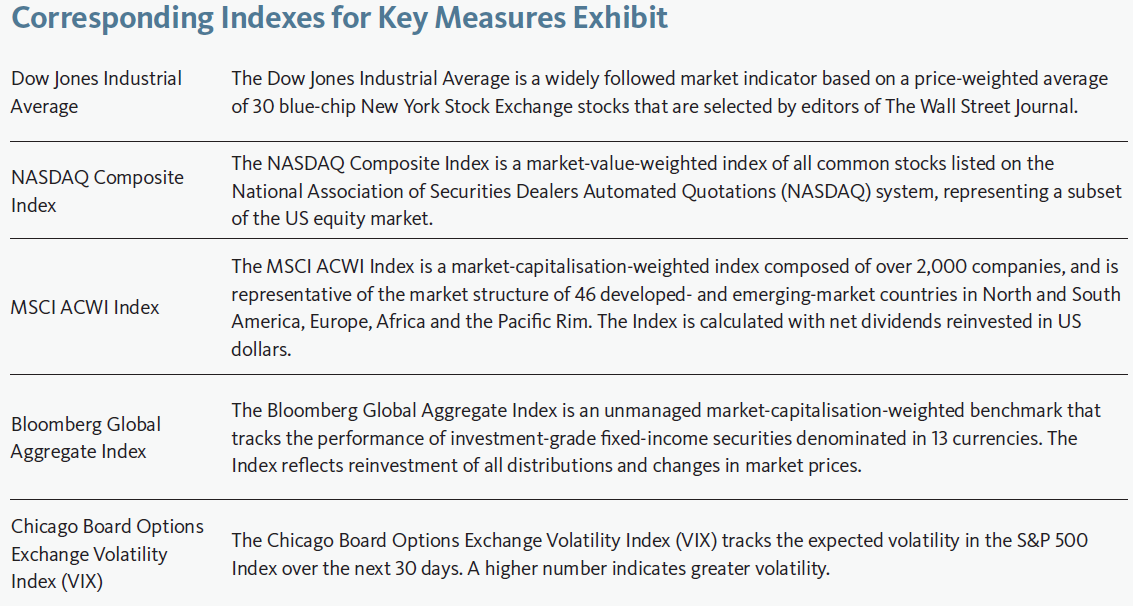
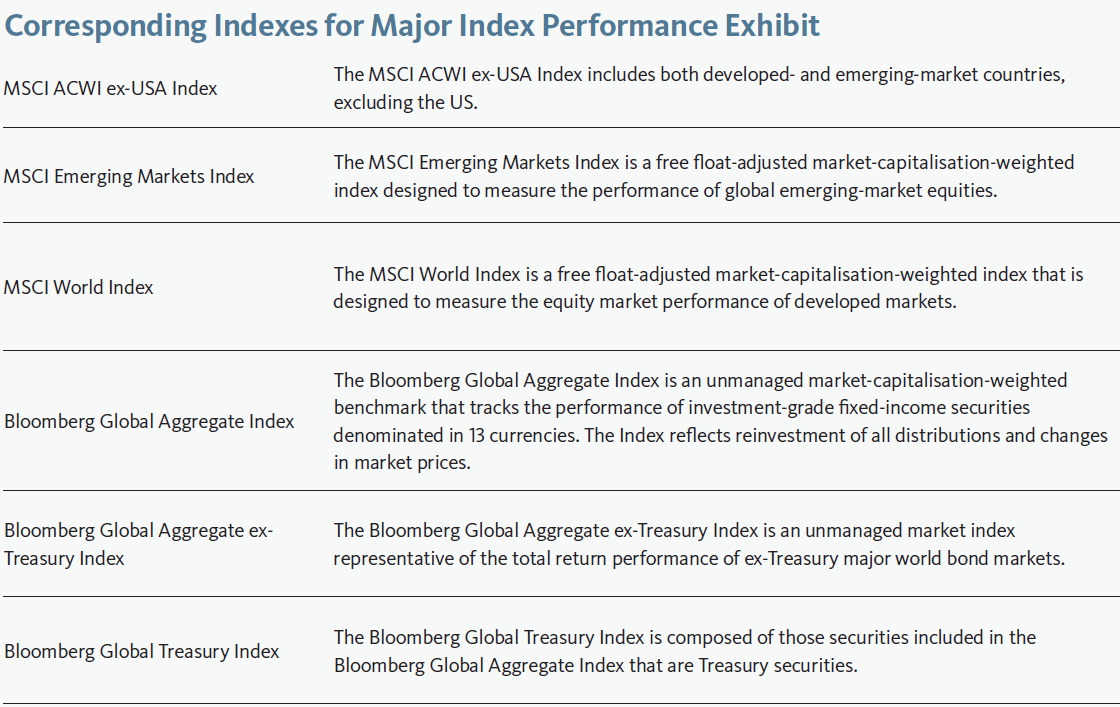
The Bloomberg Global Aggregate Index is an unmanaged market-capitalisation-weighted benchmark that tracks the performance of investment-grade fixed-income securities denominated in 13 currencies. The Index reflects reinvestment of all distributions and changes in market prices.
The US Consumer Price Index (CPI) measures changes in the price level of a weighted-average market basket of consumer goods and services purchased by households. A consumer price index is a statistical estimate constructed using the prices of a sample of representative items whose prices are collected periodically.
The MSCI ACWI Index is a market-capitalisation-weighted index composed of over 2,000 companies, and is representative of the market structure of 46 developed- and emerging-market countries in North and South America, Europe, Africa and the Pacific Rim. The Index is calculated with net dividends reinvested in US dollars.
The US Personal Consumption Expenditures (PCE) Price Index is the primary inflation index used by the Federal Reserve when making monetary-policy decisions
The S&P 500 Index is a market-capitalization-weighted index that consists of 500 publicly-traded large U.S. companies that are considered representative of the broad U.S. stock market.
Important Information
Data refers to past performance. Past performance is not a reliable indicator of future results.
Investments in SEI Funds are generally medium- to long-term investments. The value of an investment and any income from it can go down as well as up. Investors may get back less than the original amount invested. Returns may increase or decrease as a result of currency fluctuations. Additionally, this investment may not be suitable for everyone. If you should have any doubt whether it is suitable for you, you
should obtain expert advice.
No offer of any security is made hereby. Recipients of this information who intend to apply for shares in any SEI Fund are reminded that any such application may be made solely on the basis of the information contained in the Prospectus. This material represents an assessment of the market environment at a specific point in time and is not intended to be a forecast of future events, or a guarantee of future results. This information should not be relied upon by the reader as research or investment advice regarding the funds or any stock in particular, nor should it be construed as a recommendation to purchase or sell a security, including futures contracts.
In addition to the normal risks associated with equity investing, international investments may involve risk of capital loss from unfavourable fluctuation in currency values, from differences in generally accepted accounting principles or from economic or political instability in other nations. Bonds and bond funds are subject to interest rate risk and will decline in value as interest rates rise. High yield bonds involve greater risks of default or downgrade and are more volatile than investment grade securities, due to the speculative nature of their investments. Narrowly focused investments and smaller companies typically exhibit higher volatility. SEI Funds may use derivative instruments such as futures, forwards, options, swaps, contracts for differences, credit derivatives, caps, floors and currency forward contracts. These instruments may be used for hedging purposes and/or investment purposes.
While considerable care has been taken to ensure the information contained within this document is accurate and up-to-date, no warranty is given as to the accuracy or completeness of any information and no liability is accepted for any errors or omissions in such information or any action taken on the basis of this information.
This information is issued by SEI Investments (Europe) Limited, 1st Floor, Alphabeta, 14-18 Finsbury Square, London EC2A 1BR which is authorised and regulated by the Financial Conduct Authority.
SEI sources data directly from FactSet, Lipper, and BlackRock, unless otherwise stated.
The opinions and views in this commentary are of SEI only and should not be construed as investment advice.
Please refer to our latest Prospectus (which includes information in relation to the use of derivatives and the risks associated with the use of derivative instruments), Key Investor Information Document, Summary of UCITS Shareholder rights (which includes a summary of the rights that shareholders of our funds have) and the latest Annual or Semi-Annual Reports for more information on our funds, which can be located at Fund Documents. And you should read the terms and conditions contained in the Prospectus (including the risk factors) before making any investment decision.


