Quarterly Market Commentary: Central bank armada drives markets into storm.
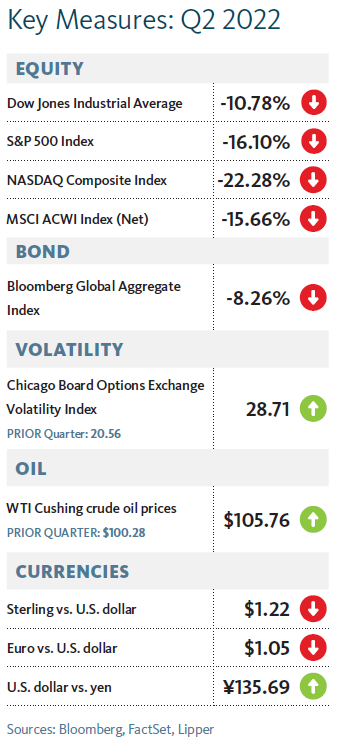
There was no safe harbour from choppy market cross currents during the second quarter. Equities and fixed-interest asset classes alike capsized around the globe, and even commodity prices ran aground as the likelihood of recession increased.
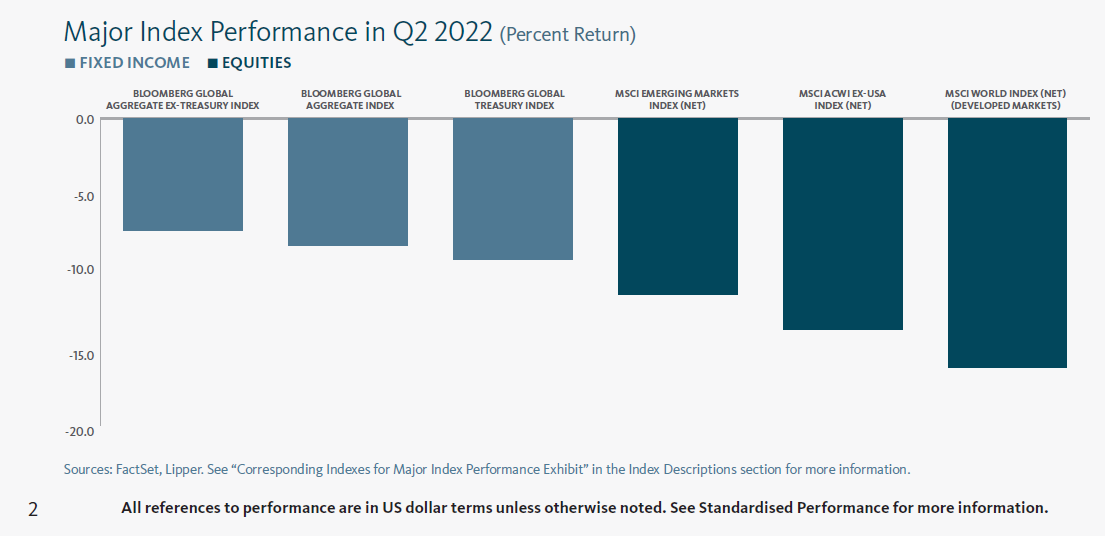
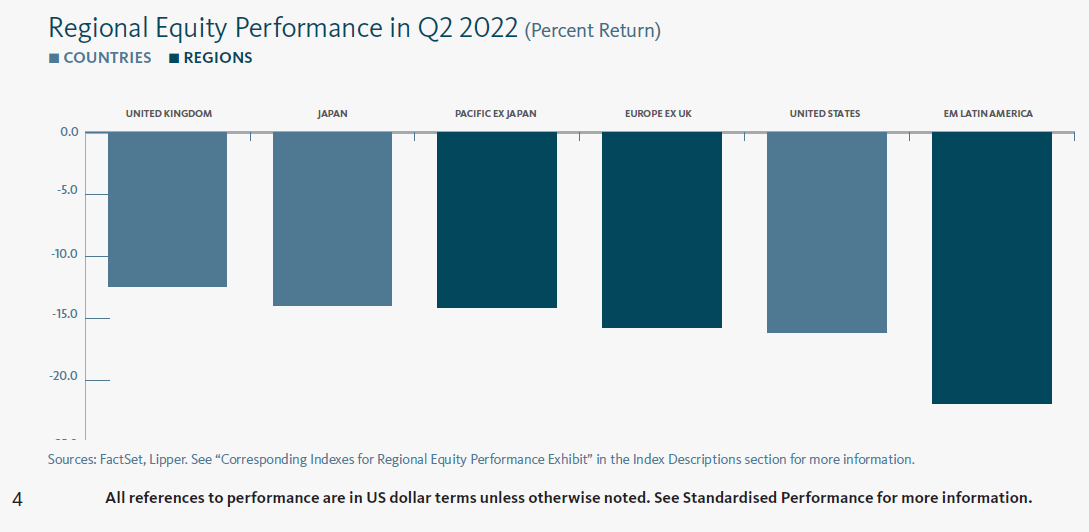
Emerging-market equities fell by double digits during the quarter, although they still fared better than their developed-market counterparts, buoyed by a rebound in China. UK shares posted significant losses, but they were not as steep as those of Japanese or European equities. US shares, meanwhile, had the sharpest drop among major markets as the US dollar appreciated by 6.49% versus a trade-weighted basket of foreign currencies.
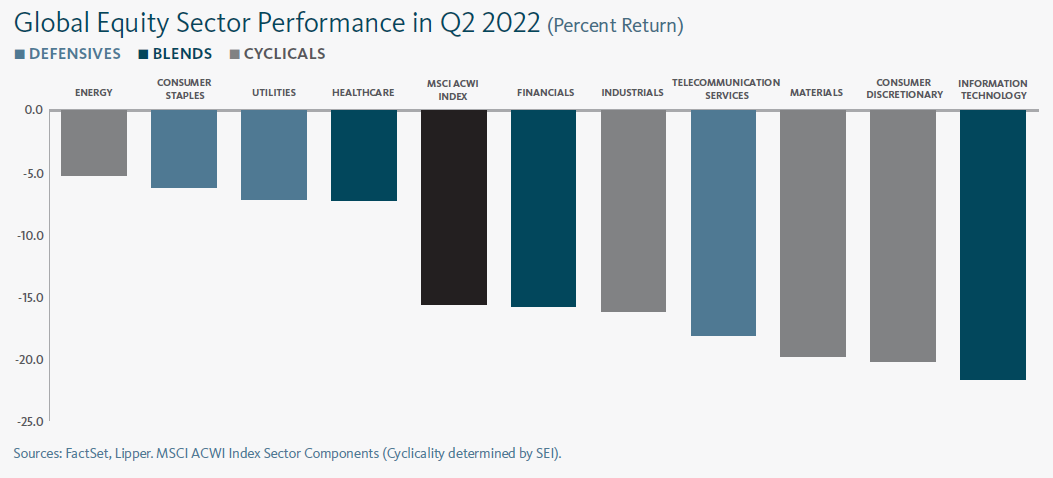
Value-oriented equities tended to fall by less than growth-oriented equities across both large- and small-cap markets, although the performance spread was much wider within larger companies. No sectors were spared from losses, but energy and consumer staples had the mildest declines, while information technology and consumer discretionary had the steepest.1
Government-bond rates climbed throughout the second quarter as prices fell. UK gilt and eurozone government-bonds rates rose across the yield curve, with longer-term rates increasing by more than shorter-term rates. US Treasury yields also increased across the curve, but shorter-term rates outpaced longer-term rates for the full quarter.
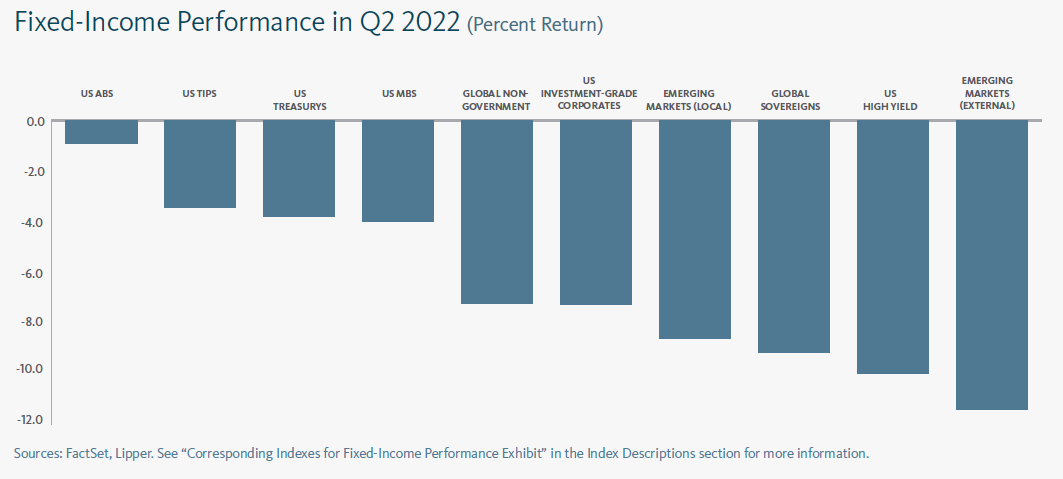
Fixed-interest performance ran the gamut of losses, moving from relatively modest declines for government bonds to more severe losses for emerging-market and high-yield bonds.2
The tide began to turn on commodity markets, as prices began to recede in various commodities from mid-quarter onward. The Bloomberg Commodity Index fell by 5.92% during the second quarter, while Brent and West-Texas Intermediate crude-oil prices climbed by 4.13% and 5.46%, respectively. Natural gas prices fell by 4.43% and wheat prices tumbled by 12.13%. Energy commodity prices peaked in early June, while the high water mark for wheat prices came in mid-May.3
OPEC+ (the Organization of the Petroleum Exporting Countries—plus Russia) agreed at the beginning of June to boost the size of an oil production increase by roughly 50% in July and August, totalling 648,000 new barrels per day.
The European Union (EU) imposed a partial ban on Russian crude oil and petroleum products in early June, blocking seaborne oil shipments but allowing Hungary, Slovakia and the Czech Republic to continue pipeline imports for domestic consumption. In a farther-reaching move, EU companies were banned from providing shipping insurance to transporters of Russian petroleum products—regardless of the destination country—depriving shippers of a critical market for insurers.
Russia began reducing natural gas pipeline supply to Europe in mid-June, limiting its ability to stockpile for winter, and driving prices in the region much higher. The 27 members of the European Council agreed in late June to formally accept Ukraine and Moldova’s candidacies to join the EU, taking the first steps to expand the union since Croatia’s entrance in 2013.4
Toward the end of the quarter, the North Atlantic Treaty Organization (NATO) announced a plan to increase its high-readiness Response Force (NRF) from 40,000 to 300,000 after activating NRF troops for the first time in its history following Russia’s attack on Ukraine.5 Sweden and Finland’s paths to join NATO brightened at the end of June. Turkey unblocked their applications and signed a trilateral memorandum of support for their memberships in exchange for weapons sales, and prioritization by the Scandinavian countries of Turkish extradition requests for purported Kurdish militants.
The US followed NATO’s planned increases with its own European expansion announcement at the end of the quarter. The buildout will include a permanent Army base in Poland, rotations through Romania and the Baltics, more Navy ships in Spain, air defences in Italy, and fighter jets in the UK.
Economic Data
UK
- UK manufacturing activity settled lower throughout the second quarter.
- Manufacturing growth in June was positive, but soft.6
- Growth in the UK services sector cooled during the second quarter from a dizzying peak in March, ending in June at a moderately healthy pace of expansion.7
- Inflation climbed to 9.1% in the UK for the 12-month period through May, the highest level in 40 years.8
- The UK claimant count (which calculates the number of people claiming Jobseeker’s Allowance) continued to improve in recent months—declining by roughly 85,000 from March through May, with total claimants representing 4.0% of the population in May compared to 4.2% in March.
Eurozone
- The expansion in eurozone manufacturing continued to slow throughout the second quarter, ending in June with an anaemic pace of growth.9
- Activity in the eurozone services sector accelerated in April to strong growth territory, before softening to end the quarter with a modest but healthy expansion.10
- The year-over-year rate of consumer price inflation in the eurozone climbed to 8.6% in June, hitting an all-time high.11
- The eurozone unemployment rate held at 6.8% from February through April, before cracking through to 6.6% in May to set a new record low (since Eurostat began tracking the dataset in 1998).12
US
- US manufacturing growth peaked in April after accelerating through early 2022, then cooled (slowly in May, and then sharply in June), leaving a soft expansion at the end of the second quarter.13
- US services-sector growth declined throughout the second quarter, moving from notably high levels in March to a weak expansion in June.14
- The US labour market remained quite healthy during the second quarter. New claims for unemployment benefits trended higher—from roughly 180,000 per week in April to about 230,000 per week in June—but remained low relative to history.
- The US Consumer Price Index climbed to 8.6% year over year in May—the highest rate since December 1981—while the Personal Consumption Expenditures (PCE) Price Index (the Federal Reserve’s preferred inflation gauge) edged down to 6.3%.
Central Banks
- The Bank of England’s (BoE) Monetary Policy Committee (MPC) voted to increase the bank rate by 0.25% at both its May and June meetings, increasing the benchmark rate to 1.25%. It also continued to reduce its balance sheet by ceasing to reinvest proceeds from its asset-purchase programme, with an expected £3.2 billion in redemptions for July 2022.
- The European Central Bank (ECB) concluded new purchases in its Asset Purchase Programme (APP) with net purchases of €40 billion in April, €30 billion in May, and €20 billion in June. Following its early June meeting, the central bank announced it would cease new purchases in the APP and intended to increase benchmark rates in July and September. The spectre of rising rates sent government bond spreads higher for economically weaker European countries—like Italy, Greece and Spain. The ECB convened an unscheduled meeting in mid-June to ensure markets it would intervene to avoid the fragmentation of the European government bond market.
- The US Federal Open Market Committee (FOMC) increased the federalfunds rate by 0.50% (the first hike of its size since 2000) at its early-May meeting, and then by 0.75% (the first of its size since 1994) at its mid-June meeting, bringing the benchmark rate to a range between 1.50% and 1.75%.15 The central bank also announced plans to reduce its balance sheet in June, allowing Treasurys and mortgages to run off (that is, mature without being replaced) at maximum respective paces of $60 billion and $35 billion per month. Economic fundamentals deteriorated in the FOMC’s latest quarterly Summary of Economic Projections (SEP), released in June. Real GDP projections declined for 2022, 2023, and 2024 compared to the March SEP, while projections for the unemployment rate increased across all three years, and inflation expectations increased for 2022. Projections for the federal funds rate were higher across the board as well.
- The Bank of Japan (BOJ) redoubled its commitment to loose policy at its April and June meetings. Its short-term interest rate remained at -0.1%, and the 10-year Japanese government-bond (JGB) yield target held near 0%. The central bank continued to offer unlimited purchases of 10-year JGBs at 0.25% in order to keep its yield within the BOJ’s acceptable range.
SEI’s View
It’s been our mantra for the past year that US inflation would be higher for longer than most economists and investors appeared to expect. We believe this remains the case, although the gap between our expectations and those priced in US markets has narrowed considerably and the pace of inflation’s increase is almost certainly close to a peak. Investors and the Fed still seem to be betting that inflation pressures will ebb significantly starting in the second half of this year and fall to 3% by the end of 2023.
Fed Chairman Jerome Powell continued to expresses hope that the Fed can achieve a “softish” landing, where inflation gradually decelerates back to the central bank’s 2% target without a recession. Unfortunately, there has been only 15 one successful instance since the end of World War II (1951-to-1952) when inflation was running above 5%.16
Federal funds-rate futures indicate that investors are anticipating a series of increases between now and year-end that would bring the funds rate to 3.4%. The peak is indicated to be between 3.75% and 4% a year from now. Markets are presumably pricing in a recession by the second half of 2023, considering the funds rate is projected to decline at that point. We believe this to be a reasonable forecast, but the actual outcome will depend on how quickly the economy actually weakens and inflation ebbs. The evidence as of today suggests that the US economy may continue to show a resilience that surprises both the Fed and investors.
There are signs of economic trouble ahead. The surge in US mortgage rates is delivering a big blow to the housing market. Beyond real estate, economists have begun citing the big increase in retail inventories as a harbinger of recession. We are doubtful that the inventory problems of department stores and general merchandisers are serious enough to throw the economy into recession in the near term.
There is no denying that rising interest rates will slow economic growth. But changes in monetary policy affect the economy with a long and variable lag. While the financial strength of US businesses and households is likely to ebb, the starting point is a very high one. The labor market, for instance, remains exceptionally tight. Until a better balance between the demand and supply of labor is achieved, one should expect further large wage gains at the lower end of the wage-income spectrum, where the job market is tightest.
American job switchers have enjoyed a sharper-than-average wage gain of 7.5% over the past 12 months. It should not be surprising that the U.S. quit rate is significantly higher than in 2019 or at the previous economic peak in 2007.
Other major developed economies aren’t too far behind. The UK has an unemployment rate below 4%. Canada and Europe usually have unemployment rates that are considerably higher than the US and the UK. That remains the case, but both report jobless totals that are below previous cyclical lows.
All this suggests that workers are in a strong position to seek bigger wage gains in an effort to keep up with inflation. The possibility of a global wage-price spiral still cannot be dismissed out of hand. This could force central banks to raise interest rates more than they would prefer.
In Europe, the need to hike interest rates has once again raised the specter of another periphery debt crisis. Italian 10-year bonds are trading some 70 basis points higher against German bunds than they were at the start of the year. This is on top of the two percentage-point jump in German rates that has been logged over the same six-month stretch.
The stress has not reached the crisis levels of the 2010-to-2012 period. Given all the other problems facing Europe, the ECB has vowed to support the weaker members of the eurozone with continued bond purchases.
As was the case last time, the economic priorities of the strongest countries are diverging from their weaker neighbors. The German-led bloc needs a more aggressive policy tightening along the lines of what the Fed is expected to do. Meanwhile, the weaker countries, Italy and Greece especially, now bear an even heavier debt burden relative to the size of their economies than was the case a decade ago. The interest expense on that debt could get out of hand fairly quickly if the cost of capital continues its sharp upward trajectory.
The ECB is so concerned about the situation that it actually held an emergency meeting the same day as the Fed’s interest-rate announcement in order to assure markets that it is working on an “anti-fragmentation tool” that will keep spreads narrow while still allowing the central bank to fight inflation.
On a more positive note, China’s economy appears to be in recovery mode. COVID-19 lockdowns in Beijing, Shanghai and other parts of the country have eased. The zero-COVID policy pursued by the Chinese government has hurt the economy to an extent seldom seen in the past three decades.
Home sales have also plummeted, falling 34% over the 12 months ended May. Chinese authorities are now trying to revive the property market by lowering mortgage rates, cutting mortgage down payment requirements and encouraging banks to start lending again.
Economy-wide lending has picked up, finally turning positive for the first time in a year. If that trend continues in the months ahead, other measures of current economic health should begin to recover too. Whether that will be enough to stave off a global recession is doubtful, however, in view of the rising interestrate trend in the advanced economies. It might even prove counterproductive if a revival in Chinese demand for energy and other raw materials exacerbates the commodity-price boom at a time when global supplies are still constrained.
The poor performance of financial markets this year suggests that investors have already discounted a lot of bad news. The price decline in the S&P 500 Index recorded in the year-to-date contrasts sharply with the ongoing increases in forward-earnings estimates. The result has been one of the sharpest reductions in stock multiples outside of a recession in the past 25 years.17
The froth certainly appears to have been taken out of the markets by this year’s pullback. That’s the good news. The bad news is that an economic recession and a corresponding decline in earnings might not yet be fully reflected in stock prices. Multiples tend to slide as projected earnings estimates fall. Even if price-to-earnings ratios remain at current levels, there could be a decline in projected earnings—and a comparable drop in stock prices—as analysts incorporate a recession’s impact into their models. While the consensus view is that stock prices face rough seas ahead, it is possible that earnings multiples do not need to contract much further than they have already—with the caveat that bond yields stabilize near current levels and do not climb significantly higher.
Glossary of Financial Terms
Anti-fragmentation tool: An anti-fragmentation tool refers to the ECB’s plans to mitigate widening spreads between German government bond yields and those of economically weaker EU members.
Asset Purchase Programme (APP): The ECB’s APP is part of a package of non-standard monetary policy measures that also includes targeted longer-term refinancing operations, and which was initiated in mid-2014 to support the monetary policy transmission mechanism and provide the amount of policy accommodation needed to ensure price stability.
Bull market: A bull market refers to a market environment in which prices are generally rising (or are expected to rise) and investor confidence is high.
Commercial paper: Commercial paper is a type of short-term loan that is not backed by collateral and does not tend to pay interest.
European Commission: The European Commission is the executive branch of the European Union. It operates as a cabinet government, with 27 members of the Commission headed by a President.
Fiscal policy: Fiscal policy relates to decisions about government revenues and outlays, like taxation and economic stimulus.
Group of 7 (G7): The G7 is an inter-governmental forum for the leaders of major advanced democratic nations that includes Canada, France, Germany, Italy, Japan, the U.K. and the U.S.
Hawk: Hawk refers to a central-bank policy advisor who has a negative view of inflation and its economic impact, and thus tends to favor higher interest rates.
Monetary policy: Monetary policy relates to decisions by central banks to influence the amount of money and credit in the economy by managing the level of benchmark interest rates and the purchase or sale of securities. Central banks typically make policy decisions based on their mandates to target specific levels or ranges for inflation and employment.
Mortgage-Backed Securities: Mortgage-backed securities (MBS) are pools of mortgage loans packaged together and sold to the public. They are usually structured in tranches that vary by risk and expected return.
NATO: The North Atlantic Treaty Organization (NATO) is an intergovernmental military alliance among 28 European countries and 2 North American countries.
Pandemic Emergency Purchase Programme (PEPP): PEPP is a temporary asset-purchase program of private and public sector securities established by the European Central Bank to counter the risks to monetary-policy transmission and the outlook for the euro area posed by the COVID-19 outbreak.
Price-to-earnings (PE) ratio: The PE ratio is equal to the market capitalization of a share or index divided by trailing (over the prior 12 months) or forward (forecasted over the next 12 months) earnings. The higher the PE ratio, the more the market is willing to pay for each dollar of annual earnings.
Quantitative easing: Quantitative easing refers to expansionary efforts by central banks to help increase the supply of money in the economy.
Summary of Economic Projections: The Fed’s Summary of Economic Projections (SEP) is based on economic projections collected from each member of the Fed Board of Governors and each Fed Bank president on a quarterly basis.
Yield: Yield is a general term for the expected return, in percentage or basis points (one basis point is 0.01%), of a fixed-income investment.
Yield curve: The yield curve represents differences in yields across a range of maturities of bonds of the same issuer or credit rating (likelihood of default). A steeper yield curve represents a greater difference between the yields. A flatter curve indicates the yields are closer together.
Index Descriptions
The Bloomberg Commodity Index is composed of futures contracts and reflects the returns on a fully collateralized investment in the Index. This combines the returns of the Index with the returns on cash collateral invested in 13-week (3-month) U.S. Treasury bills.
The Bloomberg Global Aggregate Index is an unmanaged market-capitalization-weighted benchmark that tracks the performance of investment-grade fixed-income securities denominated in 13 currencies. The Index reflects reinvestment of all distributions and changes in market prices.
The U.S. Consumer Price Index (CPI) measures changes in the price level of a weighted-average market basket of consumer goods and services purchased by households. A consumer price index is a statistical estimate constructed using the prices of a sample of representative items whose prices are collected periodically.
The MSCI ACWI Index is a market-capitalization-weighted index composed of over 2,000 companies, and is representative of the market structure of 46 developed- and emerging-market countries in North and South America, Europe, Africa and the Pacific Rim. The Index is calculated with net dividends reinvested in U.S. dollars.
The U.S. Personal Consumption Expenditures (PCE) Price Index is the primary inflation index used by the Federal Reserve when making monetary-policy decisions.
The S&P 500 Index is a market-capitalization-weighted index that consists of 500 publicly-traded large U.S. companies that are considered representative of the broad U.S. stock market.
Important Information
Data refers to past performance. Past performance is not a reliable indicator of future results.
Investments in SEI Funds are generally medium- to long-term investments. The value of an investment and any income from it can go down as well as up. Investors may get back less than the original amount invested. Returns may increase or decrease as a result of currency fluctuations. Additionally, this investment may not be suitable for everyone. If you should have any doubt whether it is suitable for you, you should obtain expert advice.
No offer of any security is made hereby. Recipients of this information who intend to apply for shares in any SEI Fund are reminded that any such application may be made solely on the basis of the information contained in the Prospectus. This material represents an assessment of the market environment at a specific point in time and is not intended to be a forecast of future events, or a guarantee of future results. This information should not be relied upon by the reader as research or investment advice regarding the funds or any stock in particular, nor should it be construed as a recommendation to purchase or sell a security, including futures contracts.
In addition to the normal risks associated with equity investing, international investments may involve risk of capital loss from unfavourable fluctuation in currency values, from differences in generally accepted accounting principles or from economic or political instability in other nations. Bonds and bond funds are subject to interest rate risk and will decline in value as interest rates rise. High yield bonds involve greater risks of default or downgrade and are more volatile than investment grade securities, due to the speculative nature of their investments. Narrowly focused investments and smaller companies typically exhibit higher volatility. SEI Funds may use derivative instruments such as futures, forwards, options, swaps, contracts for differences, credit derivatives, caps, floors and currency forward contracts. These instruments may be used for hedging purposes and/or investment purposes.
While considerable care has been taken to ensure the information contained within this document is accurate and up-to-date, no warranty is given as to the accuracy or completeness of any information and no liability is accepted for any errors or omissions in such information or any action taken on the basis of this information.
This information is issued by SEI Investments (Europe) Limited, 1st Floor, Alphabeta, 14-18 Finsbury Square, London EC2A 1BR which is authorised and regulated by the Financial Conduct Authority.
SEI sources data directly from FactSet, Lipper, and BlackRock, unless otherwise stated.
The opinions and views in this commentary are of SEI only and should not be construed as investment advice.
Please refer to our latest Prospectus (which includes information in relation to the use of derivatives and the risks associated with the use of derivative instruments), Key Investor Information Document, Summary of UCITS Shareholder rights (which includes a summary of the rights that shareholders of our funds have) and the latest Annual or Semi-Annual Reports for more information on our funds, which can be located at Fund Documents. And you should read the terms and conditions contained in the Prospectus (including the risk factors) before making any investment decision.


