Peeking at possible peaks (Long Version)
Economists have been spending much of their time this year arguing when or if economic growth, inflation, corporate profits, interest rates and equities will peak. Optimists and pessimists alike have been confounded by the ebb and flow of the data and the gyrations of the financial markets. Waiting for a decisive break in the U.S. economy, for example, has been akin to “waiting for Godot.”1
Recession on the horizon?
Recession calls began popping up in the first half of 2022 when inflation-adjusted gross domestic product (GDP) slipped modestly for two consecutive quarters. According to a survey of 45 professional forecasters conducted by the National Association of Business Economics (NABE) in September of last year, 13% of respondents thought a recession was already underway at the time or would begin before the end of 2022, and 40% of respondents predicted that a recession would occur in 2023, with the most likely start date in the January-to-March period.2 Those predictions have been proven to be way off of the mark.
The latest survey by NABE, conducted in April this year and published in May, shows that the soothsayers are gamely sticking to their recession call, with 59% of respondents seeing a better-than-even chance for an economic downturn, most likely before the end of this year. Will this forecast be any more accurate than the one made eight months prior? Of course, we will have to wait and see. But there are no signs currently suggesting that the economy is about to fall off a cliff.
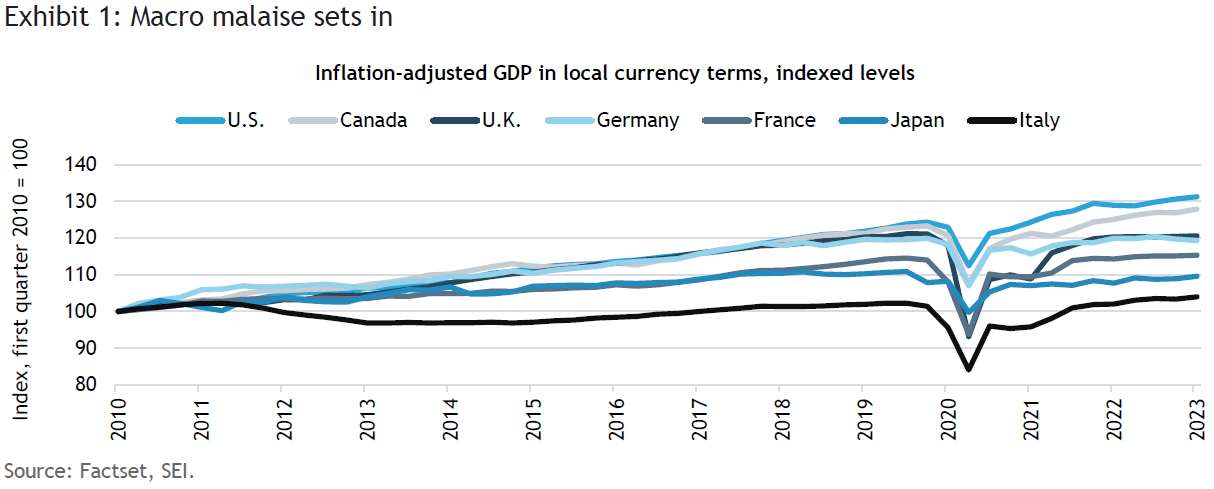
As shown in Exhibit 1, the other members of the G-7 group of large, advanced economies continue to slog along. Germany is the first country to register a year-over-year decline in inflation-adjusted GDP (-0.5% as of the first quarter of 2023) since the recovery out of the 2020 pandemic-induced global downturn. The U.K’s economy has treaded water over the same period, rising just 0.2% through the first quarter. Canada (+2.2%) and Italy (+1.9%), by contrast, have outpaced the 1.8% gain achieved by the U.S. Real GDP in Germany, the U.K., and Japan remain below their respective 2019 pre-pandemic peaks.
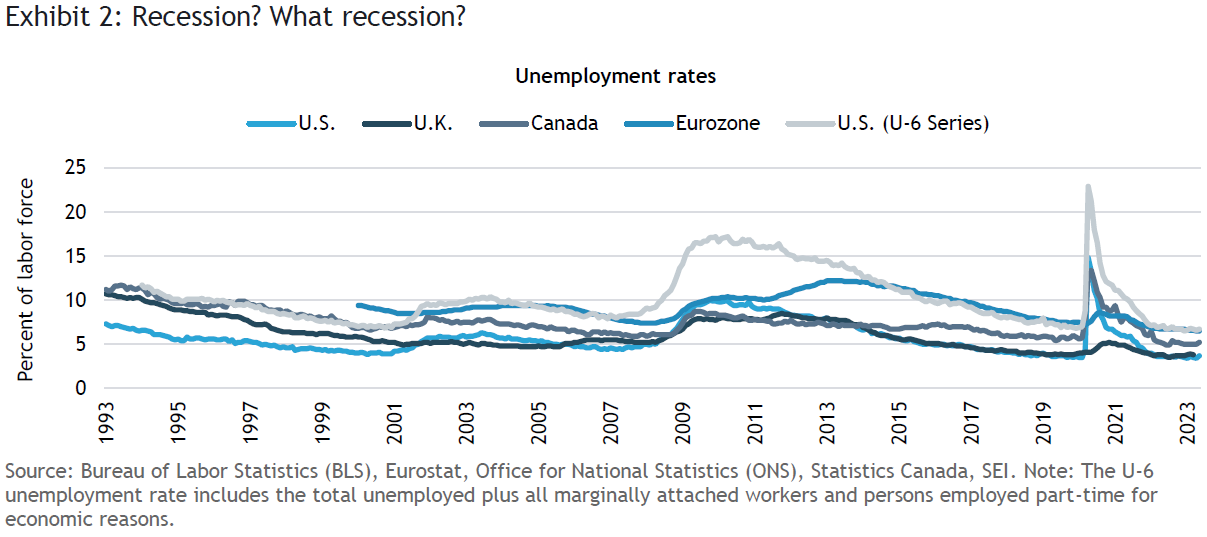
As illustrated in Exhibit 2, unemployment rates in North America, Europe, and the U.K. remain exceptionally low despite the slowing of overall economic growth. Even the broadest measure for the U.S. (the so-called U-6 unemployment rate) is hovering near a 30-year low. If you look hard enough, you can see a slight uptick in the jobless rate for the U.S., the U.K., and Canada. But in all three countries, unemployment remains near all-time lows. The unemployment rate in the eurozone is structurally higher versus the U.S., the U.K. and Canada. However, compared to its own history, the eurozone’s jobless rate has never been lower since the creation of the common-currency area in 1999.
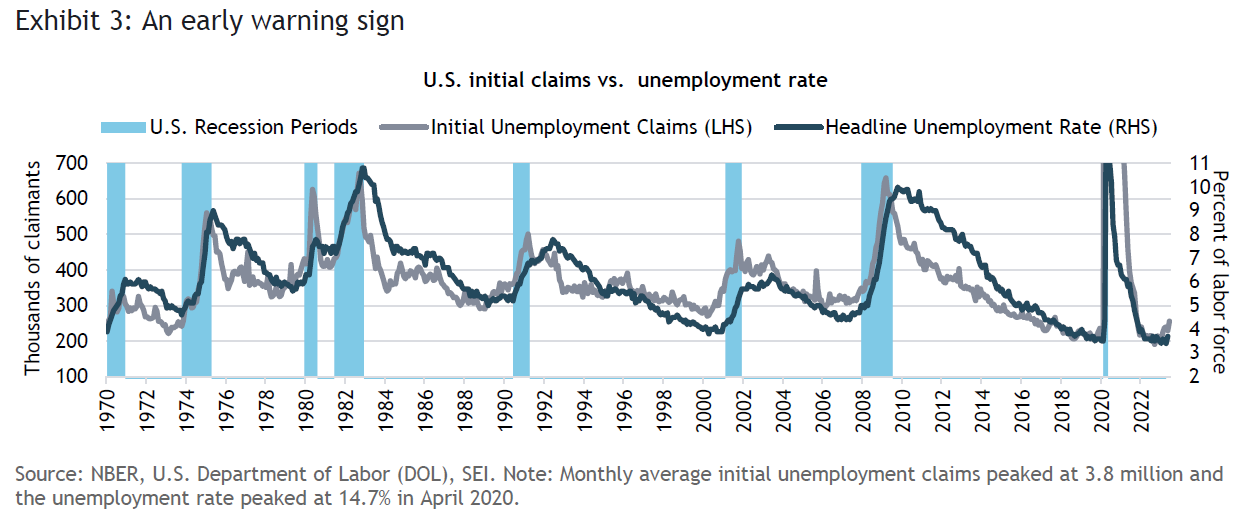
It is true that the unemployment rate is a lagging indicator of the health of the labor market. Initial unemployment claims, on the other hand (highlighted in Exhibit 3), are a leading indicator of labor-market and general economic trends. The latest monthly reading for the U.S. suggests that the jobs market is starting to soften. If unemployment insurance claims continue to deteriorate, history suggests that the economy could fall into recession, perhaps later this year. On a weekly basis, initial claims climbed in June to their highest level since October 2021. A move in initial jobless claims into the 350,000-to-400,000 range correlates with the beginning of an economic downturn. Current levels are still well below that range.
What about other leading indicators of economic activity? The Conference Board’s Composite Index of Leading Economic Indicators (LEI) is painting a fairly dark picture. Exhibit 4 shows the LEI versus the Composite Index of Coincident Indicators.3 The LEI peaked in December 2021 and has been in sharp decline since April 2022. It has already fallen far enough and long enough to be consistent with a recession. In the six-month period ending May 31 of this year, only two of the 12 components—stock prices and builders’ permits—have posted gains. The biggest losing components are the ISM (Institute for Supply Management) New Orders Index and consumer expectations for business conditions. Nonetheless, the coincident indicators, which track the current health of the real economy, are still advancing with hardly a pause.
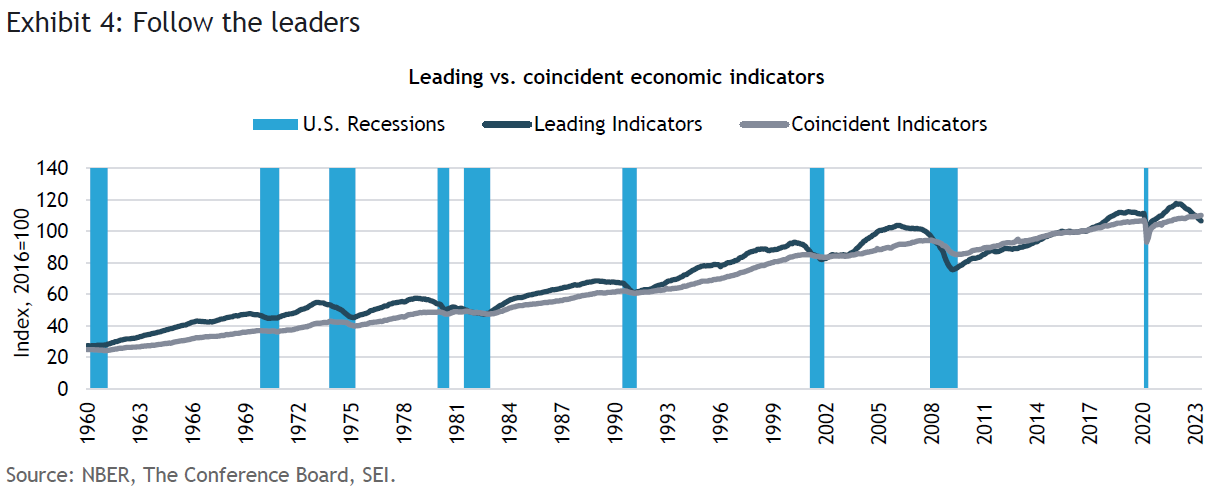
The 12 components of the Leading Economic Indicators include average weekly hours in manufacturing, average weekly initial claims for unemployment insurance, manufacturers’ new orders for consumer goods and materials, the ISM new orders index, manufacturers’ new orders for non-defense capital goods excluding aircraft, building permits for new private housing units, stock prices (the S&P 500), the Leading Credit Index, the interest-rate spread (10-year Treasury bonds minus the federal funds rate, and average consumer expectations for business and economic conditions. The Index of Coincident Indicators tracks non-farm payroll employment, inflation-adjusted personal income less transfer payments, industrial production and inflation-adjusted manufacturing and trade sales.
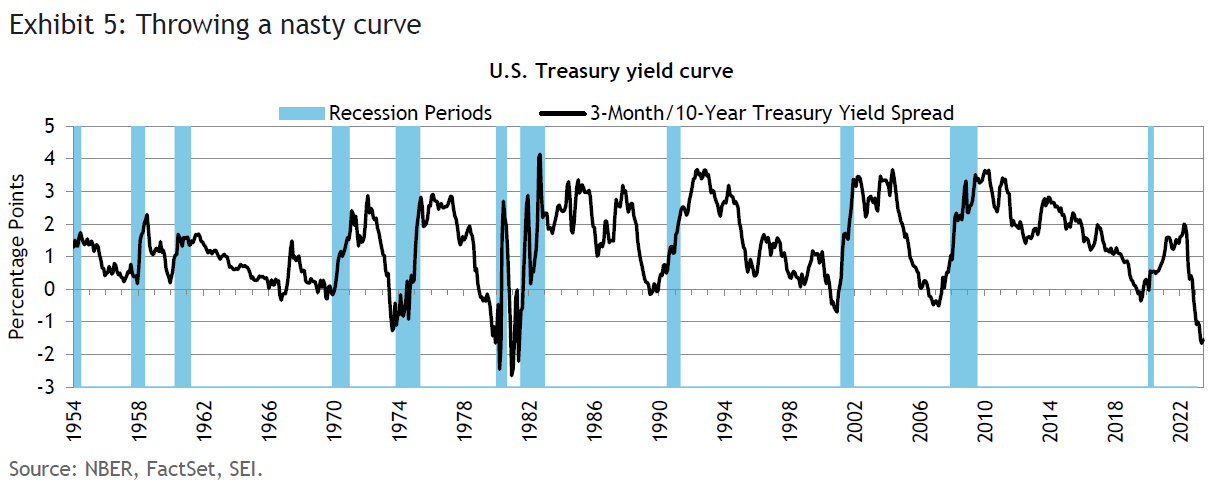
The U.S. Treasury yield curve, one of the best predictors of U.S. economic downturns over the past seven decades, has been inverted since November 2022, as indicated in Exhibit 5. The magnitude of the inversion, with the three-month Treasury bill rate more than 1.5 percentage points above the 10-year Treasury note yield, rivals the inversions preceding the severe recessions of 1973-1975, 1980, and 1981-1982. Since an inversion of the yield curve has often occurred a year or less before the onset of an economic recession, it is understandable why economists have underestimated the economy’s resiliency.
In order to gain a global perspective, we rely on the Organisation for Economic and Development’s (OECD) version of the Leading Economic Indicators index. The economic series used for each country differs based on data availability and how well they relate to turning points in their respective economies. The index in Exhibit 6 is composed of 12 advanced economies that represent the largest members of the OECD, as well as the six largest non-member, developing economies.4 The chart shows the share of countries that have an amplitude-adjusted Composite Leading Indicator value greater than 100, meaning that economic growth is above average. As of April 2023, only Japan, Mexico, and Turkey were in the better-than-average growth category. The U.K., Indonesia, and Canada appear to be in the weakest position. We think it is safe to say that the global economy is not firing on all cylinders.
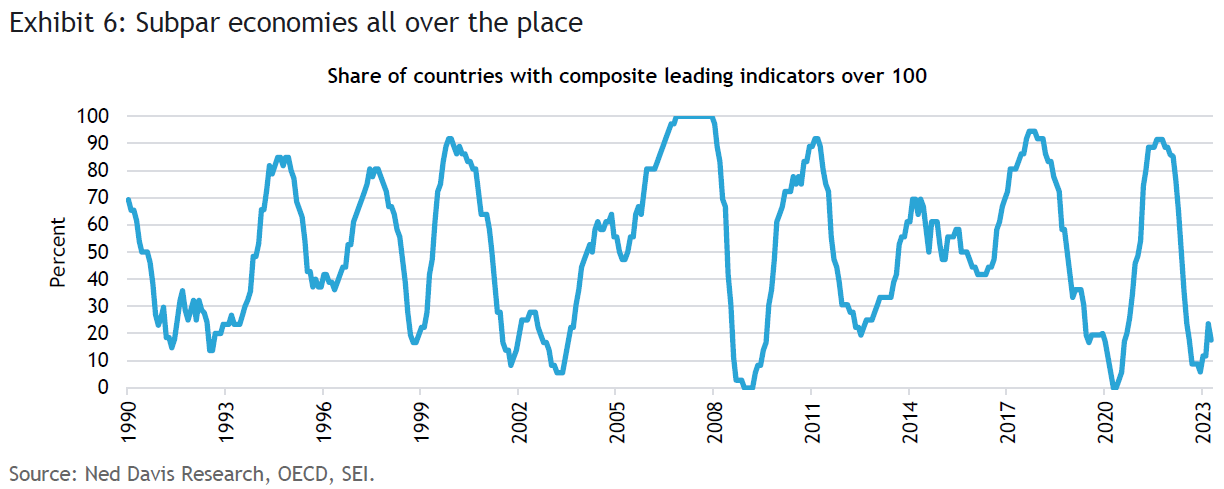
On the brighter side, there has been some easing of downward pressure in recent months. The OECD’s Leading Economic Indicators index hit a low in November 2022, and has been on the rise since. Global growth is still below trend, but it appears to be improving. In May, nearly two-thirds of the component countries recorded month-over-month increases in their amplitude-adjusted Composite Leading Indicators, the best reading since August 2021. By this measure, at least, the global economy might be closer to a trough than to a peak when it comes to real GDP growth. Count us as skeptics, however.
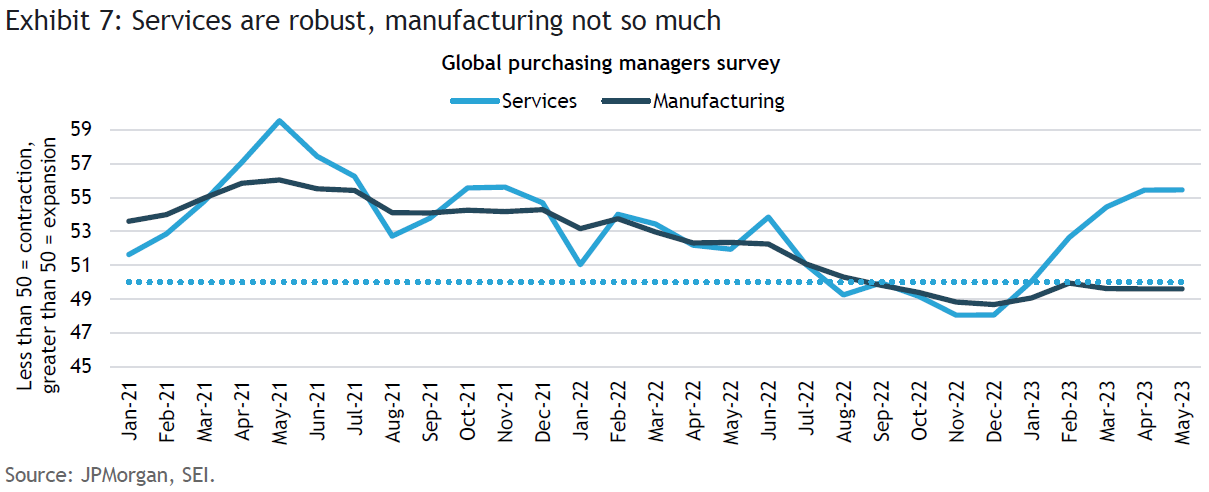
In SEI’s view, the surprising resilience of the global economy simply reflects the long tail of the post-COVID recovery. It also explains the big divergence in the fortunes of the services sector versus manufacturing. Exhibit 7 compares the Purchasing Managers Index for manufacturing versus the index for services for the global economy. Services are clearly keeping the global economy afloat, while manufacturing stagnates or declines. Almost every country and region covered by the survey exhibits a similar pattern of services activity outpacing manufacturing by a significant margin.
Household spending patterns have been distorted since the beginning of the COVID-19 pandemic. In 2020, purchases were concentrated in goods and services that helped people cope with lockdowns and a work-at-home regimen. With COVID fading as a health threat, consumers have been making up for lost time, adopting a more mobile lifestyle, thereby placing intense pressure on labor-intensive, consumer-facing industries such as restaurants, airlines, hotels and entertainment/sporting events.
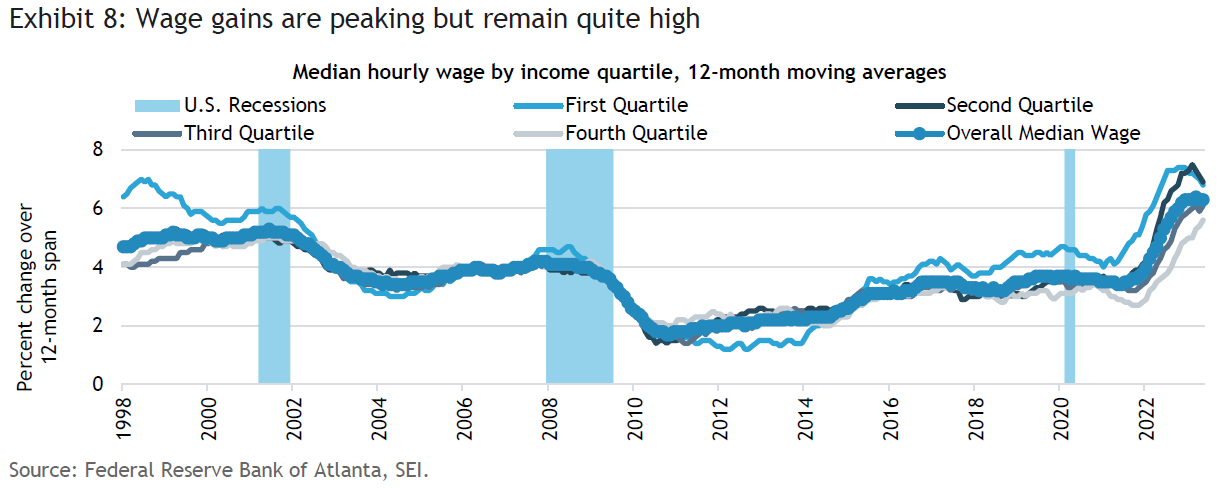
Many economists wonder how much longer consumers can maintain such a robust level of spending. U.S. households are still benefiting from a relatively strong labor market and wage gains. Exhibit 8 shows the Atlanta Federal Reserve wage-tracker data sorted by income. The first quartile represents the lowest-paid 25% of wage earners, while the fourth quartile is composed of the highest-paid 25%. The first and second quartiles of wage earners are still receiving median-wage pay increases close to 25-year highs. The higher-paid quartiles have lagged, but they’ve been doing relatively better in 2023. The overall median wage gain equals 6.3% versus the U.S. headline consumer-price inflation rate of 4.0% as of May; therefore, overall wage income is positive in real terms.
Although households at the lower end of the income spectrum mostly have run through their emergency pandemic support payments, the still-buoyant wage trend has provided the wherewithal to keep spending. At the upper end of the income scale, inflation-adjusted gains are smaller, but have turned positive this year. In addition, there are still excess savings on the balance sheets of the more affluent households. Estimates of the amount of those savings and of untapped home-equity balances could theoretically support roughly eight months of consumption for the top 20% of income earners.5
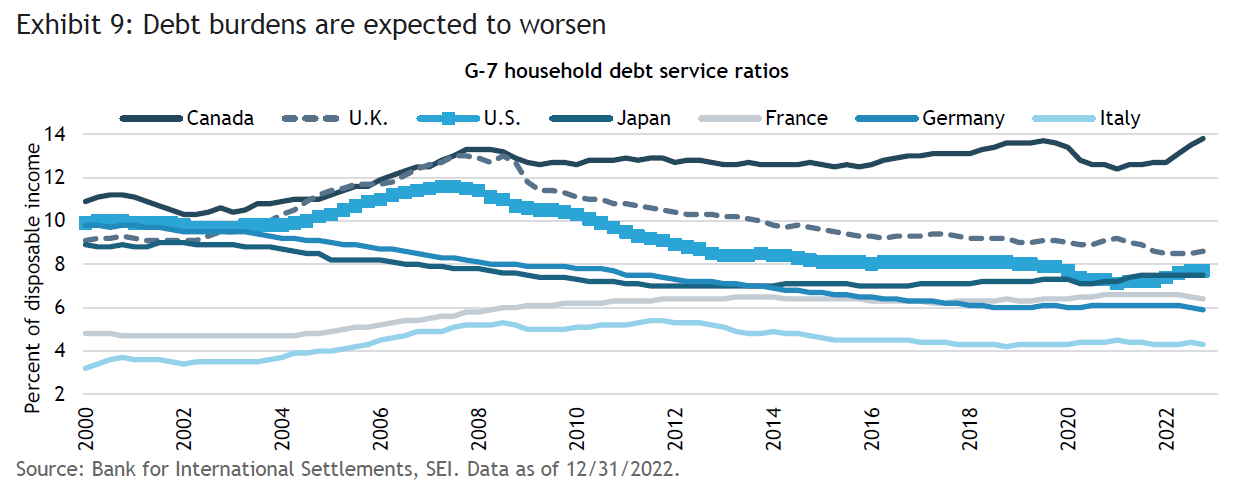
To be sure, signs of stress are beginning to show, especially at the lower rungs of the income scale and among young people, who certainly will feel the impact of the end of the student loan moratorium as of September 30 of this year. Delinquency rates on credit card debt have been moving higher for more than year from record-low levels, and are back to pre-pandemic levels. Nonetheless, households in the aggregate appear to be in good financial shape. Exhibit 9 compares the debt service ratios of the G-7 advanced economies, as measured by the Bank for International Settlements. The U.S. is in the middle of the pack, but its debt burden is still well below the highs recorded just before the Global Financial Crisis (GFC) of 2007-2009 took hold in all its fury. Canada, by contrast, stands out with an extremely high ratio relative to the other countries in the chart, with no reduction in the debt-service burden in the aftermath of the GFC. Note that the data go only through the end of last year. Household debt-service burdens have probably risen in 2023, especially in countries where home mortgages are variable or fixed for a limited term.
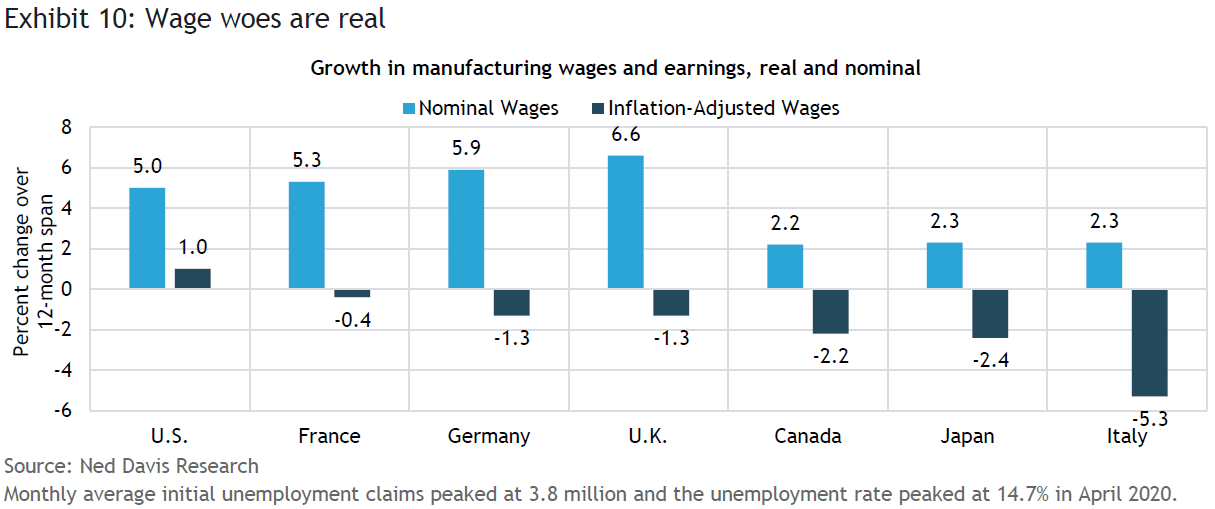
While U.S. workers have eked out an inflation-adjusted gain in earnings, workers in most other major economies have not, as we highlight in Exhibit 10. Falling inflation should alleviate some of the pain felt by workers in these countries, but it will take time to make up the loss in real incomes that has occurred over the past 18-to-24 months. The U.S. still appears to be the cleanest “dirty shirt in the laundry basket.” Other countries are likely to dip into recession before the U.S. does.
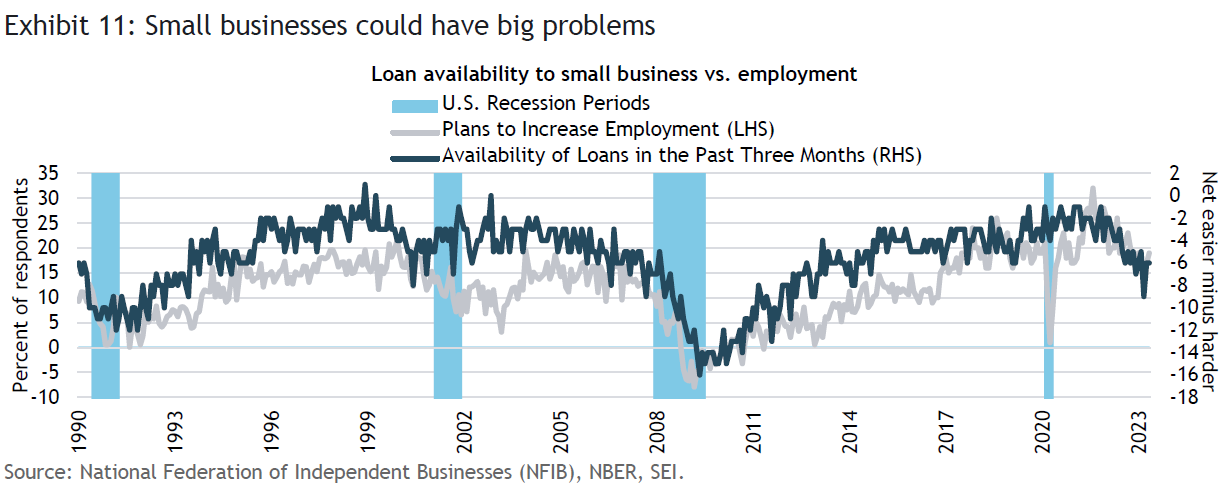
Although the banking panic that brought down three large U.S. regional banks has subsided, we continue to worry about the impact that a major consolidation of small and community banks will have on local real estate developers and small businesses. Exhibit 11 tracks the availability of loans to the small business sector over the preceding three months. Lending conditions began to deteriorate at the start of 2022, and took a more dramatic turn for the worse in the second half of last year. Recent readings are already at levels consistent with some previous recessions. While hiring plans of smaller companies dependent on local banks are still reasonably strong, the trend is toward the downside. Since small businesses have created just under two-thirds (63%) of the new jobs in the U.S. between 1995 and 2021,6 a further tightening of credit conditions could spark the recession many economists have been forecasting.
China might be closer to a bottom than a peak
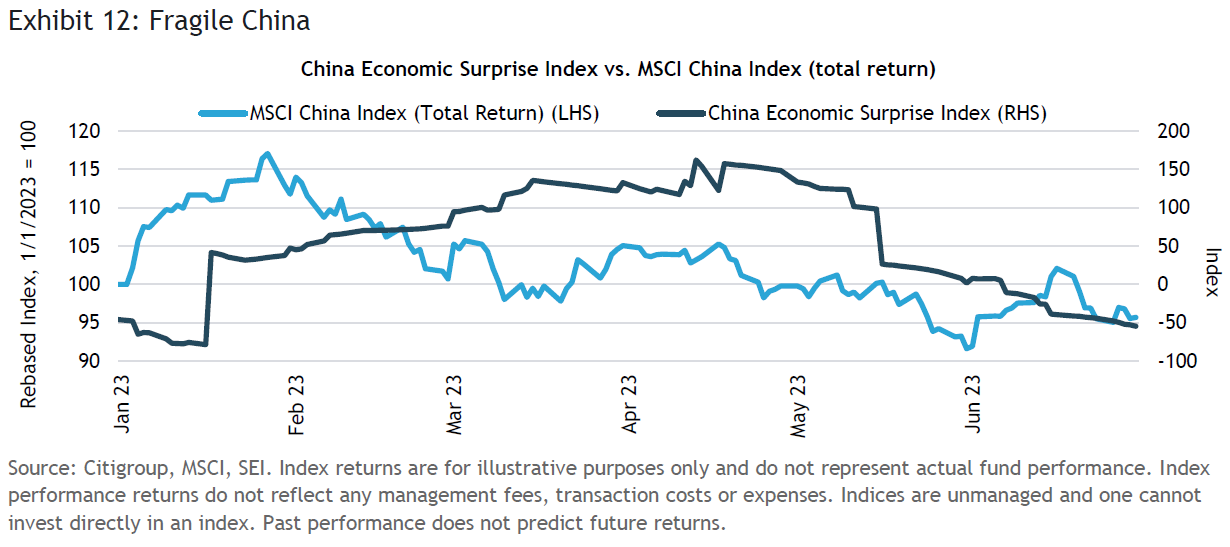
While the major developed countries are experiencing sub-par growth or outright stagnation, China also continues to struggle. There’s no denying that the economic recovery has been disappointing. Exhibit 12 tracks the Citigroup Economic Surprise Index for the country versus the total return of the MSCI China Index, unhedged, for the year-to-date. China’s equity market got off to a fast start in 2023, rising more than 17% in the first four weeks of January on investors’ hopes that the surprise ending to strict COVID lockdowns would spark a major economic upturn and help pull the global economy up with it. Chinese stocks abruptly turned lower, however, even though the economic data continued to mostly surprise on the upside during February and March. Rising geopolitical tensions between China and the U.S. over China’s support of Russia’s invasion, Taiwan, the South China Sea, semiconductor export restrictions to China, and the spy-balloon fiasco certainly haven’t helped. More recently, the economic data have been coming in below consensus expectations, leading to additional equity-price declines.
Like other countries, spending on services and a more mobile lifestyle is taking precedence over the purchases of goods. Domestic travel has been strong, although international tourism remains well below pre-pandemic levels and has been mostly limited to Hong Kong and Macau. The Chinese government did not lavish fiscal support upon its citizens as the Western democracies did. This appears to have limited both the magnitude and the duration of the post-COVID rebound. In addition, President Xi Jinping’s regime has been reluctant to aggressively increase lending, a sharp contrast to the government’s response during the GFC.
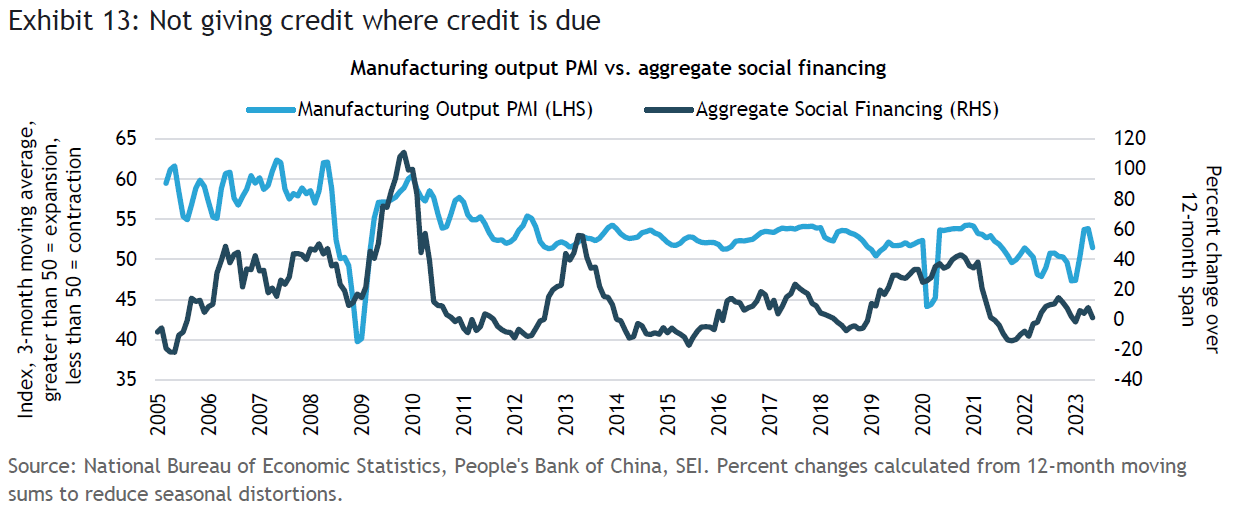
Exhibit 13 compares China’s broadest measure of credit growth to the country’s purchasing managers’ index for manufacturing output. During the deep global recession of 2008, China actively pursued a “no-holds-barred” expansionary economic policy focused on infrastructure, industry and property development, leading to a boom in demand for raw and semi-finished materials. There were two additional cycles, in 2012 to 2013 and 2018 to 2019, when social aggregate financing soared beyond 40% on a year-over-year basis. Although the economic response wasn’t as dramatic as in the 2008-to-2009 episode, China’s purchasing managers did report a significant improvement in manufacturing output. In 2021 and 2022, it appeared that the government again was starting to engage in a major monetary policy easing cycle. That turned out to be a “false start,” however.
On the positive side, China’s regulators have eased up on their crackdown of technology companies and real estate developers. The People’s Bank of China, the central bank, has also cut interest rates (reducing its main policy rate by a modest amount) and reduced bank reserve ratios, thereby adding liquidity to the banking system. However, we have yet to see the kind of aggressive policy moves that would lead to a strong economic rebound. Instead, economic support is being targeted to boost consumption of electric vehicles and to further ease the pressures on homebuyers and builders. In the meantime, the economy is growing, but at a pace that disappoints the optimists.
One problem China does not have is inflation. The easing of supply-chain pressures and the unusual weakness in the economy have led to year-on-year declines in producer prices for manufactured goods since April 2022. Inflation at the consumer level, meanwhile, has slowed to a mere 0.2% year-over-year rate. It is therefore a surprise that the Chinese government hasn’t engaged in a more forceful attempt to jumpstart economic growth, although there are strong hints from various officials that more dramatic policy moves will soon be announced.
Inflation has peaked, but it is sticky and high
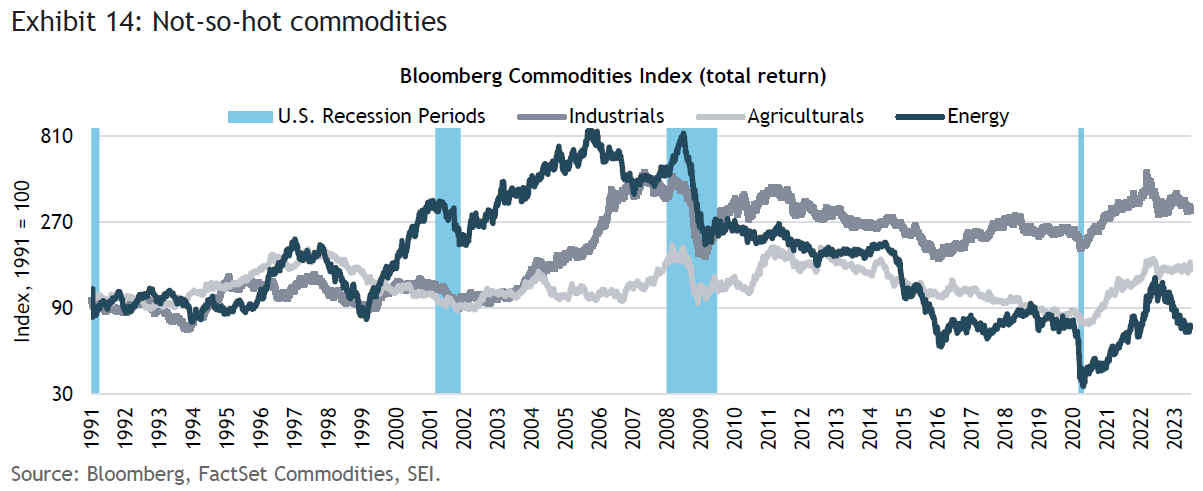
China’s sluggish economy, the slowing growth in the major advanced economies, a stubbornly buoyant dollar, and a major improvement in the global energy balance have all resulted in a sharp decline in oil, natural gas, and other commodity prices. Exhibit 14 tracks the three major sub-components of the Bloomberg Commodities Total Return Index. Industrials prices soared 160% between April 2020 and March 2022, peaking soon after Russia’s invasion of Ukraine. Energy prices topped out in July last year after a 140% cumulative gain, but remained elevated through the summer (with natural gas prices rising far more sharply in Europe than anywhere else as a result of the war). The energy complex has since registered a 45% decline. Agricultural prices are off their June 2022 peak, but only by 4%.
The run-up in industrials and energy in the 2020-to-2022 period was impressive, but it pails against the spectacular gains made in the early 2000s, a time when China’s voracious demands for petroleum and metals ran into capacity constraints. The GFC and the shale-oil revolution ushered in a prolonged bear market in the commodities complex, however, perpetuating the low inflation enjoyed by the global economy until the post-COVID boom.
The backdrop certainly is different this time around. Although an economic downturn in the advanced countries can be expected to place downward pressure on commodity prices, SEI expects any recession to be relatively mild. We also anticipate that the Chinese central government will step up and unveil more aggressive economic measures that will serve to at least partially offset the cyclical flagging of demand for energy and industrials in Europe and North America. Over the longer term, global demand for metals is expected to ramp up as governments around the world subsidize the development of the electric vehicle industry. In the meantime, supply may be restrained by the insufficient investment of recent years.
Even the energy markets may bottom out sooner rather than later owing to a lack of investment. Exhibit 15 focuses on the rig count in the U.S. and Canada. The rig count in both countries has begun to flatten in response to the decline in oil and natural prices over the past year. In the U.S., the current rig count is almost 30% below the previous peak reached in 2018, and 60% below the 2012 peak when oil prices fluctuated in the $80-to-$100 per-barrel range. The fracking industry has been exhibiting much greater investment discipline since 2015. The Biden administration’s goal of replacing fossil fuels with green-energy alternatives should act as a further deterrent to investment and capacity expansion.
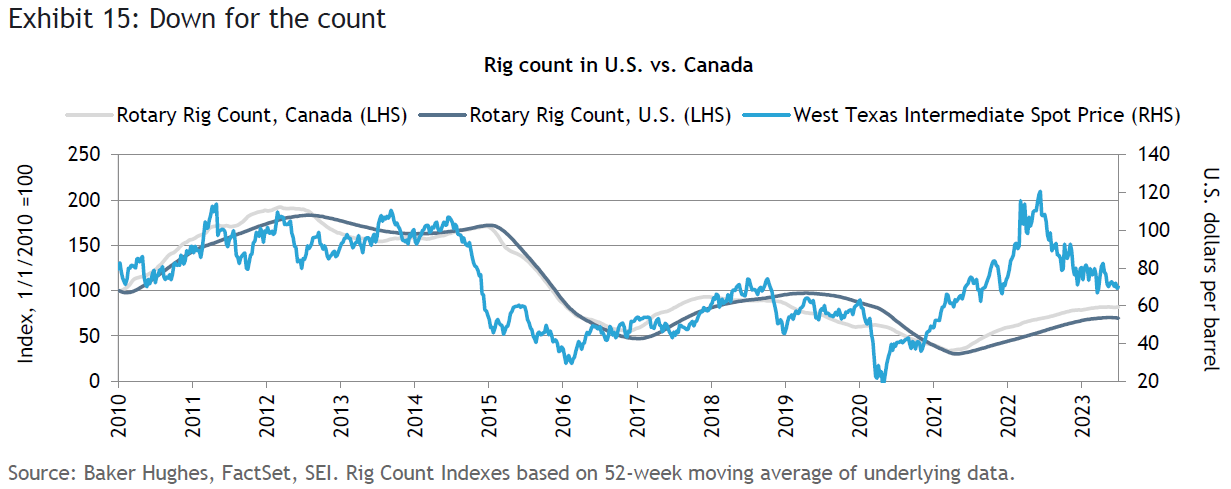
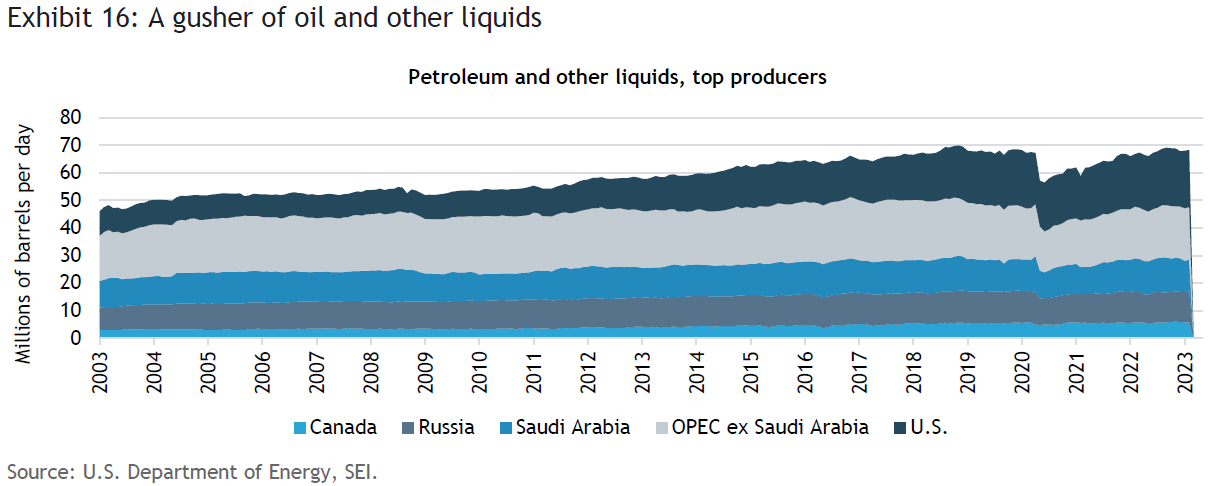
Exhibit 16 highlights the output of the top producers of oil and other liquids, including liquefied natural gas, and various petroleum products such as gasoline and diesel. Production from this group was almost back to 70 million barrels per day as of February 2023. The U.S. production total reached 20.84 million barrels per day in February, the most of any single country. U.S. output has climbed by 1.8 million barrels per day since February 2022. Saudi Arabia, on the other hand, produced 11.6 million barrels per day, one million barrels per day less than in August 2022; it recently announced that it will reduce output by another one million barrels per day in July. Russia, meanwhile, continues to produce as much as it can to finance its war effort; at 11 million barrels per day, the country is not too far behind the Saudis in the output rankings. We wonder, though, how long this level of output can be maintained. There is no question that the country’s oil fields and infrastructure are being degraded from the lack of spare parts and maintenance, as well as the loss of foreign expertise.
An additional source of supply has been the U.S. Strategic Petroleum Reserve (SPR). SPR inventories have been slashed nearly in half in the past two years, falling to 353 million barrels as of June. The Reserve has not been this low since 1983. Between May and September 2022, withdrawals were averaging 860,000 barrels per day. The Biden administration is now seeking to replenish the SPR beginning in August of this year. It makes sense to prepare for the next major supply disruption, if or when it comes, at a time when pricing is relatively attractive. A source of additional supply, however, will soon turn into a source of additional demand.
In SEI’s opinion, the weakness in commodity prices, especially in the energy sector, is probably overdone. Although a stagnant Europe and a slow-growing U.S. economy are concerns, the demand/supply imbalance isn’t as problematic as prices currently imply. Stronger growth from China and the end to inventory reductions should provide support to a broad range of commodities during the second half of this year.
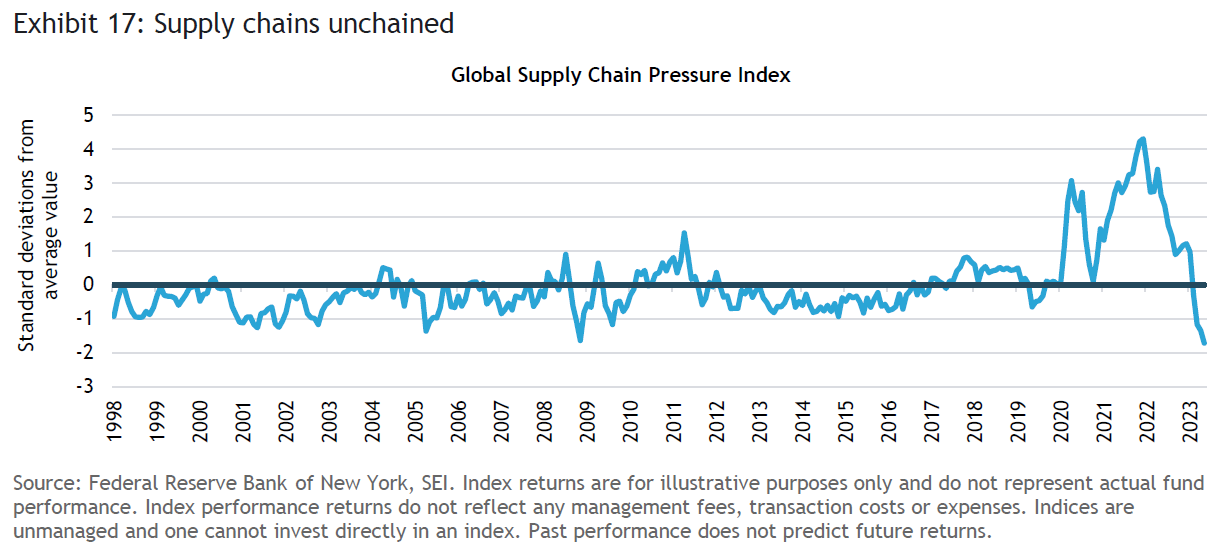
The energy-price pullback has been a godsend, however, especially for European economies that were severely stressed by last summer’s spike in natural gas prices. In fact, goods prices generally have eased nicely since the end of COVID disruptions amid the fading of supply-chain problems. Exhibit 17 tracks the Federal Reserve Bank of New York’s Global Supply Chain Pressure Index. The measure takes into account transportation costs and supply-chain-related components. It is derived from IHS Markit’s purchasing managers’ indexes, and comprises data from manufacturers across seven interconnected economies: China, Japan, South Korea, Taiwan, the U.K., the U.S. and the euro area. Supply-chain pressures hardly exist nowadays, with the index falling to an even lower level than that recorded in the depths of the GFC in 2008.
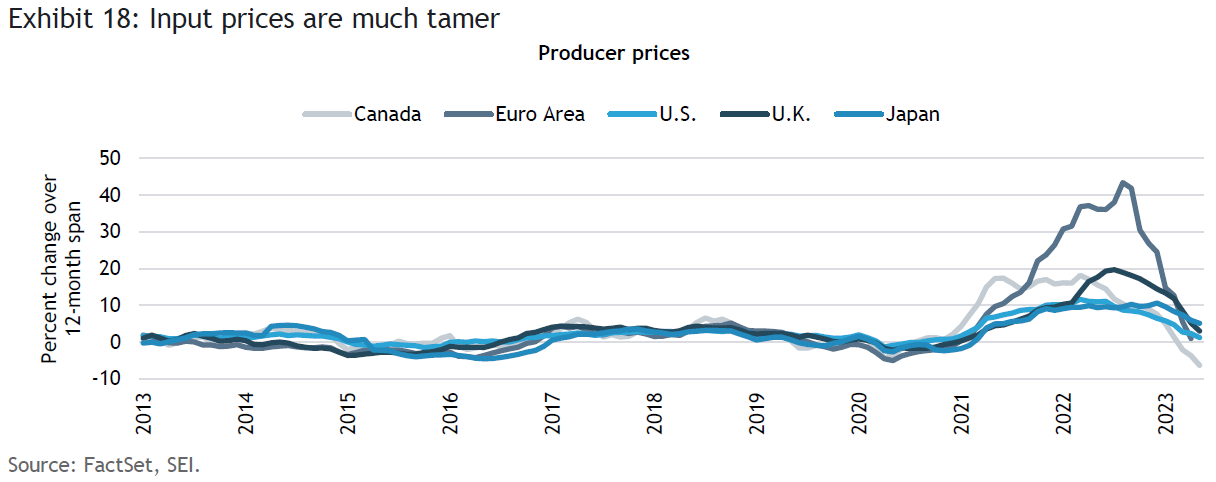
In general, input-price inflation has decelerated dramatically, as illustrated in Exhibit 18. Canada’s industrial producer price index has registered an outright decline in its price level, with a year-over-year change of -6.3% through May. The Eurozone Producer Price index (PPI) has witnessed the sharpest deceleration, falling from a peak year-over-year rate of 43% through August 2022 to an April 2023 reading of just 1%. By contrast, the improvement in producer prices has been less dramatic in Japan (still rising at a 5.1% year-over-year pace as of May), although the country has logged a steep deceleration from earlier this year. These year-over-year inflation PPI readings should continue to show improvement in the months immediately ahead as extremely high monthly readings a year ago fall out of the calculation.
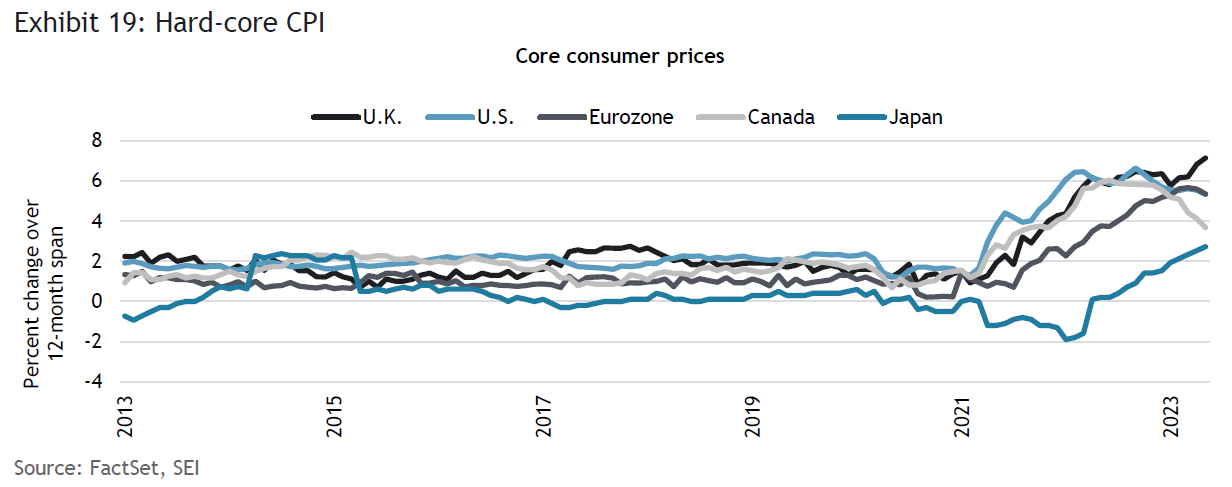
Unfortunately, the good news at the corporate level is feeding only slowly down to the consumer. This is especially true for core inflation, which excludes food and energy prices. Exhibit 19 tracks the year-over-year core consumer price index (CPI) inflation rate for the major advanced economies. On this basis, inflation is still accelerating in both the U.K. (reaching 7.1% in May) and in Japan (+2.7%). Improvement in the U.S. and the euro area has been modest, with core inflation still around 5.3%. Only Canada has recorded significant progress in its core inflation rate, declining from 6% in June 2022 to 3.7% as of May 2023.
SEI does not dispute the fact that inflation will likely continue to decelerate, especially given the current weakness in energy and goods prices. It is only a question of timing and end point. We continue to think that inflation pressures will remain persistent in labor-intensive service industries, at least until some slack opens up in the labor markets and spending by households fades more dramatically.
On a longer-term basis, demographic shifts are likely to keep labor markets tighter than has been the case at any point since the baby boomers, who were born between 1946 and 1964, first made their presence felt in the workforce in the 1970s. The new focus on supply-chain resiliency, reduced dependence on China as a manufacturing hub, the transition away from relatively cheap fossil-fuel energy to greener but more expensive sources of power, and the likelihood of significantly higher corporate taxes and financing costs in the years ahead, all suggest to us that inflation will tend to settle at 3% or more in advanced industrial economies instead of the previous norm of 2% or less.
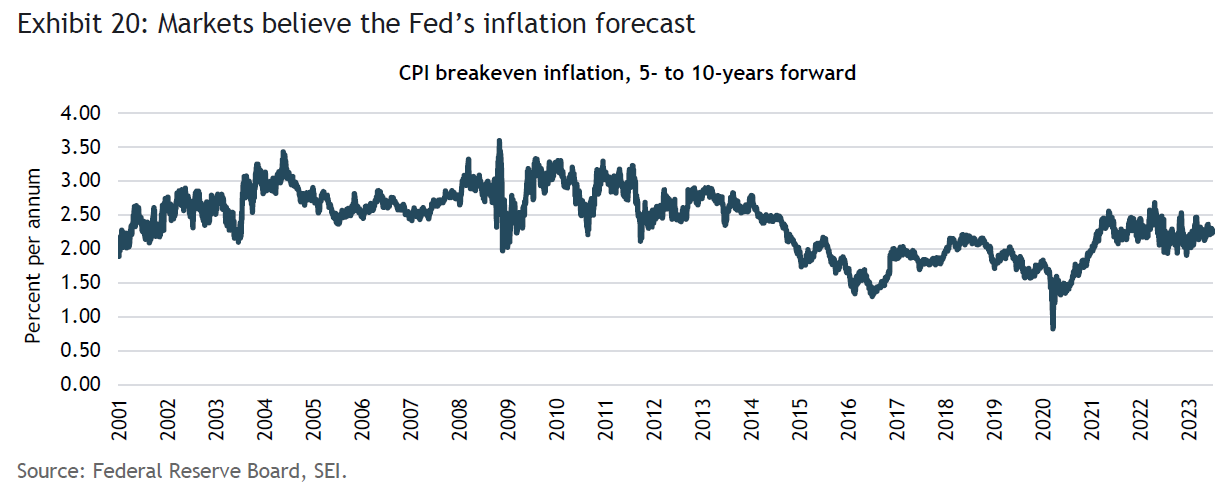
Our longer-term view of inflation remains out-of-consensus, as suggested by Exhibit 20. This chart tracks the expected inflation rate over the five-year period that begins five years from today, and is derived from 10-year and 5-year nominal and inflation-adjusted Treasury securities. Currently, the 5-year, 5-year forward CPI inflation rate amounts to 2.3%. That closely corresponds to the Fed’s official 2% target for the personal consumption expenditures price index, which tends to run about a quarter percentage-point lower than CPI inflation over time. Market participants still apparently believe that inflation is transitory.
The market’s perception of future inflation certainly can change, however. The 5-year, 5-year forward rate collapsed to a low of 0.8% in March 2020, as the U.S. began its COVID lockdown. The reason for the sharp reduction was more technical than fundamental. In recent years, the inflation breakeven rate has been mostly stuck in a 2%-to-2.5% range. This is good news for the Fed, since it suggests that inflation expectations are still well-anchored.
The University of Michigan’s survey of consumers, on the other hand, suggests that the ordinary “person-on-the-street” has a different view about where inflation is going. Exhibit 21 takes a look at the average price gain expected by survey respondents over the next five years. To compare apples with apples, we overlay the CPI breakeven rate over the same time frame. We also include the actual five-year annualized change in the CPI. The University of Michigan respondents always forecasts a higher inflation rate than traders in the bond market. But household inflation expectations mostly track breakeven rates over time, and the CPI itself particularly closely. It is important to note, however, that the two measures of expected inflation have diverged dramatically lately, with the latest University of Michigan report indicating a 4.3% annual inflation versus a 2.1% five-year breakeven rate.
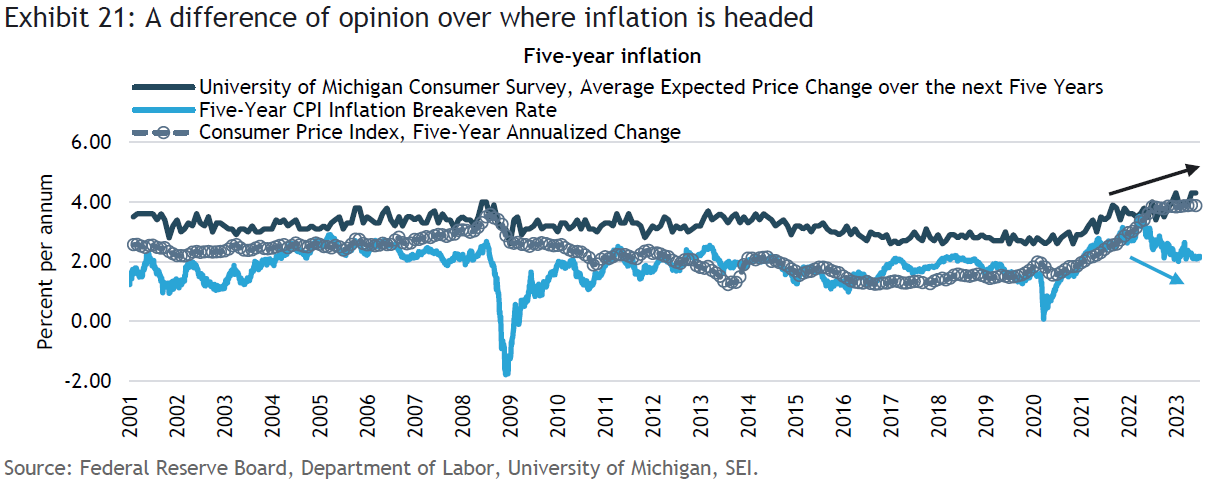
It might be easy to just ignore the Michigan survey results, since “regular folks” are responding to the inflation pressures they are feeling in the here and now, and extrapolating that experience into the future. But recall that U.S. Federal Reserve (Fed) Chairman Jerome Powell specifically referenced the survey in his press conference remarks following the June 2022 meeting of the Federal Open Market Committee (FOMC), the Fed’s policy-making arm. Powell said. “If we even see a couple of indicators [of inflation expectations] that bring that into question, we take that seriously. We do not take this for granted. We take it seriously. So the preliminary Michigan reading, it’s a preliminary reading, it might be revised. Nevertheless, it was quite eye catching and we noticed that.” One year later, we would say that the upward trend is even more eye-catching.
Interest rates: A delayed arrival
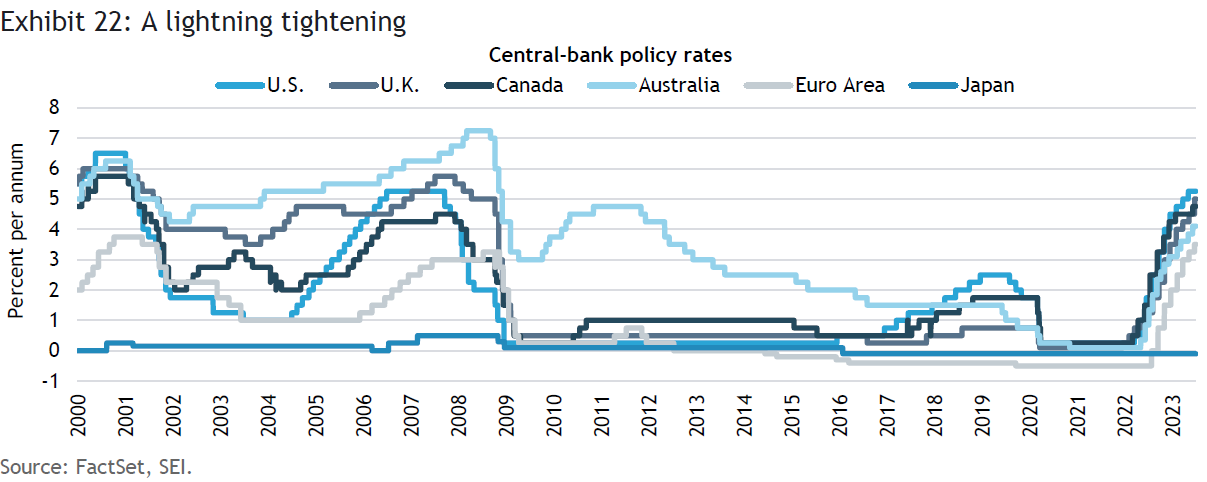
Sticky inflation and ongoing labor-market tightness have forced most major developed-country central banks to keep raising their policy rates. Exhibit 22 shows that the Fed, the Bank of Canada and the European Central Bank (ECB) already have policy rates that match or exceed the peak recorded in 2008. We think it’s likely that the Bank of England will soon join this group.
Although the FOMC chose to keep the funds rate unchanged at its June 2023 meeting, the central bank warned that it may well raise the federal-funds rate by another 25 basis points (0.25%) at its next meeting in July. It also left open the possibility of yet another rate hike after that, which Fed Chair Powell underscored during his recent Congressional testimony. It wasn’t too long ago that markets were pricing in a June 2023 peak in the federal-funds rate, followed by at least three rate cuts before the end of 2023. Those cuts have now been taken out of the equation. As of the end of June, the CME Group’s FedWatch Tool implied an 87% probability of a 25-basis point increase, into the 5.25%-to-5.50% range, at the next FOMC meeting on July 26. The odds of the first rate cut have now been pushed out to January 2024, with a year-end 2024 implied rate slightly below 4%.
The sharp swings in sentiment show how uncertain the game of Fed watching has become. Not only has the central bank’s credibility been damaged by its tardy response to the inflation spike in 2021, but the Fed’s decision-making process (which economists refer to as its “reaction function”) now seems completely geared to the latest incoming economic data than a broader, more forward-looking strategy. SEI anticipates that the split between the hawks and the doves will widen as the former group remains unconvinced that inflation will fall back into the target range anytime soon, while the latter increasingly fears that the interest-rate hikes to date are already overdone. As a result, forward guidance as a communications tool, including the so-called dot plot of FOMC members’ interest-rate and economic forecasts, may be less useful for the time being in judging the central bank’s next moves.
SEI has been consistent in saying that the inflation- and interest-rate trends would be higher for longer. As previously noted, U.S. inflation is now decelerating, although we are very doubtful that it will fall below 3% on a sustainable basis as both the Fed and markets expect. Nonetheless, we think the end of the rising interest-rate cycle is within sight. The trajectory of the federal funds rate, as implied by the pricing of fed funds futures contracts, seems reasonable at this juncture.
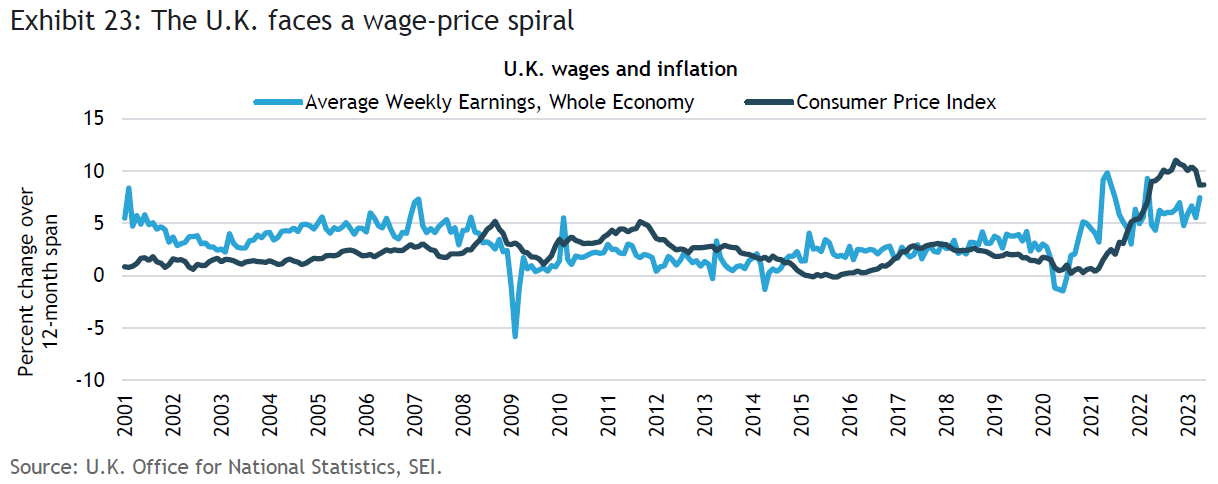
By contrast, the ECB and the Bank of England (BOE) appear to have more heavy lifting in front of them. The BOE probably has the hardest job of any of the major central banks. The U.K. economy seems to be closest to experiencing a wage-price spiral, with workers demanding higher wages to keep up with expected price hikes. The BOE must fight hard to avoid such a development. Exhibit 23 depicts the change in weekly earnings in the U.K. versus consumer-price inflation. Both wages and inflation have accelerated sharply, although the year-on-year changes in CPI have been much steeper. Nonetheless, the annual rise in average earnings through April hit 7.5%, a magnitude of gain in a year’s time seldom seen over the past two decades.
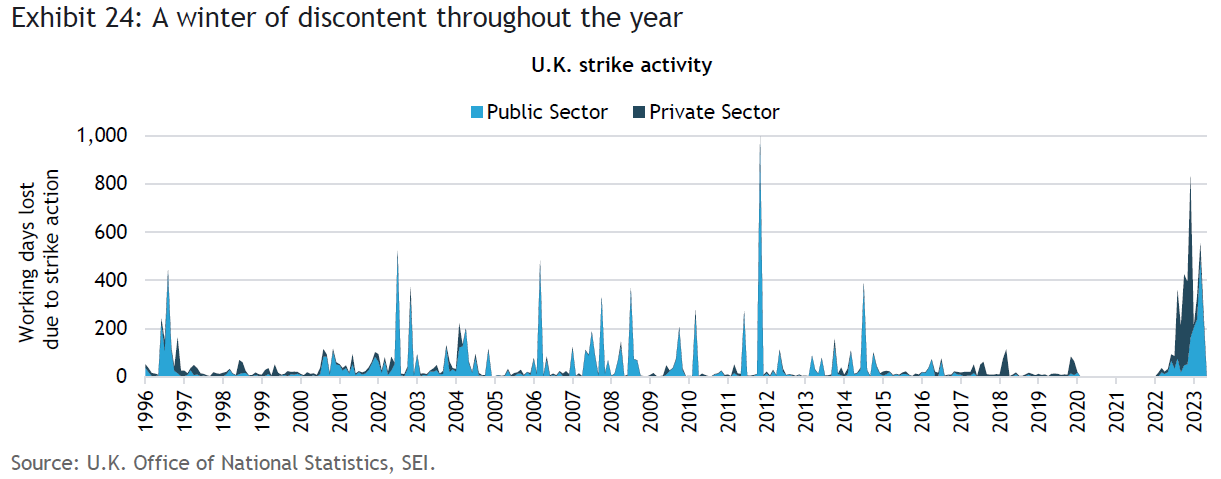
Given the tightness of the labor force and the difficult inflation environment, worker discontent has understandably increased. Exhibit 24 highlights the sharp rise in strike activity that has hit the country in the past year.
SEI’s U.K.-based fixed-income team notes that the market is now pricing around four more hikes (a terminal rate of 6.10% by year end). The team believes this likely overstates the extent of future Bank Rate increases, and agree that the BOE will need to continue hiking in the near term to curb inflation (which should moderate over the next six-to-nine months). The BOE’s 13th consecutive interest-rate hike, which will take the interest rate to 5%, should produce a sufficiently restrictive monetary policy against the backdrop of subdued industrial and manufacturing production and a household sector about to face significantly higher mortgage payments and potentially lower housing values.
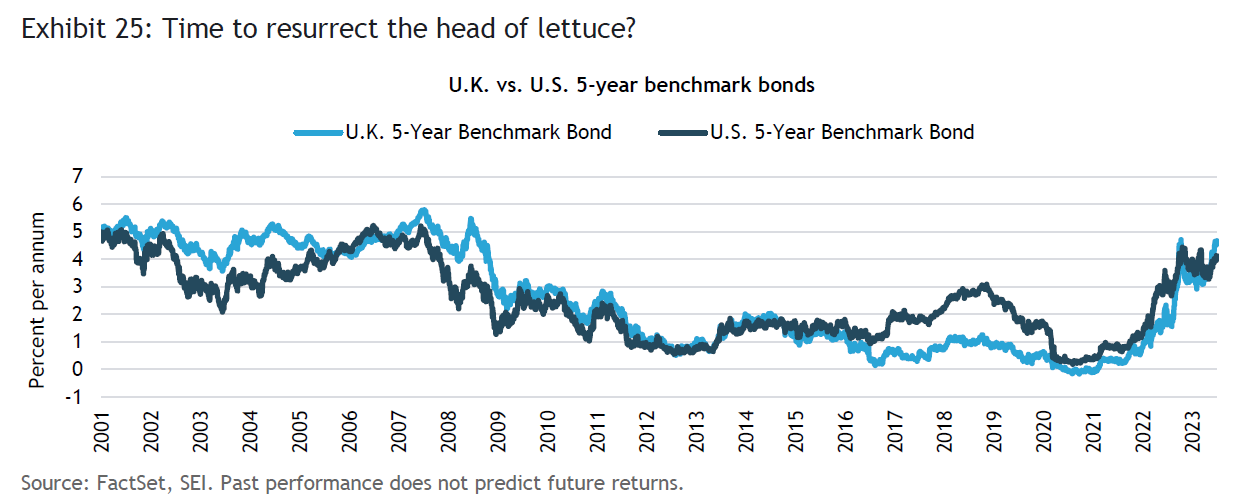
The BOE might not begin to cut its policy rate until the second half of 2024. But since it is likely any downturn will be felt most acutely in the U.K. among the G-7 countries, and assuming inflation has declined sufficiently, the BOE should have a clearer runway to cut if needed. Exhibit 25 highlights the sharp rise in the U.K. government’s 5-year benchmark bond. At 4.67%, it now exceeds the 5-year U.S. Treasury note yield by 55 basis points and is closing in on this cycle’s high-water mark of 4.71% reached in October 2022, during the liability-driven investing mini-crisis and the loss of confidence in former Prime Minister Liz Truss’s economic policy.
Japan’s exceptionalism
In contrast to every other advanced country, Japan’s monetary policy remains extraordinarily expansionary. Not only is the Bank of Japan’s (BOJ) policy rate still slightly negative (-0.10%), but the BOJ continues to engage in yield-curve control, maintaining the 10-year Treasury bond at around 0.4%. Since the beginning of last year, the Japanese 10-year bond yield has increased only 32 basis points through the end of June; by contrast, the 10-year U.S. Treasury note yield has jumped more than 230 basis points (2.3 percentage points) and 10-year U.K gilt yields have climbed 344 basis points (3.30 percentage points).
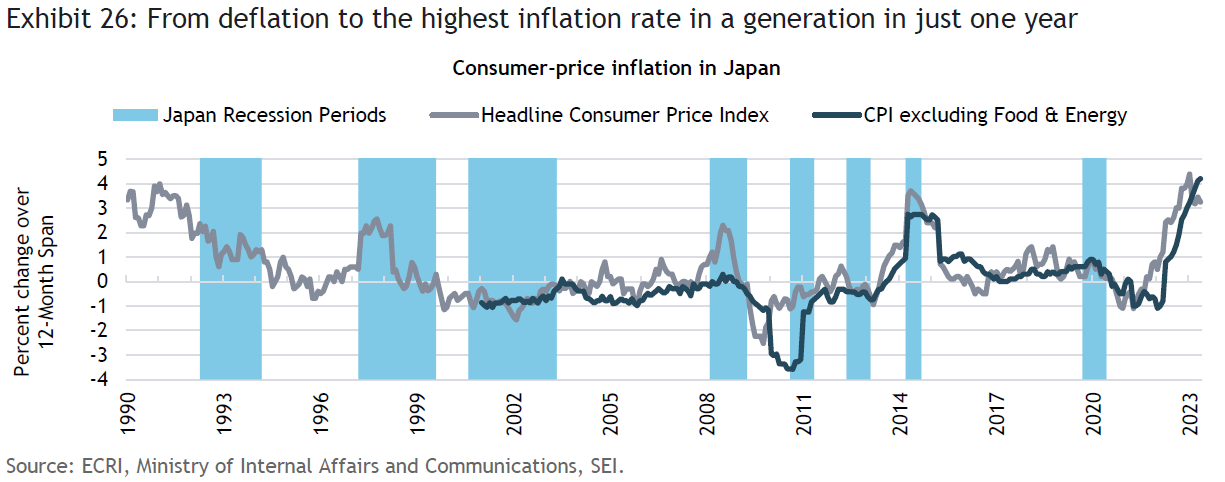
Frankly, we are surprised that the BOJ has yet to shift toward a more restrictive policy stance. As illustrated in Exhibit 26, inflation appears to have finally taken hold in Japan. Year-over-year core inflation reached 4.2% in May. Although headline inflation has eased off its peak reading as a result of lower energy prices, it remains at 3.2%. The only times that overall inflation reached these levels in previous cycles were in 1991 (just prior to the country’s long slide into deflation and economic stagnation) and 2014 (on the heels of an ill-advised boost in the country’s national sales tax rate).
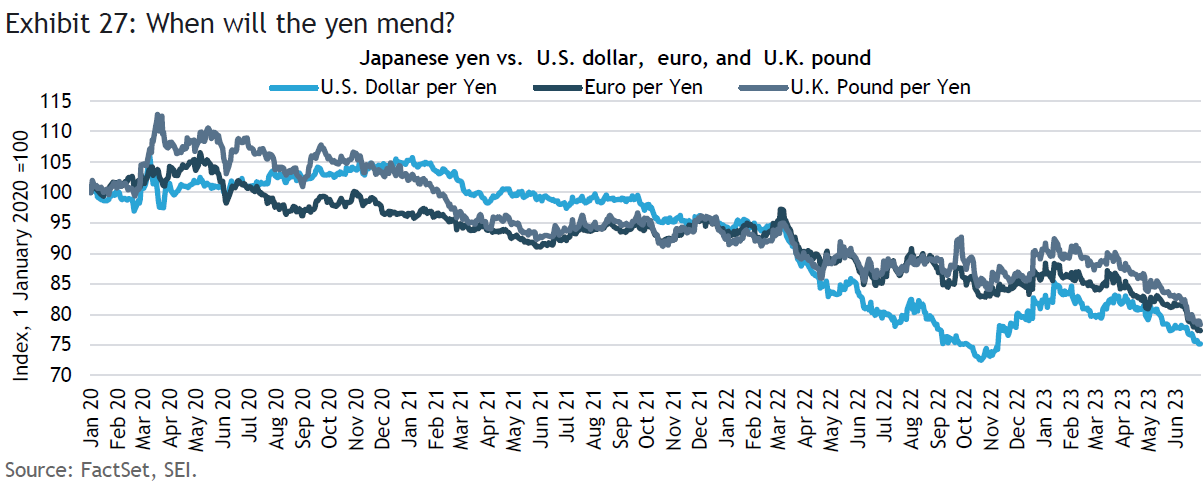
We thought that the installation of a new BOJ head and finance minister would be the catalyst for change. That hasn’t happened—yet. As a result, the Japanese yen has been quite weak against the U.S. dollar and other major currencies. Exhibit 27 shows how consistent that weakness has been. Following a brief period of strength during the initial phases of COVID, the yen has steadily lost ground. Since the beginning of 2020 through June 30, 2023 the yen was down 24.8% against the U.S. dollar, 22.6% versus the euro, and 21.4% compared to the U.K. pound. The last time the yen was this low against the U.S. currency was 1998. It also recently reached 15- and 8-year lows against the euro and the pound, respectively.
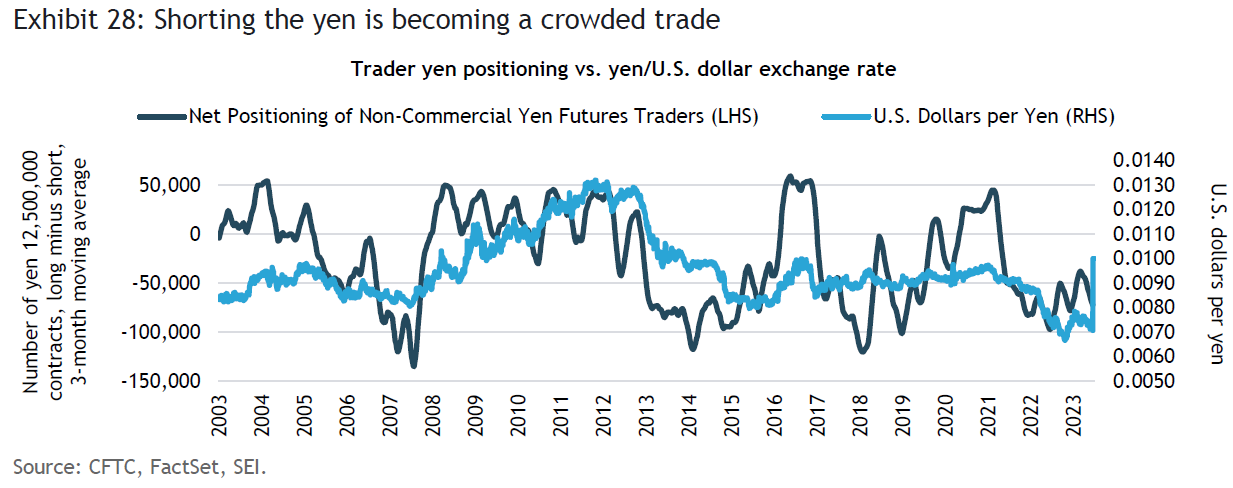
The yen’s depreciation has picked up steam in the past month, as traders seek to short the currency. We would note, however, that traders’ positioning on the short side is getting a bit crowded, although it is not yet at the extreme levels seen in 2007, 2014, and 2018, as depicted in Exhibit 28. SEI believes the yen is fundamentally cheap, and that its depreciation will add to inflation pressures. If monetary policy finally shifts to a more restrictive posture, the unwinding of short-yen positions could help turbocharge a rally in the currency back toward pre-pandemic levels.
Equities face multiple problems once again
One of the more frustrating features of the U.S. stock market this year has been the concentrated nature of the advance. For the year-to-date through June 30, only 27% of the constituents of the S&P 500 Index outperformed the overall index. Since 1973, the outperformers have averaged 49.3% annually, according to Ned Davis Research. If the year-to-date figure of 24% remained in place through the rest of 2023, it would mark the lowest annual percentage of outperformers in the 50-year history of the dataset, and would surpass the previous low recorded during the 1998-to-1999 tech stock bubble.
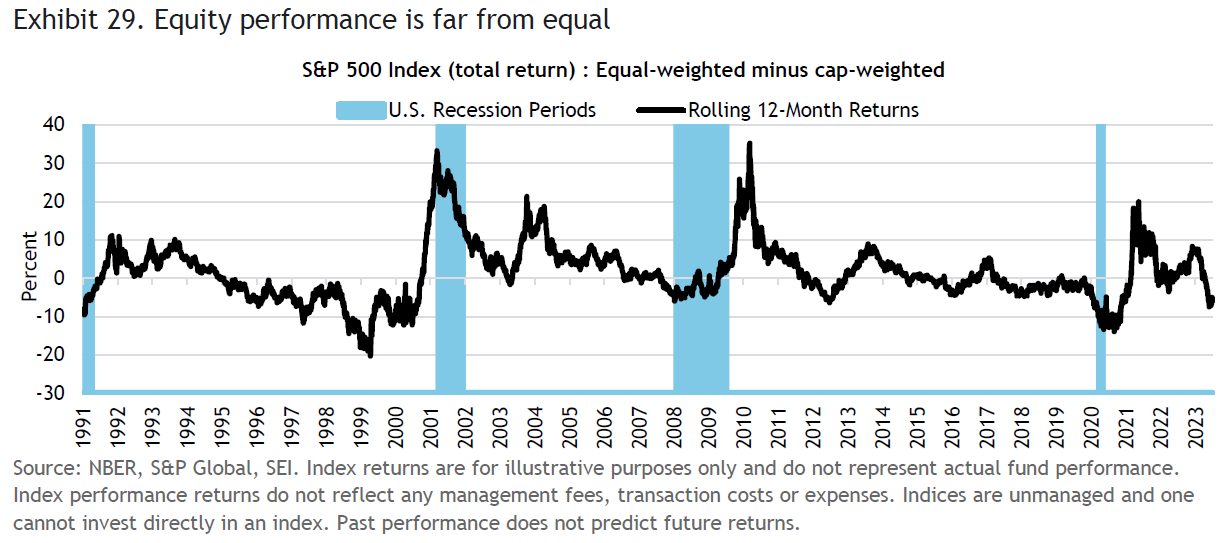
Adding to the woes of active large-cap portfolio managers is the fact that only seven stocks (Apple, Microsoft, Nvidia, Amazon, Meta, Tesla and Google) accounted for about three-quarters of the S&P 500’s 16.9% total return for the year-to-date through June 30. The remaining 493 companies posted a cumulative year-to-date total return contribution of only 4.4%. Another way of judging the narrow nature of the advance is to compare the market cap-weighted S&P 500 Index versus the equal-weighted S&P 500, as depicted in Exhibit 29. Through the end of June, the rolling 12-month relative performance of the S&P 500 equal-weighted total return minus the S&P 500 cap-weighted return was -5.5%. That performance is not as bad as the relative rolling returns posted during the 2020 COVID lockdown period or during the 1998-to-1999 tech stock bubble, but it is in the 87th percentile of daily observations going back to 1991. We believe that a significant reversal in relative performance is not far away.
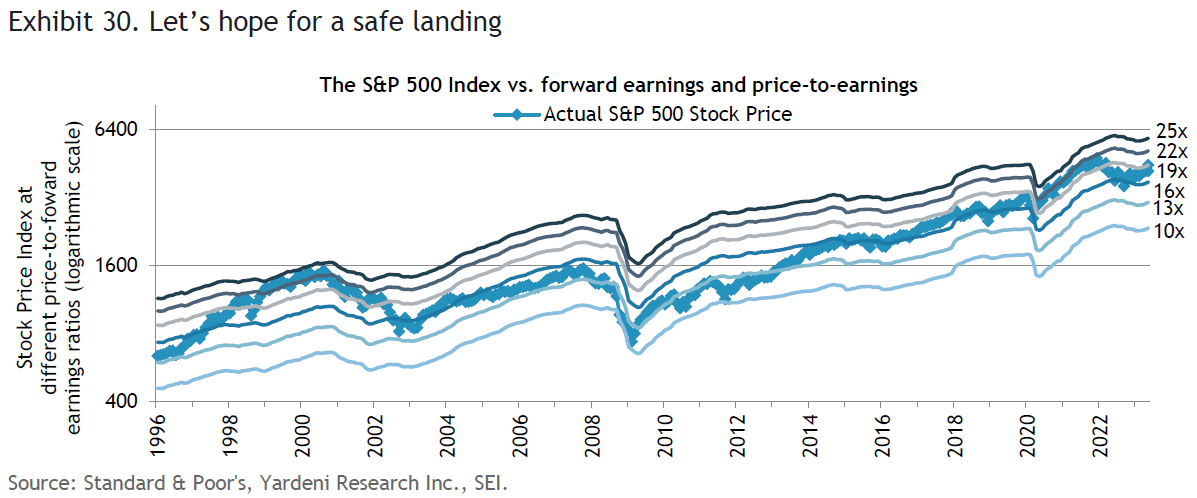
The rally in U.S. equities did, in fact, broaden in June. But the valuation in the market again is a problem. We present the so-called Blue Angels chart in Exhibit 30. This chart tracks the trajectory of the S&P 500 stock price index versus the levels that would be attained at various price-to-earnings ratios. One can see that the price-to-earnings ratio in the U.S. has been on the rise this year, now slightly exceeds 19 times analysts’ estimated earnings for the next 12 months. This expansion in the multiple on forward earnings has occurred despite the additional monetary tightening by the Federal Reserve and other central banks and a rebound in bond yields from the dip that took place following the mid-March bank panic.
There is some good news: Forward earnings estimates (the “contrails” that move in parallel with each other at each multiple level in the chart) have ticked higher lately. The bad news: This upturn in expected forward earnings over the next 12 months is not likely to last if a recession materializes later this year or in 2024. The overall market also appears to be overvalued relative to today’s bond yields. If earnings experience a substantial contraction, history suggests that stock valuations also will fall.
Although the momentum in the technology sector within the S&P 500 Index has been impressive, the forward price-to-earnings ratio is back to its previous multiple peak of 27 times achieved at the end of 2021. That is up from a low of 18.4 times recorded in October 2022. On a relative basis, the sector now trades at about a 40% premium to the overall S&P 500—the highest reading since April 2004.
Large-cap U.S. equities as a whole also trade at a steep premium to other developed stock markets. Excluding the U.S., international equity markets are priced at only 13 times estimated forward earnings. Although there are legitimate concerns about the longer-term growth prospects of non-U.S. industrial economies, the yawning valuation gap still seems excessive. SEI strongly believes that international diversification makes sense at this juncture. Indeed, since the bottom of the U.S. market on October 12, 2022, the total return of the MSCI World ex-USA Index has outpaced that of the MSCI USA Index, rising 31% in U.S. dollar terms versus a 26% gain for U.S. equities.
In summary, the rally in equities has surprised us, especially in recent months. However, while buoyant stock indexes have engendered increasing optimism among investors, it is making us more cautious. Investors with a tactical bent should take a contrary view of the rally for the following reasons:
- The U.S. and global economic outlook appears tepid, at best, with a recessionary outcome quite possible later this year or in 2024.
- Earnings estimates for the year ahead strike us as too optimistic, given our economic outlook and the increasing pressure on margins stemming from higher labor and financing costs and decelerating sales growth.
- Inflation is slowing, but will be hard to bring all the way back down to the Fed’s and other central banks’ 2% target.
- A further tightening of monetary policy, especially in the U.K. and the euro area, is likely to aggravate the downward pressure on economic activity.
- The lopsided nature of the rally in U.S. equities, where performance has been concentrated in a handful of large-cap technology stocks, should unwind sooner rather than later; broadly diversifying across sectors and geographies is a better strategy than chasing the winners.
- The total return of the MSCI World ex USA Index has outpaced that of the MSCI USA Index handily, rising 31% in U.S. dollar terms versus a 26% gain for U.S. equities since October 12, 2022.
Glossary
The G7 is an intergovernmental organization made up of the world's largest developed economies: France, Germany, Italy, Japan, the U.S., the U.K., and Canada.
Gross domestic product (GDP) is the total monetary or market value of all the goods and services produced in a country during a certain period.
The Global Financial Crisis (GFC) refers to the period of extreme stress in global financial markets and banking systems between mid-2007 and early 2009.
The 5-year, 5-year forward rate measures the expected inflation rate (on average) over the five-year period that begins five years from the current date.
The breakeven inflation rate comprises the difference between the nominal yield on a fixed-rate bond and the real yield (an adjusted yield that takes into account the impact of inflation) on an inflation-linked bond of similar maturity and credit quality. A rising breakeven rate suggests that expectations for inflation have risen. Conversely, a falling breakeven rate suggests that expectations for inflation have declined.
Yield curve control comprises the targeting of a longer-term interest rate by a central bank, which then buys or sells as many bonds as necessary to hit that rate target.
Weighted average market capitalization index refers to an index in which the average price is weighted for market capitalization (the total value of a publicly traded company’s outstanding shares). Most indexes use weighted averages so that companies with relatively smaller capitalizations do not have a disproportionate impact on the performance of the index.
The price-to-earnings ratio is calculated by dividing the current market price of a stock by the earnings per share. Price/earnings multiples often are used to compare companies in the same industry, or to assess the historical performance of an individual company.
Index definitions
The Composite Index of Leading Indicators (U.S. Conference Board) is designed to predict peaks and troughs in the business cycle. The index is composed of 10 economic components whose changes tend to precede changes in the overall U.S. economy.
The Composite Index of Coincident Indicators is a combination of chosen economic statistical indicators, such that a set of series gives more information than a single indicator, that changes simultaneously with general economic conditions and therefore reflects the current status of the economy.\
The ISM (Institute for Supply Management) New Orders Index tracks the number of new orders from customers of manufacturing firms reported by survey respondents compared to the previous month.
A purchasing managers’ index (PMI) tracks the prevailing direction of economic trends in the manufacturing and service sectors.
The Bank for International Settlements support central banks' pursuit of monetary and financial stability through international cooperation, and acts as a bank for central banks.
The Citigroup Economic Surprise Index measures the degree to which a core set of economic data series has been coming in under expectations, at expectations, or over expectations.
The MSCI China Index tracks the performance of large- and mid-cap stocks in China. The index’s 151 constituents, comprise about 85% of the China equity universe.
The Bloomberg Commodity Total Return Index comprises futures contracts and tracks the performance of a fully collateralized investment in the index. This combines the returns of the index with the returns on cash collateral invested in 13-week (three-month) U.S. Treasury bills.
The Federal Reserve Bank of New York’s Global Supply Chain Pressure Index integrates transportation cost data and manufacturing indicators to provide a gauge of global supply-chain conditions.
The IHS/Markit Economics Purchasing Managers’ Index™ tracks the prevailing direction of economic trends in the manufacturing and service sectors.
The Industrial Product Price Index (IPPI) measures price changes for major commodities sold by manufacturers operating in Canada. The Eurozone Producer Price Index (PPI) tracks average changes in prices received by domestic producers for their output. It is a leading indicator of consumer price inflation, which accounts for the majority of overall inflation.
The consumer-price index is a measure of the average change over time in the prices paid by consumers for a weighted-average market basket of consumer goods and services purchased by households.
The S&P 500 Index is a market-weighted index that tracks the performance of the 500 largest publicly traded U.S. companies and is considered representative of the broad U.S. stock market.
The MSCI World ex USA Index tracks the performance of the large- and mid-cap segments of equity markets across 22 of 23 developed- market countries--excluding the U.S. The index’s 887 constituents comprise approximately 85% of the free float-adjusted (i.e., including only shares that are available for public trading) market capitalization in each country.
The MSCI USA Index tracks the performance of the large- and mid-cap segments of the U.S. equity market. The index’s 624 constituents comprise approximately 85% of the free float-adjusted (i.e., including only shares that are available for public trading) market capitalization in the U.S.
The Citigroup Economic Surprise Index measures the degree to which economic data is beating or missing estimates. A purchasing managers’ index (PMI) tracks the prevailing direction of economic trends in the manufacturing and service sectors. The S&P 500 Regional Banks Select Industry Index measures the performance of U.S. regional bank stocks included in the S&P Total Market Index, which tracks the broad U.S. equity market (large-, mid-, small-, and micro-cap stocks).
Important information
This material represents an assessment of the market environment at a specific point in time and is not intended to be a forecast of future events or a guarantee of future results. Positioning and holdings are subject to change. All information as of the date indicated. There are risks involved with investing, including possible loss of principal. This information should not be relied upon by the reader as research or investment advice, (unless you have otherwise separately entered into a written agreement with SEI for the provision of investment advice) nor should it be construed as a recommendation to purchase or sell a security. The reader should consult with their financial professional for more information.
Statements that are not factual in nature, including opinions, projections and estimates, assume certain economic conditions and industry developments and constitute only current opinions that are subject to change without notice. Nothing herein is intended to be a forecast of future events, or a guarantee of future results.
Certain economic and market information contained herein has been obtained from published sources prepared by other parties, which in certain cases have not been updated through the date hereof. While such sources are believed to be reliable, neither SEI nor its affiliates assumes any responsibility for the accuracy or completeness of such information and such information has not been independently verified by SEI.
There are risks involved with investing, including loss of principal. The value of an investment and any income from it can go down as well as up. Investors may get back less than the original amount invested. Returns may increase or decrease as a result of currency fluctuations. Past performance is not a reliable indicator of future results. Investment may not be suitable for everyone.
This material is not directed to any persons where (by reason of that person's nationality, residence or otherwise) the publication or availability of this material is prohibited. Persons in respect of whom such prohibitions apply must not rely on this information in any respect whatsoever.
The information contained herein is for general and educational information purposes only and is not intended to constitute legal, tax, accounting, securities, research or investment advice regarding the strategies or any security in particular, nor an opinion regarding the appropriateness of any investment. This information should not be construed as a recommendation to purchase or sell a security, derivative or futures contract. You should not act or rely on the information contained herein without obtaining specific legal, tax, accounting and investment advice from an investment professional.
The views contained herein are not to be taken as advice or a recommendation to buy or sell any investment in any jurisdiction. Our outlook contains forward-looking statements that are judgments based upon our current assumptions, beliefs and expectations. If any of the factors underlying our current assumptions, beliefs, or expectations change, our statements as to potential future events or outcomes may be incorrect. We undertake no obligation to update our forward-looking statements.
The opinions and views in this commentary are of SIEL only unless stated and are subject to change. They should not be construed as investment advice.
Information issued in the UK by SEI Investments (Europe) Limited, 1st Floor, Alphabeta, 14-18 Finsbury Square, London EC2A 1BR which is authorised and regulated by the Financial Conduct Authority. Investments in SEI Funds are generally medium- to long-term investments.
This information is being made available in Hong Kong by SEIAL. The contents of this document have not been reviewed by any regulatory authority in Hong Kong. You are advised to exercise caution in relation to the offer. If you are in any doubt about any of the contents of this document, you should obtain independent professional advice.
This information is made available in Latin America and the Middle East FOR PROFESSIONAL (non-retail) USE ONLY by SIEL.
Any questions you may have in relation to its contents should solely be directed to your Distributor. If you do not know who your Distributor is, then you cannot rely on any part of this document in any respect whatsoever.
SIEL is not licensed under Israel’s Regulation of Investment Advising, Investment Marketing and Portfolio Management Law, 57551995 (the “Advice Law”) and does not carry insurance pursuant to the Advice Law. No action has been or will be taken in Israel that would permit a public offering or distribution of the SEI Funds mentioned in this email to the public in Israel. This email and any of the SEI Funds mentioned herein have not been approved by the Israeli Securities Authority (the “ISA”).
Issued in South Africa by SEI Investments (South Africa) (Pty) Limited FSP No. 13186 which is a financial services provider authorised and regulated by the Financial Sector Conduct Authority (FSCA). Registered office: 3 Melrose Boulevard, 1st Floor, Melrose Arch 2196, Johannesburg, South Africa.
This material is intended for information purposes only and the information in it does not constitute financial advice as contemplated in terms of the Financial Advisory and Intermediary Services Act.


