No Pain, No Gain: Disciplined Investing through Anxious Times
Last year’s strong global equity performance followed on the heels of a decade-long bull market, underscoring how far the recovery has come from the depths of the financial crisis.
However, it may also explain some investors’ fears that we may be closer to the beginning of the next stock-market downturn than we are to the next period of exceptional gains. The recent trend of moderating global economic activity and growth has been another source of anxiety, contributing to a sense of unease among investors.
The rebound can be sharper than the decline
When downturns come to mind, investors are often fearful of bear markets—which are typically defined as declines of 20% or more in a broad stock market index (such as the MSCI World Index).
No one likes to see the value of their investments decrease. But we know that ups and downs are a normal part of the investment cycle, even if recent market history suggests otherwise. And remaining disciplined within an appropriate investment strategy through a downturn—in order to fully participate in its eventual recovery— typically serves investors well.
Exhibit 1 shows total returns of the global stock market (and includes the US stock market for more historical observations) in the one-year periods leading up to and following a bear-market bottom. This data suggest that rebounds are often bigger than declines by more than one-and-a-half times.
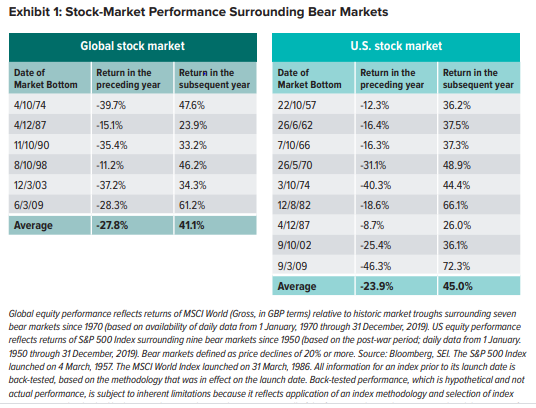
Based on the averages for global equities shown in Exhibit 1, if we combine the -27.8% decline and the 41.1% rebound, the net result was a gain of 1.8%, on a cumulative basis. In the US, where more historical data is available, the year leading up to the last nine market bottoms had an average decline of almost 24% and an average rebound of 45%, which combine for a net cumulative gain of 10.3%. The significant decline in US equities at the end of 2018 just barely missed qualifying as a bear market, but their performance in 2019 demonstrated that the rebound can be much stronger than the decline.
The risk of aiming too low is that you may hit your mark
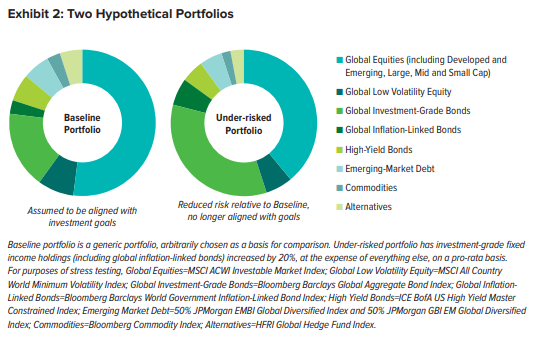
Exhibit 2 illustrates two hypothetical portfolios. The first portfolio—let’s call this the baseline portfolio—is assumed to be aligned with an investor’s goals. The second portfolio—which we’ll call the under-risked portfolio—is a significantly de-risked version of the first. The baseline portfolio is intentionally generic and only acts as a basis for comparison for illustration purposes.
The only difference between the two portfolios is that 20% of the second portfolio’s riskier assets have been replaced by high-quality bonds (which are less risky). How might these portfolios fare in the years on either side of a bear market?
To answer this question, we ran stress tests on both portfolios. Using the modeling capabilities of a third-party risk-management system, we applied the average decline and average rebound of global equities before and after bear markets (seen in Exhibit 1) as the “shocks,” or stress conditions, to estimate the performance of the portfolios.
The results, shown in Exhibit 3, are similar to what we’ve seen historically in the case of equity markets. The net cumulative effect (through decline and rebound) is estimated to be positive for both portfolios.
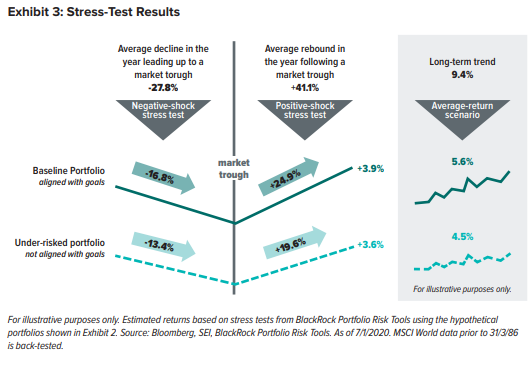
While the under-risked portfolio did not experience as big a decline as the baseline portfolio, it also didn’t have as strong a rebound. Despite losing a bit more on the downside, the subsequent rebound in the baseline portfolio more than made up for the loss: It ultimately outpaced the under-risked portfolio by about 0.3%. Exhibit 3 shows estimated gains of 3.9% for the baseline portfolio and 3.6% for the under-risked portfolio.
More importantly, the baseline portfolio represents the targeted return needed to meet the investor’s goals while remaining commensurate with their risk tolerance. The underrisked portfolio, representing an attempt to dodge a market downturn through more conservative positioning, would be expected to undershoot the investor’s goals.
This point is further illustrated by the longer-term trend numbers shown on the right side of Exhibit 3. Instead of using a large negative or large positive return as the shock for a stress test, we used the long-term average return of the MSCI World (9.4%, in GBP terms) as an input. The risk-management system again estimated returns for the portfolios—5.6% and 4.5% for the baseline and under-risked portfolios, respectively. Based on these estimations, an under-risked investor may give up roughly 1% of expected return each year, which would potentially lead them off-track from their goals
Keep calm and carry on
The ups and downs of the market, while sometimes stressful, are normal. No one knows exactly when they’ll happen or how long they’ll last. But our analysis shows that an under-risked portfolio that’s not aligned with investment goals may be less likely to achieve success over time.
As always, we continue to promote diversification and taking the minimum amount of risk possible while remaining aligned with investment goals. If a portfolio has become more concentrated and may therefore benefit from further diversification—or if an investor’s goals or risk tolerance have changed—then reviewing their asset allocation may be warranted.
But, unless there is a strategic reason to change course, it’s important to remember that accurately predicting major turning points in financial markets is near-impossible. Making significant changes to a portfolio solely on the basis of such predictions may be costly in the end (see here and here). Staying the course may help investors to avoid falling short of their goals.
Our analysis aims to reinforce the notion that keeping calm and remaining disciplined should produce better long-term investment results. Also, keep in mind that a well diversified portfolio may soften the blow of a market downturn. It may not deliver outsized gains in up markets, but it may help to mitigate outsized losses in down markets, which should help investors stay on track to meet their goals.
Anxiety about market volatility is only natural. Yet most investors only focus on the downturn, without giving thought to the eventual rebound. If you’re having trouble sticking to your long-term plan, just remember that the rebound may be sharper than the decline.
All references to performance are in US dollar terms unless otherwise noted. For Professional Client Use Only–Not for Distribution to Retail Client.
Index Definitions
The Bloomberg Commodity Index is a highly liquid and diversified benchmark for commodity investments.
The Bloomberg Barclays Global Aggregate Bond Index is an unmanaged market-capitalization-weighted benchmark that tracks the performance of investment-grade fixed-income securities denominated in 13 currencies. The Index reflects reinvestment of all distributions and changes in market prices.
The Bloomberg Barclays World Government Inflation-Linked Bond Index measures the performance of the inflation-protected bond segment of the global bond market.
The HFRI Global Hedge Fund Index is designed to be representative of the overall composition of the hedge fund universe. It is comprised of all eligible hedge fund strategies; including but not limited to convertible arbitrage, distressed securities, equity hedge, equity market neutral, event driven, macro, merger arbitrage, and relative value arbitrage. The strategies are asset weighted based on the distribution of assets in the hedge fund industry.
The ICE BofA US High Yield Master Constrained Index contains all securities in the ICE BofA US High Yield Index but caps exposure to individual issuers at 2%. The ICE BofA US High Yield Index tracks the performance of below-investment grade, U.S. dollar-denominated corporate bonds publicly issued in the U.S. domestic market.
The JPMorgan EMBI Global Diversified Index tracks the performance of external debt instruments (including U.S.-dollar denominated and other external-currency-denominated Brady bonds, loans, Eurobonds and local-market instruments) in the emerging markets.
The JPMorgan Government Bond Index-Emerging Markets (GBI-EM) Global Diversified Index is a comprehensive, global local emerging markets index, and consists of regularly traded, liquid fixed-rate, domestic currency government bonds to which international investors can gain exposure.
The MSCI World Index is a free float-adjusted market-capitalizationweighted index that is designed to measure the equity-market performance of developed markets. The Index consists of 24 developed-market country indexes.
The MSCI All Country World Investable Market Index captures large, mid and small cap representation across 23 Developed Markets (DM) and 26 Emerging Markets (EM) countries.
The MSCI All Country World Minimum Volatility Index aims to reflect the performance characteristics of a minimum-variance strategy, focused on providing absolute return and volatility with the lowest absolute risk. It is constructed from the MSCI World Index and the Barra Global Equity risk model and subject to various constituent, country, sector and factor constraints. The Index is unhedged and rebalanced (or re-optimized) semiannually.
The S&P 500 Index is an unmanaged, market-weighted index that consists of 500 of the largest publicly-traded U.S. companies and is considered representative of the broad U.S. stock market.
Important Information
The opinions and views in this commentary are of SEI only and are subject to change. They should not be construed as investment advice.
Investments in SEI Funds are generally medium- to long-term investments. The value of an investment and any income from it can go down as well as up. Investors may get back less than the original amount invested. Returns may increase or decrease as a result of currency fluctuations. Past performance is not a reliable indicator of future results. Additionally, this investment may not be suitable for everyone. If you should have any doubt whether it is suitable for you, you should obtain expert advice.
The SEI Global Assets Fund Plc, SEI Global Investments Fund Plc, and SEI Global Master Fund Plc (the “SEI Funds”) are structured as openended collective investment schemes and are authorised in Ireland by the Central Bank as a UCITS pursuant to the UCITS Regulations. The SEI Funds are managed by SEI Investments, Global Ltd (“SIGL”). SIGL has appointed SEI Investments (Europe) Ltd (“SIEL”), an affiliate of SIGL, (together “SEI”) to provide general distribution services in relation to the SEI Funds either directly or through the appointment of other sub-distributors. The SEI Funds may not be marketed to the general public except in jurisdictions where the funds have been registered by the relevant regulator. The matrix of the SEI fund registrations can be found here seic.com/GlobalFundRegistrations.
No offer of any security is made hereby. Recipients of this information who intend to apply for shares in any SEI Fund are reminded that any such application may be made solely on the basis of the information contained in the Prospectus. This material represents an assessment of the market environment at a specific point in time and is not intended to be a forecast of future events, or a guarantee of future results. This information should not be relied upon by the reader as research or investment advice regarding the funds or any stock in particular, nor should it be construed as a recommendation to purchase or sell a security, including futures contracts. In addition to the normal risks associated with equity investing, international investments may involve risk of capital loss from unfavourable fluctuation in currency values, from differences in generally accepted accounting principles or from economic or political instability in other nations. Bonds and bond funds are subject to interest rate risk and will decline in value as interest rates rise. High yield bonds involve greater risks of default or downgrade and are more volatile than investment grade securities, due to the speculative nature of their investments. Narrowly focused investments and smaller companies typically exhibit higher volatility. SEI Funds may use derivative instruments such as futures, forwards, options, swaps, contracts for differences, credit derivatives, caps, floors and currency forward contracts. These instruments may be used for hedging purposes and/ or investment purposes.
While considerable care has been taken to ensure the information contained within this document is accurate and up-to date, no warranty is given as to the accuracy or completeness of any information and no liability is accepted for any errors or omissions in such information or any action taken on the basis of this information.
This information is issued by SEI Investments (Europe) Limited, 1st Floor, Alphabeta, 14-18 Finsbury Square, London EC2A 1BR which is authorised and regulated by the Financial Conduct Authority. Please refer to our latest Full Prospectus (which includes information in relation to the use of derivatives and the risks associated with the use of derivative instruments), Key Investor Information Documents and latest Annual or Semi-Annual Reports for more information on our funds. This information can be obtained by contacting your Financial Adviser or using the contact details shown above. SEI sources data directly from FactSet, Lipper, and BlackRock, unless otherwise stated.


