The New World (Dis)Order (Long Version)
In 1918, the influenza pandemic took hold of the world in the immediate aftermath of World War I. A little over a century later, the world is witness to the reverse—a large European land war in the wake of another deadly pandemic where deaths are measured in the millions. In light of the war and accompanying humanitarian disaster, we provide our perspective on the possible impact that Russia’s ongoing attacks on Ukraine could have on the global economy and financial markets. Unfortunately, most of our conclusions can only be tentative given the unpredictability of the war itself. Like the pandemic that hit with full force this time two years ago, no one knows how long the conflict will last or how much it will damage the global economy. However, we are not flying totally blind; economic and financial responses to the COVID-19 pandemic and prior geo-political events serve as a guide.
Three months ago, we noted in our Economic Outlook that geopolitical uncertainty in the New Year was on the rise. The Russian troop build-up on the Ukrainian border topped the list of our near-term concerns, and we warned that an invasion would have major economic consequences. Indeed, there has since been a marked spike in the geopolitical risk (GPR) index, a measure first developed by researchers at the Federal Reserve Board (Exhibit 1).
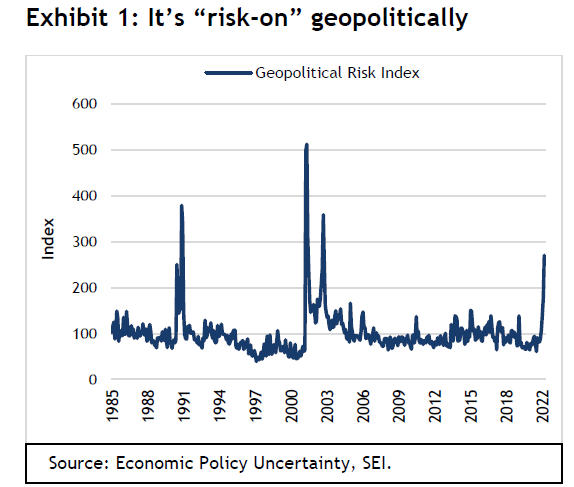
The GPR reflects automated text-search results of the electronic archives of 10 major international newspapers. It is calculated by counting the number of articles related to adverse geopolitical events in each newspaper for each month as a percentage of the total number of articles. The GPR has now reached its highest level since the 9/11 terrorist attacks and the start of the second war in Iraq in 2003.
Another version of the GPR, which extends back to 1900 and examines the archives of three newspapers, suggests that the current level of geopolitical risk is approaching the same area as many other serious regional conflicts and crises from the past. Among these is the 1973 Yom Kippur War, which ushered in the Arab oil embargo that upended the global economy and threw it into a deep and prolonged recession; other examples include the Suez Crisis (1956) and the Six-Day War (1967).
Unfortunately, the current conflict in Ukraine is reminiscent of the Yom Kippur War. Today, an oil shortage is once again front and centre at a time when inflation was already an uncomfortable problem for many countries. The shortages, of course, are not limited to oil and petroleum products. Trade in other critical commodities has also been disrupted by the imposition of sanctions and the unwillingness of shippers to get into harm’s way.
Exhibit 2 highlights how important Russian and Ukrainian commodity exports are to the world. Although Russia’s gross domestic product (GDP) amounted to just 1.8% of world GDP in 2020 (about the same as Brazil)1, its importance as a commodity exporter cannot be denied.
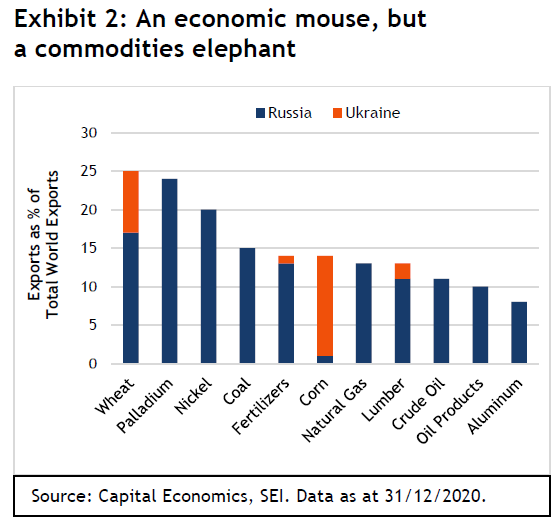
Using 2020 exports data, Russia accounts for almost 25% of the world’s palladium, 20% of nickel, 17% of wheat, 15% of coal, 13% of natural gas and fertilizers, and at least 10% of the world’s lumber, crude oil and petroleum products. The Ukraine, meanwhile, accounts for 13% of corn and 8% of all wheat exports in the world. These are totals that cannot be easily replaced in the near term.
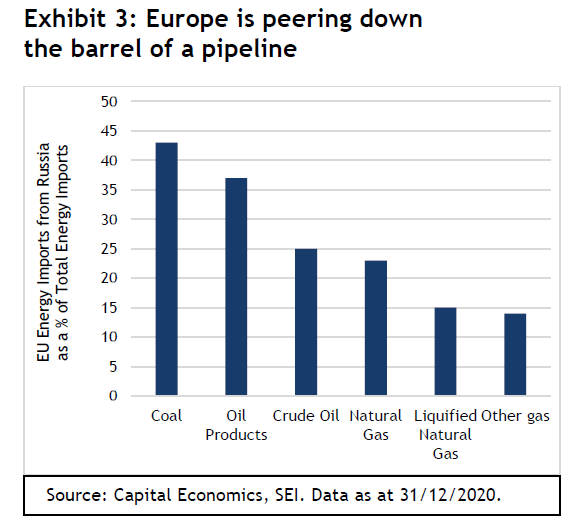
Europe’s dependence on Russian energy is especially concerning. Not only does such reliance make the region subject to energy blackmail, it also helps to fund Russia’s war machine. Exhibit 3 highlights the EU’s Russian energy imports as a percentage of the member countries’ total import needs. According to the International Energy Agency (IEA), the EU imported 25% of its crude oil from Russia.
The United Kingdom (UK) is much less reliant on Russia by comparison, with Russian oil imports accounting for 5% to 8% of total oil imports prior to the initiation of hostilities in Ukraine. There are no gas pipelines directly linking the UK with Russia; less than 4% of the country’s total gas supply came from Russia in 2021. Not only is the UK more diversified in its sources of oil and gas imports, but it is also a significant producer of fossil fuels and wind energy.
In the United States (US), disruption to the supply of several globally traded commodities has had a predictable result that be seen quite clearly. Commodity-price inflation is in the process of taking yet another leap. Prices have been soaring since the pandemic lows recorded in March and April of 2020. Exhibit 4 shows that metals prices had already breached their previous record high by April 2021, while raw industrials and foodstuffs broke records more recently.
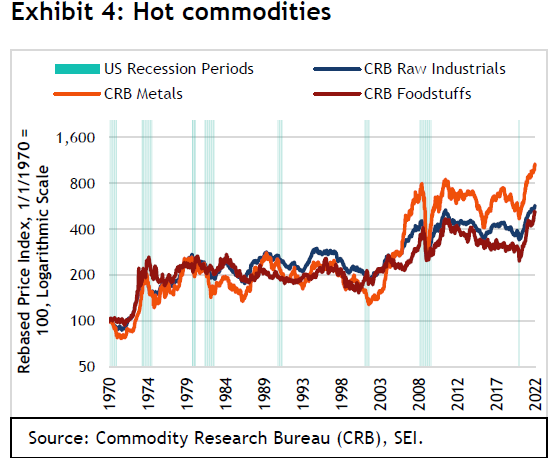
The upward trajectory in commodities inflation is nearly as sharp as it was in the early 1970s. It is hard to judge how high prices must go to equilibrate demand and supply at a time when commodities were already in short supply and demand is strong. It took a massive rise between 1972 and 1974 to reach that point—and an even sharper cumulative price increase over an even longer period of seven years to break the back of commodity inflation in 2008.
Higher prices eventually lead to more investment and increased supply—while also forcing sharp pullbacks in demand and economic recession. The only question is how long that process takes. SEI suspects that global economic growth will prove rather resilient in the short term, pushing sensitive commodity prices even higher in the months ahead.
Pre-invasion, we were optimistic that global economic growth would remain solid as countries eased their COVID-19-related restrictions and the economic impact of the pandemic faded. Europe was expected to grow at least as fast as the US, if not faster. This is now a questionable assumption. If the war in Ukraine drags on for a number of months and electricity costs continue to climb, Europe’s growth rate for 2022 could be under 3% (perhaps far less) instead of the projected 4% rate of inflation-adjusted GDP. The US economy probably won’t fall as short of expectations given its relative self-sufficiency when it comes to energy resources; we tentatively expect growth to be in the 3%-to-3.5% range for the full year, just one-half of a percentage point lower than prior expectations.
Uncertainty is the only certainty
We cannot emphasise enough how uncertain the economic environment has become. Instead of seeing a normalization of economic activity with fewer supply-chain snafus and easing COVID-19 restrictions, we are witnessing a war that will almost certainly extend and exacerbate the “everything shortage.” The Federal Reserve Bank of New York (FRBNY) publishes a measure of supply-chain stress, illustrated in Exhibit 5.
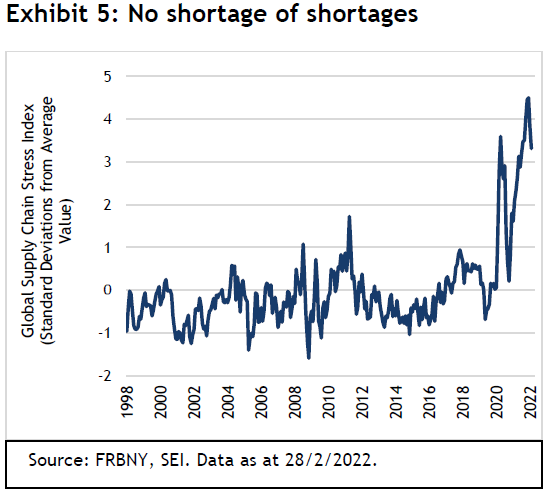
The measure takes into account transportation costs and supply-chain-related components derived from IHS Markit’s Purchasing Managers’ Index™, which comprises data from manufacturers across seven interconnected economies: China, Japan, South Korea, Taiwan, the UK, the US, and the euro area. This measure tries to strip out demand effects in order to isolate the pressures effecting global supply chains. As Exhibit 5 shows, while supply chain pressures were easing in January and February, they were still at exceptionally high levels relative to history. Given recent developments, we think the odds favour a return to the highs of late last year when the COVID-19 Omicron variant forced plant closures and additional delivery delays. Many of the largest ocean carriers have suspended taking new bookings to or from Russia. This has already resulted in pile-ups at origin ports, possibly causing congestion and increasing rates on these lanes.
Higher fuel costs caused by the hostilities are expected to be felt by shippers across the globe; ocean carriers who continue to service ports in the region may introduce war-risk surcharges for these shipments. Rail shipments from Asia to Europe also could be severely affected as a consequence of sanctions and Russian reprisals. If there is a significant shift in the numbers of containers being shipped via ocean instead of rail, one should expect further delivery delays and pressure on Asia-Europe freight rates as shippers compete for scarce capacity.
Finally, as we pointed out previously, COVID-19-related shutdowns in Asia remain an ever-present threat. Hong Kong has been experiencing the world’s worst current outbreak of infections over the past month or so. Meanwhile, rising infections led to a mid-March lockdown of Shenzhen (a major economic hub of China’s tech sector and electronic manufacturing industries) as well as a partial closure of the critically important port city of Shanghai.
Pent-up demand vs. demand destruction
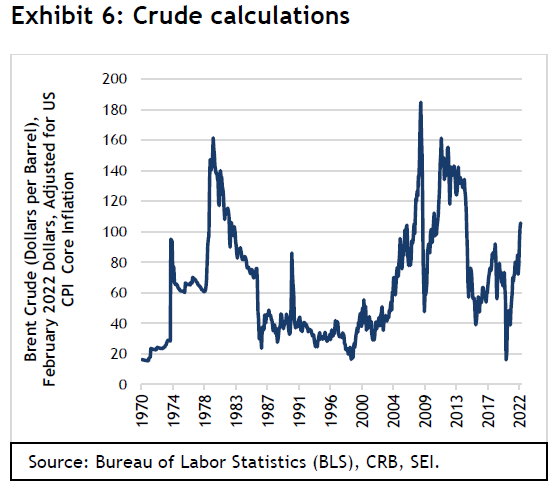
While the outlook has become more uncertain, there are some mitigating factors that could partially offset the economic damage caused by the invasion—at least as it pertains to the surge in energy prices. Exhibit 6 tracks the inflation-adjusted price of Brent crude over the past five decades. Although the world has received a hard punch, the real price of crude is only moderately higher than it was at the last price peak in 2018. At a current price of $106 per barrel, Brent is still well below the all-time high reached in June 2008 ($185 in today’s dollars) and the level recorded in November 1979 ($162) that coincided with the Iranian hostage crisis.
The comparatively smaller impact of today’s oil-price climb is partly due to major improvements in energy efficiency and the fact that most economies have become less energy intensive. According to Columbia University’s Center on Global Energy Policy2, oil usage per unit of GDP has been declining in linear fashion for decades. In its study, the researchers noted that almost one barrel of oil was needed to produce $1,000 worth of world GDP (measured in 2015 prices) in 1973. By 2019, only 0.43 barrel was used to produce the same inflation-adjusted $1,000 of world GDP. The ability of intermediate energy producers such as power plants to switch fuels is thought to be the main factor behind this steady progress. Improved production processes, more efficient final goods delivered to households and businesses (autos and trucks, planes and appliances, for example), the spread of technology via globalization and economic integration, and the increasing tilt of advanced economies toward services and away from manufacturing all play an important role.
Data from the World Bank and the International Energy Agency, which we show in Exhibit 7, tracks energy efficiency on a more comprehensive, total energy, basis. Total energy use is based on primary energy sources (all types of fossil fuel plus renewables) before transformation to other end-use fuels, such as electricity and refined petroleum products. GDP is converted to inflation-adjusted 2017 international dollars using purchasing power parity rates. In this chart, we measure the amount of GDP associated with a single barrel of oil.
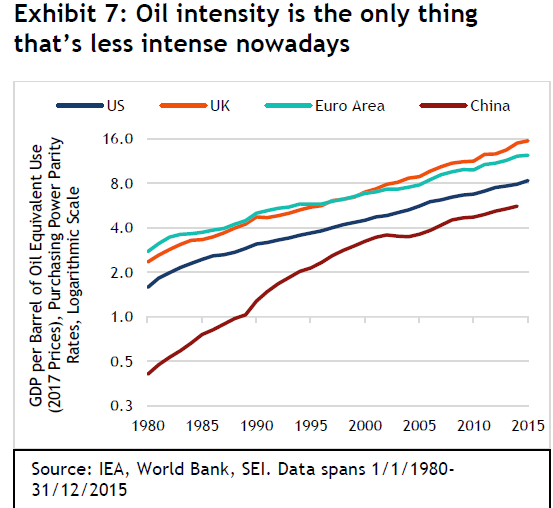
The US consistently lagged the UK and Europe between 1980 and 2015 (the latest data available), although growth trends among the three areas are very similar. China, by contrast, made great strides in its energy efficiency after it began to open up to the rest of the world during the 1980s under Deng Xiaoping. Since 2001, however, China’s improvement has slowed to a rate more in line with the advanced countries. This slowing reflects the hyper-fast growth the country enjoyed following its accession to World Trade Organization. Its energy efficiency is still only one-third that of the UK and about two-thirds that of the US.
The US and, to a lesser extent, the UK, still have an advantage over continental Europe in terms of their ability to access diverse sources of energy supply. The US also benefits from being net energy independent. It exports more coal, oil and natural gas than it imports (although it continues to be a net importer of crude oil). The US is still vulnerable to rising energy prices, but it at least enjoys a high degree of energy security, which Europe certainly does not.
Even if the war ends soon, Europe will need to make extraordinary efforts to diversify away from its dependency on Russia. The push to increase renewables will likely be accelerated, but the current crisis also highlights the fact that fossil fuels must remain an important part of the energy mix for decades to come. In the near term, the goal will be to build up gas and oil reserves for next winter. If Saudi Arabia and the UAE increase oil production, Iranian oil starts to flow again, nuclear-plant phase-outs are delayed, Germany continues to run its coal-fired power plants and the US can step-up its capabilities to deliver liquefied natural gas, the circle might be squared. Conserving energy by driving less and using less air conditioning during the summer also will help. There is still a distinct possibility, however, that we see a rationing of energy and rolling blackouts in Europe as early as the summer if a major heat wave hits.
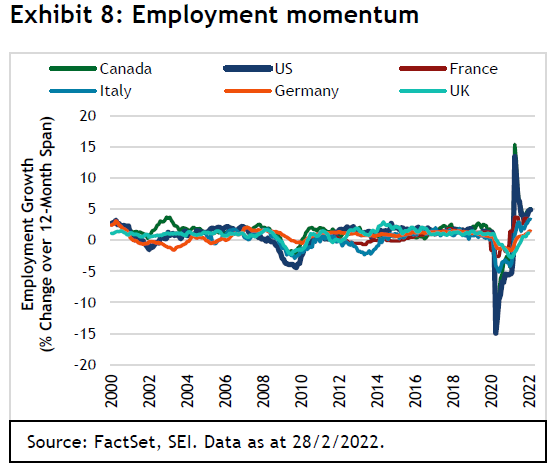
It is fortunate for the advanced economies that households and businesses were in mostly good economic and financial shape coming into the crisis. Exhibit 8 shows that year-over-year growth in employment was continuing to accelerate heading into 2022 despite the omicron outbreak. The US, Canada, France and Italy have been recording gains well ahead of their longer-term trends. Employment gains in Germany and the UK haven’t been quite as strong, but job growth in those two countries is still at or slightly above the pre-pandemic trend. The latter two countries also experienced smaller-year-on-year declines during the 2020 pandemic lockdowns as a consequence of furlough schemes that kept workers officially employed.
Despite this labour-market vibrancy, workers’ wages have begun to fall behind the high inflation rates recorded in the US and elsewhere. Exhibit 9 highlights the US Employment Cost Index, adjusted for inflation using the US Bureau of Economic Analysis price index for personal-consumption expenditures to examine the relationship between total compensation changes and economic recessions.
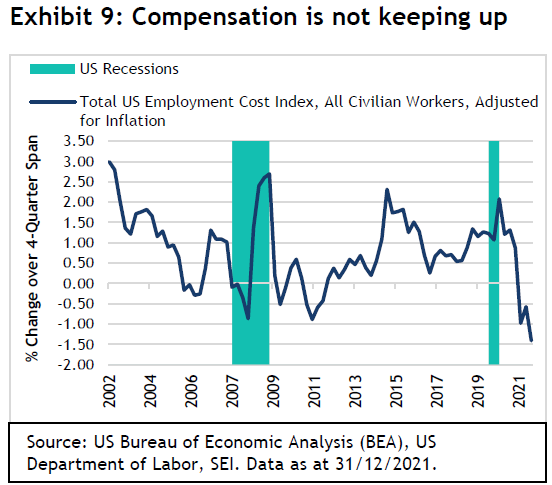
This quarterly measure of total compensation provides a more accurate picture of wage and benefits changes because it adjusts for shifts in the occupational mix of workers. That is important given the sharp swings caused by the pandemic in lower-wage, consumer-facing restaurant, retail and leisure industries.
On a year-over-year basis, real employee compensation contracted by 1.4% through the fourth quarter of 2021. That is the biggest drop in the history of this statistic, which goes back 20 years. This decline most likely worsened in the first quarter.
One would think that this contraction in real wages and salaries is a sure sign that an economic recession is already underway. Yet that is not the case. First, the tight labour market and minimum-wage hikes have benefited lower-wage workers to a greater degree than higher-wage workers. The Federal Reserve Bank of Atlanta’s wage tracker, highlighted in Exhibit 10, shows that the median wage growth for the lowest income quartile is up 5.9% over the 12 months ended February. That gain nearly matches the 6.1% rise in the Fed’s price index for overall personal-consumption expenditures. By comparison, the overall median wage gain over this period amounts to only 4.3%.
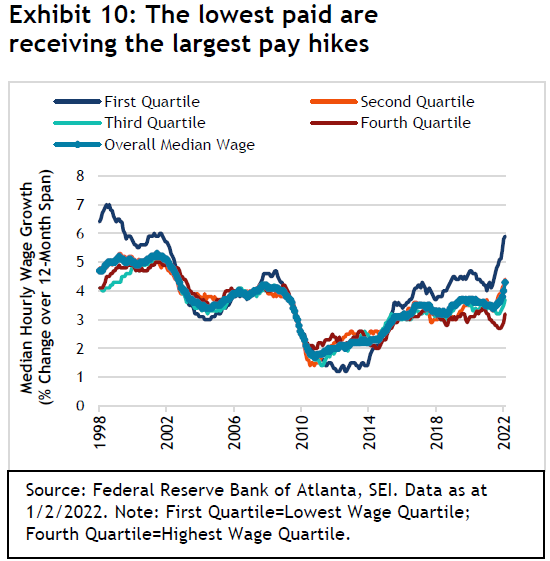
While wage gains are lagging inflation at the upper quartiles, higher-income groups tend to have a greater financial cushion. The top quartile has benefited especially from the boom in home prices and the long bull market in financial assets. In addition, these households hold the bulk of excess saving that built up during the pandemic. They have the wherewithal and, presumably, the desire to spend on goods and services that either have been in short supply (cars, houses, and furniture, for example) or were avoided due to COVID-19 related fears and restrictions (such as dining out and vacationing).
Although incomes in the aggregate are not keeping up with inflation, we anticipate that households will draw down their stock of excess savings and increase debt in an effort to maintain their living standards. In the US, the household saving rate has already fallen to 6.3% of disposable income as at February 2022 from an average of 7.5% over the 2014-to-2019 period. Between 2005 and 2007, by contrast, the saving rate averaged less than 4%. Today, each percentage point drop in the saving rate would translate into a 6% increase in personal outlays and a 4% gain in nominal GDP. Exhibit 11 compares the US, UK and Canadian saving rates.
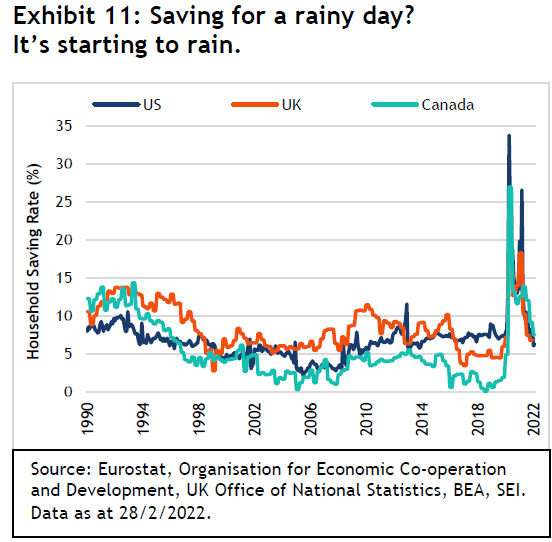
Although not exactly comparable, the household saving patterns appear much the same across all three countries. Saving rates are coming down from the high levels attained during the worst of the pandemic. This means that the financial conditions of households are beginning to deteriorate. Still, the starting point is a strong one.
The same can be said for the business sector. As we show in Exhibit 12, the long period of ultra-low interest rates have allowed companies to engage in a refinancing boom. Earnings before interest and taxes in the US non-financial corporate sector cover interest expense 7.9 times, the highest ratio in more than 50 years.
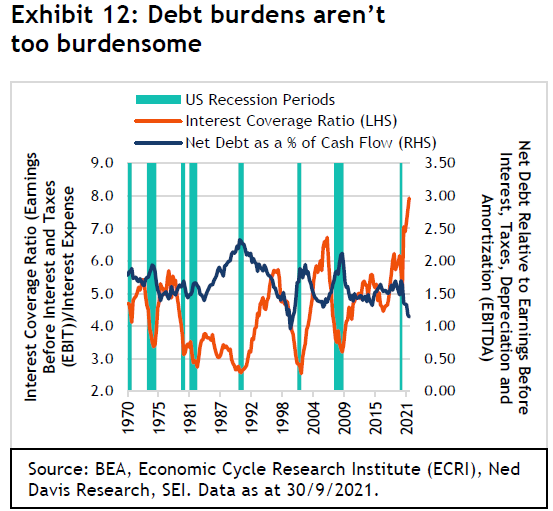
The ratio of net debt (long-term debt minus cash holdings) to earnings before interest, taxes, depreciation and amortization (EBITDA), meanwhile, also is low relative to its historical record. While rising interest rates are a headwind for both households and corporations, we think it will take another year or two before the economy starts to run into serious trouble.
The conflicts and contradictions of government policy
Russia’s aggression toward Ukraine has placed government leaders in the US, Europe and other advanced countries in a quandary. They have been tasked with responding urgently to the crisis by providing support while simultaneously pulling back on monetary and fiscal excesses that are partially to blame for the worst inflation experienced in decades.
The fiscal response to inflation in Europe is likely to be much stronger than in the US European governments will seek to mitigate the invasion-induced impact of spiking fuel and electricity costs on their citizens with subsidies. Money also needs to be directed toward the millions of Ukrainian refugees who have been pouring across the borders of Poland and other front-line Eastern European countries.
The US fiscal response to inflation, by contrast, will continue to be bedevilled by gridlock. Although most countries have recorded large increases in debt over the past two years as a result of emergency COVID-19-related spending, the US registered one the largest expansions. It also has one of the worst inflation problems among the major economies at a time when the domestic political environment is in an extremely fractious state. Granted, the Democrats and the Republicans in Congress have been able to work together recently to finally enact a budget agreement for the current fiscal year (almost six months late), along with a debt-ceiling increase and a $13.6 billion aid package for Ukraine. It probably will be difficult to pass additional legislation aimed at supporting the domestic economy between now and the November mid-term elections.
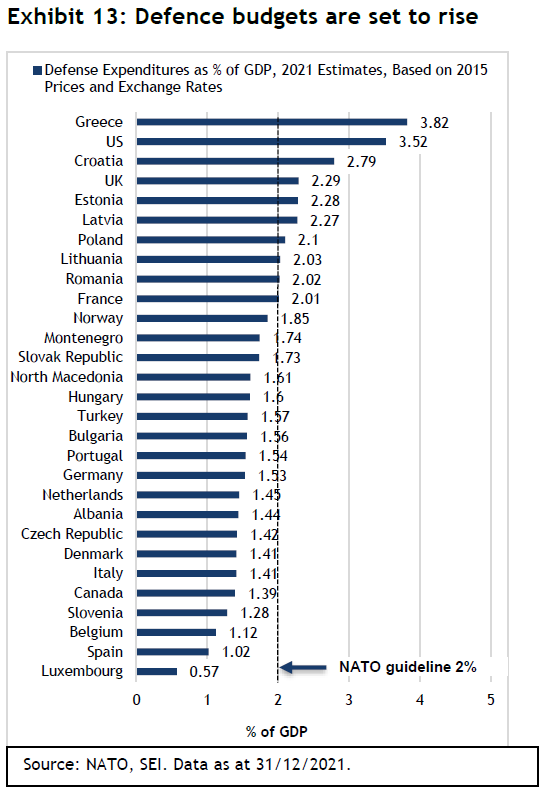
Overall military spending by NATO countries will also be adjusted upward significantly in the years ahead—not only to provide more military aid to Ukraine, but also to improve NATO’s own military readiness in order to dissuade Russia from future aggression against other sovereign states. Germany has already announced a major supplementary defence-spending package of €100 billion ($110 billion) this year to modernize its armed forces. By comparison, its total annual defence spending in 2021 totalled €53.2 billion ($64.7 billion), according to NATO estimates. The country also has pledged to finally meet its annual NATO obligation of spending at least 2% of GDP on its military by 2024. Exhibit 13 shows that Germany isn’t the only nation that has failed to spend sufficiently on its own defence. In 2021, only the US, UK, France, Poland, and a handful of smaller Eastern European countries met the 2% goal.
While fiscal responses to the Ukrainian crisis will likely differ between Europe and the US, monetary-policy responses are more uniform. Indeed, the move toward higher interest rates and the end of quantitative easing appear to be a global trend (with the main exception being Japan, which is in no hurry to raise its policy rate or end it yield-curve control regime).
Several emerging economies in Latin America and Eastern Europe have already been raising their policy rates aggressively over the past year in order to defend their currencies and attract capital.
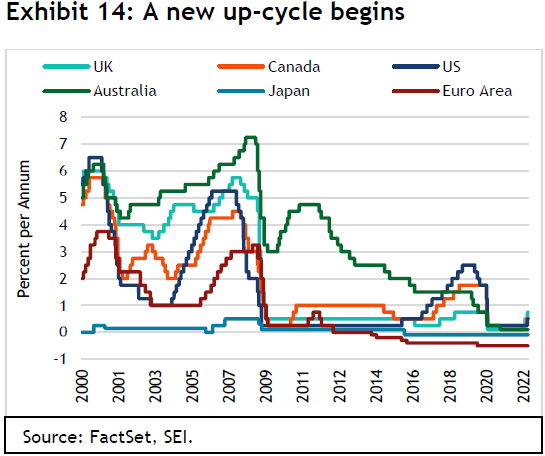
Policy interest rates among the major developed-country central banks have now begun to rise too, as we show in Exhibit 14. The UK kicked off the latest upcycle in advanced-country interest rates last December and has since increased its benchmark interest rate twice more, most recently in mid-March.
The Bank of Canada posted its first policy-rate hike in early March, but announced its end to quantitative easing last October; the central bank will soon allow its bond holdings to fall as securities mature.
The European Central Bank (ECB) has yet to hike its main lending rates. Nonetheless, it provided a hawkish surprise by signalling that it will end its quantitative-easing efforts in the third quarter, and will then (“after some time”) issue its first interest-rate increase since April 20113. We thought the ECB would be less inclined to speed up the normalization of its monetary-policy rate given the depressive economic of the war. However, the sharp rise in inflation this year has driven the central bank’s decision. Be that as it may, ECB President Christine Lagarde stressed the need for “maximum optionality” when it comes to dealing with the impact of Russia’s aggression toward Ukraine on growth and inflation.
The US Fed provided an even more hawkish signal versus expectations. Although the 25 basis-point rise in the federal-funds rate and the end of quantitative easing in March were well-telegraphed, investors did not expect the central bank’s assessment of future interest-rate increases—an additional 150 basis points in 2022, and another percentage point increase next year. That would bring the federal-funds rate to a peak (or terminal) rate of 2.8%, which is above the Fed’s long-run equilibrium level of 2.4% for the federal-funds rate. Investor expectations for the peak rate, as measured by overnight swap contracts, was less than 2% prior to the Fed announcement. Just days after the central bank’s announcement, Fed Chair Jerome Powell opened the door to the possibility of a 50 basis-point jump in the funds rate following the next policy meeting in early May.
The Fed appears to be generally aligned with the market view of inflation, although market expectations have drifted upward in the past month. Both still see the current inflation rate as mostly transitory in nature, and expect it will return closer to the Fed’s target in about three years. Exhibit 15 tracks the annual progression of inflation as implied by the swaps market.
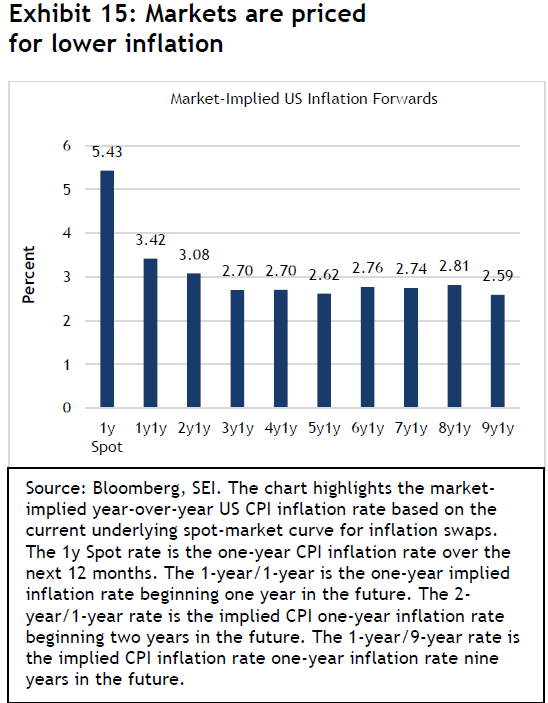
It suggests that investors anticipate a higher inflation rate than the Fed over the next 12 months—at which point their expectations decelerate dramatically over the following 24 months and settle about 25 basis points above the Fed’s long-run equilibrium inflation rate.
While Fed watchers seem to agree with the central bank’s longer-term inflation outlook, they disagree with its projections for economic growth. There is scepticism that the Fed can raise interest rates as aggressively as it currently predicts without causing a sharp slowdown in economic growth and an increase in the unemployment rate. The Fed, by contrast, sees the unemployment rate staying in the 3.5%-to-3.6% range through 2024. Surprisingly, history seems to favour the Fed’s view, at least to an extent. In Exhibit 16, we compare the unemployment rate against the federal-funds rate over the past six decades. We count seven periods when the funds rate rose sharply, but the unemployment rate continued to decline for at least a year and often much longer (1961-1969, 1971-1973, 1976-1979, 1986-1989, 1994-2000, 2004-2007, and 2015-2019).
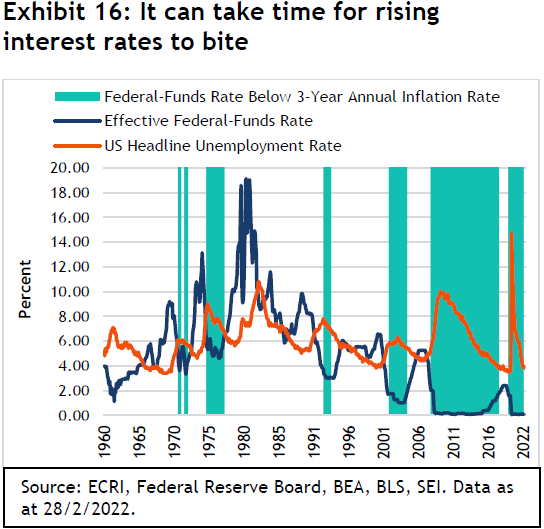
On five of those occasions, the federal-funds rate was equal to or below the three-year change in the inflation rate (as measured by the core personal-consumption expenditures index) at the start of the tightening cycle. These periods of negative real rates are highlighted in the chart. With interest rates once again below the inflation rate (now by the widest margin since the mid-1970s), it is possible that economic activity will not slow dramatically until nominal rates are considerably higher than they are today.
As noted above, households and businesses are in strong financial shape coming into this newest rate-hiking cycle even as there is a great deal of pent-up demand. It may well take some time to put a big dent in this economic momentum. Of course, the economy will eventually tip into recession if the Fed is forced to raise interest rates well above the inflation rate. That may happen during the current cycle if inflation proves harder to tamp down than currently anticipated.
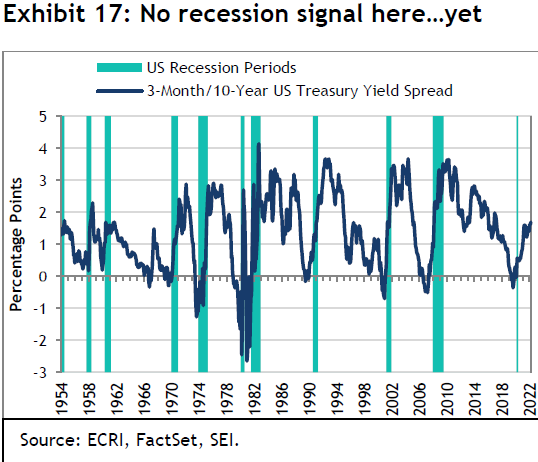
Those with a more pessimistic near-term economic outlook note that the US Treasury yield curve has flattened and even inverted (meaning shorter-term yields are trading above long-term yields) along portions of the curve beginning at the two-year maturity mark. In the US, the shape of the yield curve has been a reliable indicator of where the economy is headed in the next year or two. While financial conditions in the country are indeed tightening, we are using caution as we interpret the implications of a flat/inverted yield curve this time around. Exhibit 17 shows that the spread between short-term interest rates and longer-term bond yields has been widening, not flattening, at the short-term end of the yield curve.
This should not be surprising since the very short end of the yield curve is closely tied to movements in the federal-funds rate itself. If the Fed increases the funds rate as aggressively as it has indicated, even this part of the yield curve will flatten by the year’s end.
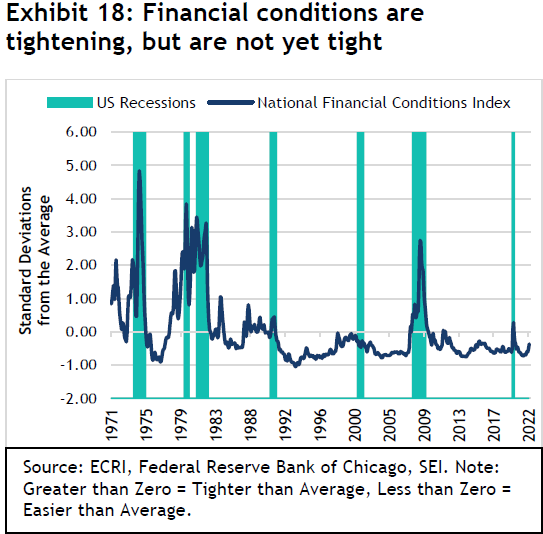
Rather than key in on the current configuration of the yield curve, we prefer to look at broader measures of financial stress. As we show in Exhibit 18, the Federal Reserve Bank of Chicago’s National Financial Conditions Index (NFCI) has jumped sharply in the past month but does not yet appear to be in the danger zone. This statistic tracks over 100 financial-activity variables measuring risk, credit and leverage. Positive values of the NFCI have been associated with financial conditions that are tighter than average, while negative values signal that financial conditions are easier than average. The NFCI has been increasing (conditions getting tighter) since hitting a seven-year low in June 2021, but that rise accelerated meaningfully in February and March this year. This indicator tends to rise sharply as financial stress materializes, so its recent behaviour bears close monitoring. If the NFCI continues to spike in the months ahead, it would be a sign that an economic recession may be arriving sooner than later. That said, given the strong financial position of households and businesses in the US, recession does not yet appear to be an imminent event.
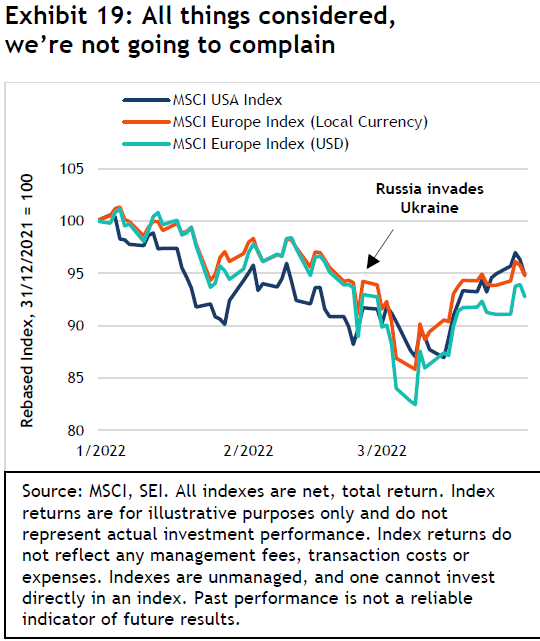
Equity investors seem to agree with our assessment. Despite the war, despite the prospect of a more intractable global inflation problem, and despite the pivot made by the Fed and other central banks to deal with that inflation problem, equity markets performed better in the first quarter than one might have expected. Even the major stock markets in Europe, as measured by the MSCI Europe Index (total return), have managed to rebound from sharp declines sustained in the early days of Russia’s invasion. Exhibit 19 compares Europe’s performance against the US in the year-to-date, in both local-currency and US dollar terms. The MSCI Europe Index (total return) declined by only 5.2% in local-currency terms for the period, on par with its US counterpart. In US dollar terms, European equities lagged the MSCI USA Index (total return) by 2% due to the appreciation of the US dollar.
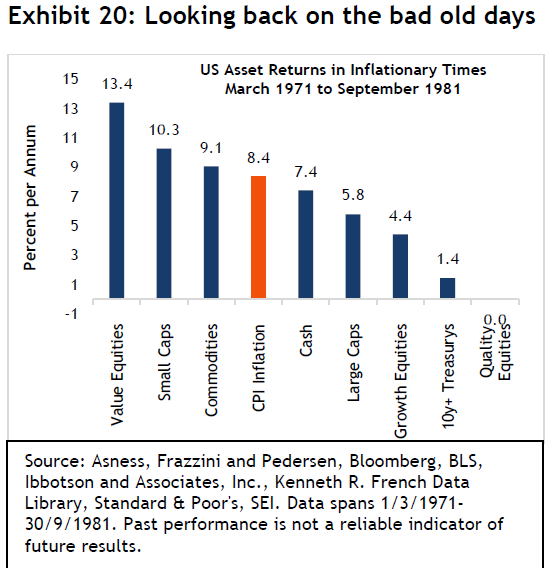
There is no denying that uncomfortably high inflation and a turn upward in the interest-rate cycle present major challenges for financial assets beyond the uncertainties caused by war. This is especially so for long-duration assets, such as growth-oriented equities that trade at higher earnings multiples and longer-maturity bonds. Still, if history is a guide, 1970s data indicate that it’s possible for risk assets to hold up well during periods of stagflation (that is, when below-average economic growth combined with above-average inflation). This is illustrated in in Exhibit 20. It summarizes a recently published report by SEI’s Quantitative Equity Management team that tracks the performance of different asset classes over a 10.5-year period of persistently high inflation that began in 1971 (From 10 days of war to 10 years of inflation?).
US inflation, as measured by the Department of Labour’s consumer-price index, averaged 8.4% per annum from March 1971 to September 1980. Value equities (the top 30% of equities ranked by book-value-to-price), small-cap stocks (the bottom 30% of US equities ranked by market capitalization) and commodities (the S&P GSCI Commodity Index), managed to exceed the inflation rate over this period. In contrast, equities ranked on quality metrics (profitability, safety, growth and high payouts to shareholders) recorded no change in nominal terms in the period, thus lagging inflation by 8.4% per annum. Long-term Treasurys with maturities of 10 years and more appreciated only about 1% per annum in nominal terms. Large-cap equities (represented by the S&P 500 Index) lagged both inflation and cash (three-month US Treasury bills).
It might be surprising to see that quality equities did so poorly during the 1970s. This can be attributed to the fact that many of these stocks were caught up in the Nifty-Fifty craze that drove a large selection of large-cap stocks to tremendous valuations. Leading companies in this grouping included IBM, ITT, Xerox, Coca-Cola, Pepsi, Philip Morris, Avon, Gillette, International Flavours & Fragrances, Johnson & Johnson, Pfizer, Merck & Co., Disney, Eastman Kodak, and Polaroid. They possessed strong balance sheets, high profitability, consistent growth and an aura of invincibility. They also traded at notably high multiples, with half of them sporting price-to-earnings ratios of 40 or more. Ultimately, as inflation and interest rates soared and the global economy fell into deep recession on the heels of the Arab oil embargo, valuations of Nifty Fifty companies were slashed and prices fell sharply, as much as 70% to 90%. Most of these bubble-era stocks spent the rest of the decade well below their peak values.
While we are not forecasting a return to such an extreme economic environment, recent market performance shows some similarities to that earlier period. Commodity markets have been surging due to the shortages caused by COVID disruptions, and now by the war in Ukraine. Value stocks have performed well in the year-to-date in the US, led by a large 40% absolute price gain in the energy sector and better-than-benchmark performances in financials, utilities, industrials, materials and healthcare, as measured by the S&P 500 Index. Meanwhile, technology and equities with high multiples have suffered as price-to-earnings ratios contract amid the climb in bond yields. The bond-market decline is especially notable. Since the start of the year, the Bloomberg Global Aggregate Bond Total Return Index has fallen 6.2%, an even worse performance than the MSCI USA and MSCI Europe equity indexes.
In emerging markets, Latin America has bucked the trend seen in other regional markets, as we show in Exhibit 21.
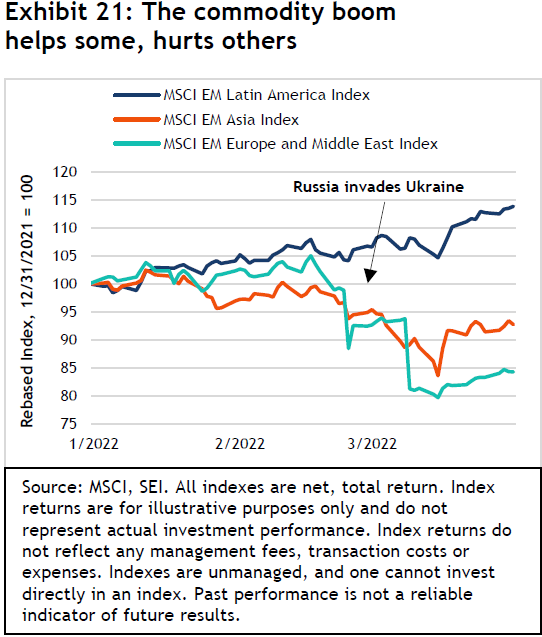
In the year-to-date, the MSCI Emerging Markets Latin America Index (total return) has risen 13.8% in US dollar terms. The region generally benefits from the rise in commodity prices. In addition, the jump in interest rates in countries like Brazil and Mexico has stabilized their currencies against the US dollar despite currently high domestic rates of inflation.
By contrast, Europe and Asia have been poor performers thus far in 2022. Even before the invasion, the emerging stock markets in Europe were giving ground as tensions ramped up between Russia and Ukraine. The MSCI Emerging Markets Europe Index (total return) peaked with a positive 5% year-to-date return as at 15 February; by the end of the first quarter, it was down 15.7%. Emerging Asia, as a major consumer of commodities, also has lost ground. The Chinese and Hong Kong stock markets have been especially volatile. As previously noted, COVID continues to exert an impact on economic activity. In particular, the technology sector in China remains under pressure, although strong government declarations of support resulted in a big rally in the middle of March that pushed the MSCI Emerging Markets Asia Index (total return) index up 9.6% in just two trading sessions. Amid all this volatility and variability in regional and sector performance, emerging markets appear to be fertile ground for active management.
The bottom line
Here are our key conclusions:
- The Russian war against Ukraine is a seminal event that will worsen the shortages and inflation pressures that already were being felt as a result of COVID-19.
- Even if peace breaks out tomorrow, Russia will be isolated economically and become dependent on China financially and economically.
- The US Fed and other major central banks have no choice but to transition from supporting economic growth with extremely expansive monetary policies to fighting inflation with higher interest rates and quantitative tightening.
- Fiscal policy, especially in Europe, will likely continue to be expansionary in order to mitigate the impact of price spikes in food and energy; provide military support to Ukraine and open-ended aid to millions of war refugees; bolster NATO defences and improve energy security.
- Fears of a recession in the US and Europe this year or next appear misplaced, although growth will likely be slower than had been anticipated prior to the invasion. However, the odds of recession will climb beyond next year, as global interest rates adjusted for inflation rise and the financial positions of households and business deteriorate.
- Equity markets rebounded surprisingly sharply in the final weeks of March, highlighting the resiliency and adaptability of publicly traded companies. Despite this, investors should continue to expect more volatility and mixed equity performance as a result of war uncertainty, stubbornly high inflation, and tighter monetary policies.
- The threat of stagflation is a possibility. In the 1970s, similar economic conditions saw value equities, small-cap stocks and commodities among the best-performing asset classes, while bonds and stocks with high earnings multiples lagged badly.
- While the past is not necessarily prologue, we note that the best-performing areas in the year to date have been commodities, commodity equities, value-oriented equity, and defensive sectors. Active managers also have had an easier time outperforming passive benchmarks as mega-cap stock prices fell.
What actions are our portfolio managers taking?
Periods of crisis and instability are worrying for all investors, particularly as the turn of events in the short term can be difficult to predict. We saw this in the first few weeks following Russia’s invasion of Ukraine, as financial-market impacts from the crisis overwhelmed more traditional market drivers.
During times like these, one of the greatest mistakes an investor can commit is to panic and make indiscriminate changes out of fear of losing money. In periods of unusual stress, a clear philosophy and process can guide calm, rational, long-term decision making.
Volatile environments provide an opportunity for active managers to review risks and exposures, seeking to weed out the likely losers from the winners. Accordingly, we and the investment managers (sub-advisors) that we work with have been reviewing all positions and reassessing the risks and potential rewards. As of today, we have seen little portfolio turnover as the market has been quick to adjust prices. Making changes without clarity about the immediate outlook would likely be short-sighted, so it is something that we seek to avoid.
In general terms, higher-quality, lower-risk stocks were more resilient during the first quarter, as is often the case in times of crisis. Accordingly, our long-standing preferences for quality firms (those with real profits) was helpful. Likewise, our managed-volatility strategies demonstrated their value. Still, more than anything, turmoil of this nature further reinforces our belief in diversification as a sound investment strategy. From the years-long COVID-19 pandemic and supply-chain shocks to inflation and war, the world is an unpredictable place where events both near and far from home can sometimes have dramatic effects on financial markets. For the simple reason that no one knows what tomorrow will bring, we diversify our portfolios.
Here’s how we’re thinking about the current investment landscape in terms of our alpha source framework.
Momentum: If the fallout from the Ukraine conflict marks a shift in the economic regime (perhaps from a reflationary environment to a period of economic stagflation) or the evolution of new market trends (due to energy shortages or other evolving issues), our momentum-oriented strategies will systematically and unemotionally adapt to the new environment more quickly than other investors anchored to past beliefs.
Value: If the macroeconomic backdrop or operating environment materially changes the medium-term earnings power or risk profile of individual companies, our value managers will realign portfolios into those stocks offering the best expected risk-return payoff.
Quality: We expect to make the least amount of change to our quality allocations. Yet, if the long-term competitive advantages of any given firm has been eroded as a result of the disruption caused by this crisis, we will see individual stock turnover.
How were portfolios positioned at the end of the quarter?
Within US equities, SEI’s active large-cap strategies saw a payoff to value, which had a good quarter that we believe could get better. We remained disciplined with regard to sub-advisor allocations, maintaining our value weights at current levels. Modest profit-taking early in the quarter reflected disciplined portfolio management. In our active US small-cap strategies, we maintained a strong preference for quality, favouring profitability over top-line growth. There has been a rotation toward profitable companies and away from those with no earnings. On the value side, there’s a case to be made that value stocks have logged much of their expected gains in the small-cap space. Our deep-value strategies became less pro-cyclical as they reduced exposure to some of the low-end consumer names.
International equities saw big declines from financial and European banks as a result of the war in Europe. There is still contagion risk. Russia remains a wild card. Structurally and fundamentally, a flat yield curve is not a good sign for the banks or financials. Therefore, our general underweight has remained in place. Our strategies maintained overweights to materials, capital goods, and semiconductors. Higher-quality health care stocks have offered fair prices and good quality. Emerging-market tech stocks have been crushed. Our strategies remained underweight emerging technology.
While value stocks have been strong this year, much of that strength has been concentrated in the US We continued to put capital and new flows into value.
Asia and emerging markets are, of course, notable because the Russian market has been effectively closed to foreign investors. Russian equity valuations were marked to zero, as the Russian economy was set back fifteen years in a single week. While our portfolios fared relatively well in terms of direct exposure, overweights to Hungary and Poland hurt performance. The war has benefited commodity-focused countries, such as Brazil, which benefited from rising prices. China and India have faced diplomacy challenges. Their reliance on Russia for weapons from Russia put them in opposition to the nations imposing sanctions on Russia. They are walking a tight rope between Russia and the West. Overall, there were no notable changes to portfolio positioning during the quarter. Overweights to materials and energy enhanced returns, as did an underweight to China (technology and ecommerce).
As for low-volatility investing, this seems like the right place and right time. The entire asset class and quantitative approach fared well during the quarter. Our portfolios are low-turnover, so they remained little changed. Despite short-term noise, we see plenty of long-term tailwinds and believe value stocks remain attractive.
Global fixed-income markets were broadly in the red this quarter, with longer duration and more credit-sensitive sectors suffering the most. The worsening growth-inflation tradeoff has become more transparent as central banks look to hike into the showdown. Our strategies generally benefitted from a duration underweight over the last three months. Within credit, we remain concerned about rate risks and tight spreads; thus, we prefer to be underweight spread duration. We are also looking to take advantage of opportunities within local rates in the emerging markets, which offer attractive real yields.
Our outlook on high-yield has not changed. Interest rates, geopolitical risks and inflation are the primary concerns. We remained underweight BB rated bonds, overweight B and overweight CCC. The allocation to collateralized loan obligations was trimmed during the quarter. We were overweight basic industry on attractive relative valuations. Underweights included the telecommunications and services sectors. The leisure sector was also underweight (recreation, travel, hotels) as a result of caution due to impacts from COVID-19. We were short duration on rising rates.
Important Information
This material is not directed to any persons where (by reason of that person's nationality, residence or otherwise) the publication or availability of this material is prohibited. Persons in respect of whom such prohibitions apply must not rely on this information in any respect whatsoever. Investment in the funds or products that are described herein are available only to intended recipients and this communication must not be relied upon or acted upon by anyone who is not an intended recipient.
This material represents an assessment of the market environment at a specific point in time and is not intended to be a forecast of future events, or a guarantee of future results. While considerable care has been taken to ensure the information contained within this document is accurate and up-to-date, no warranty is given as to the accuracy or completeness of any information and no liability is accepted for any errors or omissions in such information or any action taken on the basis of this information.
SEI Investments (Europe) Limited (SIEL) acts as distributor of collective investment schemes which are authorised in Ireland pursuant to the UCITS regulations and which are collectively referred to as the “SEI Funds” in these materials. These umbrella funds are incorporated in Ireland as limited liability investment companies and are managed by SEI Investments Global Limited, an affiliate of the distributor. SEI Investments (Europe) Limited utilises the SEI Funds in its asset management programme to create asset allocation strategies for its clients. Any reference in this document to any SEI Funds should not be construed as a recommendation to buy or sell these securities or to engage in any related investment management services. Recipients of this information who intend to apply for shares in any SEI Fund are reminded that any such application must be made solely on the basis of the information contained in the Prospectus (which includes a schedule of fees and charges and maximum commission available). Commissions and incentives may be paid and if so, would be included in the overall costs.) Please refer to our latest Prospectus (which includes information in relation to the use of derivatives and the risks associated with the use of derivative instruments), Key Investor Information Document, Summary of UCITS Shareholder rights (which includes a summary of the rights that shareholders of our funds have) and the latest Annual or Semi-Annual Reports for more information on our funds, which can be located at Fund Documents.’ And you should read the terms and conditions contained in the Prospectus (including the risk factors) before making any investment decision.
Data refers to past performance. Past performance is not a reliable indicator of future results. Investments in SEI Funds are generally medium- to long-term investments. The value of an investment and any income from it can go down as well as up. Returns may increase or decrease as a result of currency fluctuations. Investors may get back less than the original amount invested. SEI Funds may use derivative instruments which may be used for hedging purposes and/or investment purposes. This material represents an assessment of the market environment at a specific point in time and is not intended to be a forecast of future events.
In addition to the usual risks associated with investing, the following risks may apply: Bonds and bond funds are subject to interest rate risk and will decline in value as interest rates rise. High-yield bonds involve greater risks of default or downgrade and are more volatile than investment-grade securities, due to the speculative nature of their investments. International investments may involve risk of capital loss from unfavourable fluctuation in currency values, from differences in generally accepted accounting principles or from economic or political instability in other nations. Emerging markets involve heightened risks related to the same factors as well as increased volatility and lower trading volume. Narrowly focused investments, securities focusing on a single country, and investments in smaller companies typically exhibit higher volatility.
The opinions and views in this commentary are of SIEL only and are subject to change. They should not be construed as investment advice.
This information is issued by SEI Investments (Europe) Limited (SIEL) 1st Floor, Alphabeta, 14-18 Finsbury Square, London EC2A 1BR, United Kingdom. SIEL is authorised and regulated by the Financial Conduct Authority (FRN 191713).
Issued in South Africa by SEI Investments (South Africa) (Pty) Limited FSP No. 13186 which is a financial services provider authorised and regulated by the Financial Sector Conduct Authority (FSCA). Registered office: 3 Melrose Boulevard, 1st Floor, Melrose Arch 2196, Johannesburg, South Africa.
This commentary is intended for information purposes only and the information in it does not constitute financial advice as contemplated in terms of the Financial Advisory and Intermediary Services Act.
SEI sources data directly from FactSet, Lipper, and BlackRock unless otherwise stated.


