Monthly Market Commentary: Unrelenting Recoveries Despite Unresolved Diplomacy
Economic Backdrop
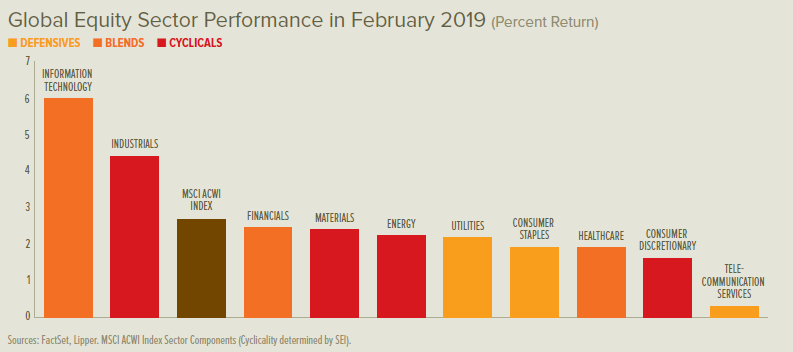
Equity markets around the globe continued their recoveries unabated in February. UK, eurozone and US government-bond yield curves steepened as long-term rates increased by more than short-term rates. Sterling strengthened versus the euro and US dollar, mostly near the end of February, and oil prices were slightly higher on the month.
Prime Minister Theresa May delayed a parliamentary confrontation on the path forward for Brexit, setting up a series of votes to occur from 12 to 14 March—first on whether to approve her deal, then (if the first vote fails) on whether to offer explicit support for a no-deal Brexit, and finally (if the second vote also fails) on whether to delay Brexit. If all three proposals are rejected and no action is taken by 29 March, members of parliament can push for votes on a second referendum or a revocation of Article 50 (which is the UK’s notice of departure to the EU). May ruled out the passive outcome of a no-deal Brexit.
The prime minister informed European Council President Donald Tusk in late February that she may still need to delay Brexit even if her deal earns parliamentary approval; there’s evidence that EU leaders would prefer one large postponement—likely by converting the transition period through 2020 into a delayed divorce—rather than an open-ended number of multi-month extensions. An increasingly active bi-partisan alliance in UK parliament has also been agitating for a delayed Brexit, which is why May is including this as an option in the mid-March series of parliamentary votes.
US trade negotiators expressed optimism about progress with their Chinese counterparts during February, although concrete developments remained limited to assurances from China to increase US agricultural imports; US President Donald Trump announced that the 1 March deadline to reach a trade deal would be extended. The US president and North Korea’s Supreme Leader Kim Jong Un held a second summit in Vietnam near the end of the month. Trump concluded that North Korea was not making adequate concessions about denuclearisation to warrant the removal of sanctions, and ended the meeting earlier than planned.
The Bank of England’s early-February Monetary Policy Committee meeting produced no new actions. Its post-meeting statement expressed continued bias toward a gradually tighter policy; however, if the Brexit outcome creates economic stress, the central bank is widely expected to provide an accommodative response. Neither the European Central Bank (ECB), the US Federal Reserve (Fed), nor the Bank of Japan held policy meetings in February. However, the ECB released minutes from its January meeting that revealed rising concerns about weak economic growth, and key members of the Fed’s policy-setting committee gave speeches confirming its patient, data-dependent approach to future tightening decisions.
UK manufacturing conditions settled into slow-growth territory in February. The British economy expanded by 0.2% in the fourth quarter of 2018 and 1.3% year over year. Eurozone manufacturing contracted in February after modestly accelerating in the prior month, yet services growth accelerated. The eurozone unemployment rate was 7.8% in January, unchanged from December’s downward-revised level. Overall eurozone economic growth registered 0.2% in the fourth quarter and 1.2% year over year. Activity in the US services sector accelerated significantly in February; manufacturing growth moderated, albeit to still-healthy levels. Total US economic growth measured an annualised 2.6% during the fourth quarter, slower than the previous quarter but above expectations.
Our View
As painful as 2018 was for risk assets, their gyrations were not outside the norm. Rather, given our views that the global economy would continue to grow and that market participants were overreacting to the concerns of the day, we saw another important risk-on opportunity developing in equities and other risk assets. We therefore determined that a rebalancing of assets back toward undervalued equity classes was an appropriate and timely response.
In our view, the US economic position remains fairly solid. Points of strength include the improving economic position of US households as labour markets tighten and real wage growth accelerates, while increased government spending has also helped. With Democrats controlling the House of Representatives and Republicans holding power in the Senate, any fiscal-policy agreement made during a period of political gridlock will likely mean slightly more federal-government spending—not less.
Some Fed officials, including Chairman Jerome Powell himself, explicitly acknowledge that the federal-funds rate is now near a level that can be
considered neither stimulative nor deflationary. The important thing to remember is that the central bank is adopting a wait-and-see approach to monetary policy and has ended the nearly automatic quarterly rate increases of 2017 and 2018.
We think the odds favoured and should continue to favour a strong rebound in US equity prices for the following reasons:
- The US economy should continue to grow, and corporate earnings per share are expected to post a mid-to-high single-digit gain in 2019.
- Valuations for the S&P 500 Index declined from almost 19 times oneyear forward earnings per share to an attractive level of almost 14 times following the decline in share prices.
- US bond yields remain rather low and moved down again in late 2018, bolstering the case for riskier assets.
- Investor risk aversion increased sharply in late 2018, and we think much of the bad news of recent months is already reflected in stock prices—creating space for potential upside surprises on trade wars, the Fed’s policy path, Brexit, corporate profits and elsewhere.
- We do not expect fiscal policy to be the strong catalyst for growth in the US that it was in 2018, but the impact of political gridlock should still be mildly expansionary.
Although the European banking system is in better shape than it was in the immediate aftermath of the global financial crisis, it is still vulnerable at
a time when the ECB is in a holding pattern, policy-wise, and has limited flexibility in the event of a financial emergency. A lack of enthusiasm for Europe’s economic prospects is reflected in its equity-market valuations: the MSCI European Economic and Monetary Union (EMU) Index price-to earnings ratio dropped to less than 12 times from nearly 15 times at the start of the year. Note that European equities outperformed US equities in the fourth quarter of 2018.
We are leaning on the optimistic side for emerging markets in 2019. The valuation piece is already in place, in our opinion, as the MSCI Emerging
Markets Index price-to-forward-earnings ratio collapsed from 13 times at the end of January to 10.5 by year-end. But what could be the catalyst
for a turnaround? Big debt expansions in China typically lead to big gains in emerging-market equities. The question is whether the Chinese government has the will to support increased debt issuance one more time.
It surely would be a big positive for the country if the threat of tariffs was negotiated away, but we’re not holding our breath. When push comes to
shove, the Chinese government will probably get even more aggressive in easing lending constraints if the situation warrants.
Commodity prices and the earnings of emerging-market companies are closely correlated in inverse fashion with movements of the US dollar. For most of 2018, the US dollar gained against other currencies, putting downward pressure on commodity prices and the earnings of energy and materials companies that are a large part of the MSCI Emerging Markets Index. In 2017, the opposite conditions held.
We are looking for another change in the US dollar’s trend in 2019. In our view, US economic and corporate-earnings performance will move toward that of other developed countries. If there are positive developments in some of the pressure-point issues that have roiled markets, investment capital could flow away from the US and back into the world—thereby removing an important source of support for the US dollar and a big headwind from the rest of the world. This potential for a reversal in investment flows could accelerate if Fed policy becomes more dovish than
currently projected by the central bank.
The poor performance of risk assets in the fourth quarter can certainly prey on investors’ emotions. But the global economy is not exactly in dire straits. Yes, there are an unusually large number of uncertainties and concerns, some of which could have a material impact on growth if the worst comes to pass. However, even in an extraordinarily unfavourable economic scenario in which the tariff wars with China and other countries deepen
and the Fed raises the funds rate too far and too fast, we doubt that the US economy would experience anything worse than a garden-variety recession by 2021. The economic and credit excesses that usually precede a deeper recession simply aren’t to be found.
During periods of market volatility like the one we experienced at the end of 2018, investors should be mindful about the importance of sticking
with a strategic and disciplined approach to investing that is consistent with personal goals and risk tolerances. Diversification is the key to that
approach, and the construction of portfolios should be dictated by long-term capital market assumptions.
Ultimately, the value of these assumptions is not in their accuracy as point estimates, but in their ability to capture relevant relationships—as well
as changes in those relationships as a function of economic and market influences.
Glossary of Financial Terms
Dovish: Dovish refers to the views of a policy advisor (at the Bank of England, for example) who has a positive view of inflation and its economic impact, and therefore tends to favour lower interest rates.
Federal-funds rate: The federal-funds rate is the interest rate at which a depository institution lends immediately-available funds (balances at the Federal Reserve) to another depository institution overnight in the US.
Price-to-earnings ratio: The price-to-earnings ratio is the ratio of a company’s share price to its earnings over the past 12 months, which can be used to help determine whether a stock is under- or overvalued.
Yield curve: The yield curve represents differences in yields across a range of maturities of bonds of the same issuer or credit rating (likelihood of default). A steeper yield curve represents a greater difference between the yields. A flatter yield curve indicates the yields are closer together.
Index Descriptions
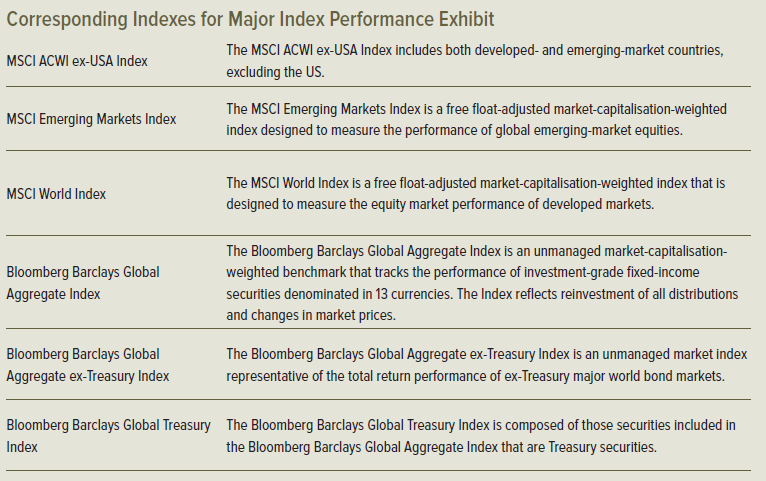
MSCI Emerging Markets Index: The MSCI Emerging Markets Index is a free float-adjusted market-capitalisation-weighted index designed to measure the performance of global emerging-market equities.
MSCI European Economic and Monetary Union (EMU) Index: The MSCI EMU Index captures large- and mid-cap representation across the developed-market countries in the EMU.
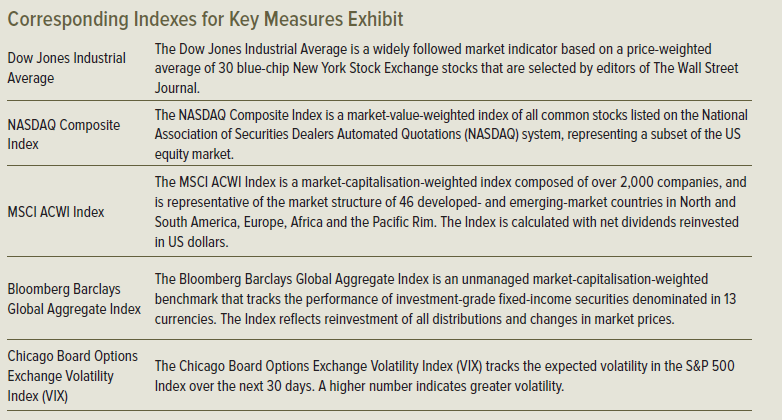
S&P 500 Index: The S&P 500 Index is an unmanaged, market-capitalisation-weighted index comprising 500 of the largest publicly traded US companies and is considered representative of the broad US stock market.
Important Information
Data refers to past performance. Past performance is not a reliable indicator of future results.
Investments in SEI Funds are generally medium- to long-term investments. The value of an investment and any income from it can go down as well as up. Investors may get back less than the original amount invested. Returns may increase or decrease as a result of currency fluctuations. Additionally, this investment may not be suitable for everyone. If you should have any doubt whether it is suitable for you, you should obtain expert advice.
No offer of any security is made hereby. Recipients of this information who intend to apply for shares in any SEI Fund are reminded that any such application may be made solely on the basis of the information contained in the Prospectus. This material represents an assessment of the market environment at a specific point in time and is not intended to be a forecast of future events, or a guarantee of future results. This information should not be relied upon by the reader as research or investment advice regarding the funds or any stock in particular, nor should it be construed as a recommendation to purchase or sell a security, including futures contracts.
In addition to the normal risks associated with equity investing, international investments may involve risk of capital loss from unfavourable fluctuation in currency values, from differences in generally accepted accounting principles or from economic or political instability in other nations. Bonds and bond funds are subject to interest rate risk and will decline in value as interest rates rise. High yield bonds involve greater risks of default or downgrade and are more volatile than investment grade securities, due to the speculative nature of their investments. Narrowly focused investments and smaller companies typically exhibit higher volatility. SEI Funds may use derivative instruments such as futures, forwards, options, swaps, contracts for differences, credit derivatives, caps, floors and currency forward contracts. These instruments may be used for hedging purposes and/or investment purposes.
While considerable care has been taken to ensure the information contained within this document is accurate and up-to-date, no warranty is given as to the accuracy or completeness of any information and no liability is accepted for any errors or omissions in such information or any action taken on the basis of this information.
This information is issued by SEI Investments (Europe) Limited, 1st Floor, Alphabeta, 14-18 Finsbury Square, London EC2A 1BR which is authorised and regulated by the Financial Conduct Authority. Please refer to our latest Full Prospectus (which includes information in relation to the use of derivatives and the risks associated with the use of derivative instruments), Key Investor Information Documents and latest Annual or Semi-Annual Reports for more information on our funds. This information can be obtained by contacting your Financial Adviser or using the contact details shown above.
SEI sources data directly from FactSet, Lipper, and BlackRock, unless otherwise stated.
The opinions and views in this commentary are of SEI only and should not be construed as investment advice.


