Monthly Market Commentary : Stocks fall on diminishing prospects for Fed rate cuts.
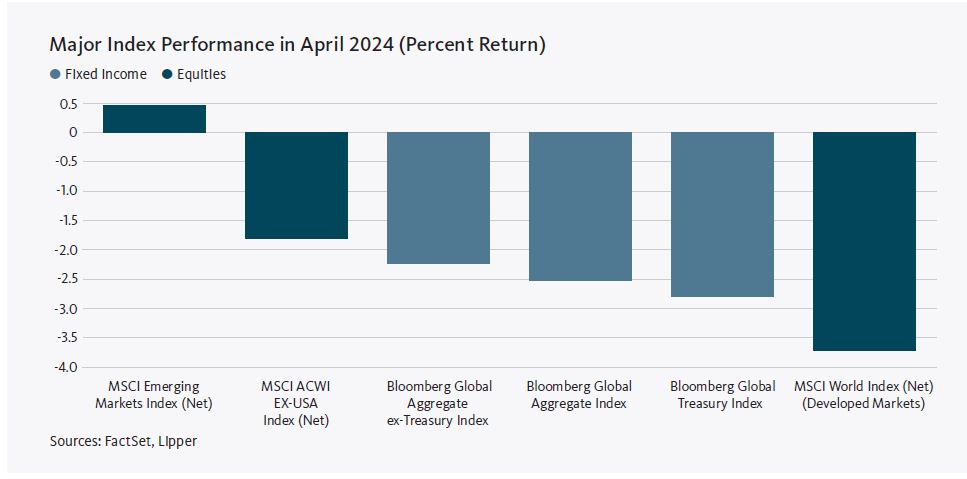
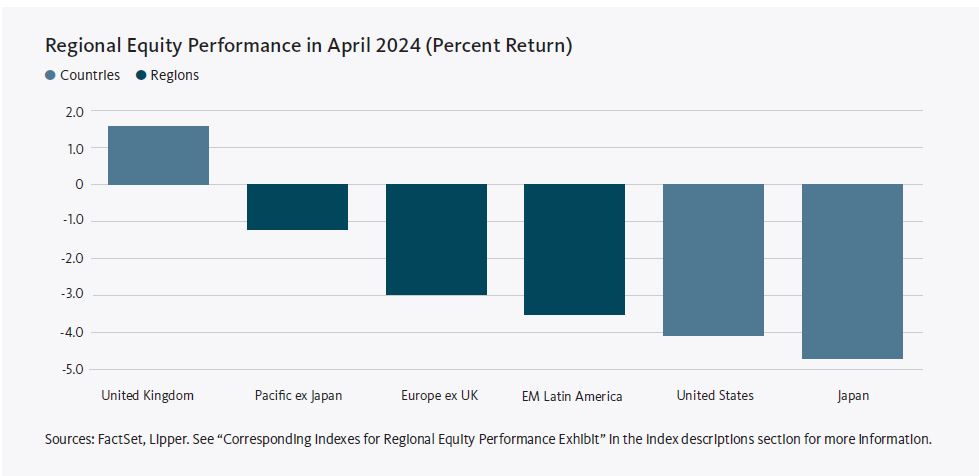
Global developed equity markets declined in April 2024, as persistent inflation in the U.S., as well as seemingly hawkish comments from Federal Reserve (Fed) Chair Jerome Powell, exacerbated investors’ concerns that the Fed and other major central banks will delay interest-rate cuts. Monetary policy hawks have a negative view of inflation and its economic impact, and thus tend to favor higher interest rates. In contrast, emerging markets posted modest gains, benefiting from relatively strong economic growth. The Pacific ex. Japan region recorded a relatively smaller loss and was the strongest performer among developed markets in April, as Hong Kong and Singapore garnered positive returns. North America was the primary developed-market laggard due mainly to a downturn in the U.S. Europe was the top performer within emerging markets for the month, led by strength in Poland and Hungary. Conversely, Latin America was the most notable underperformer due to relative weakness in Colombia and Brazil.
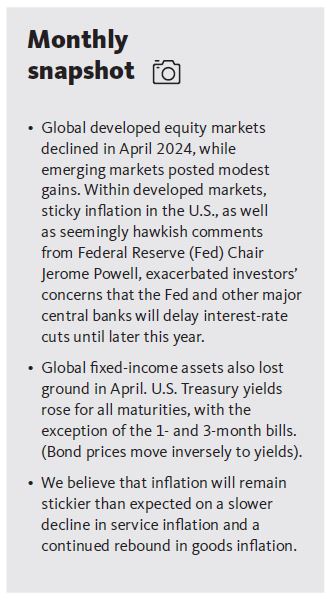
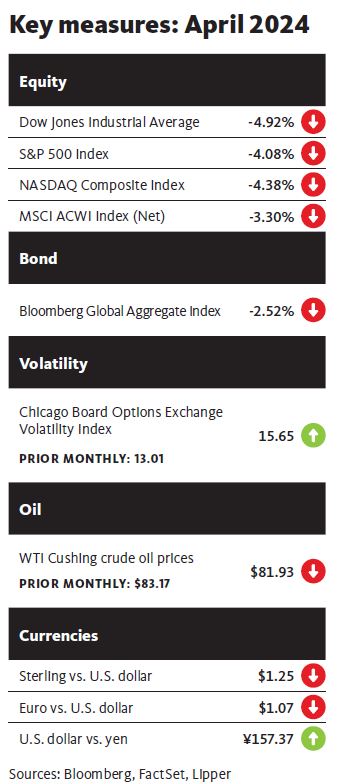
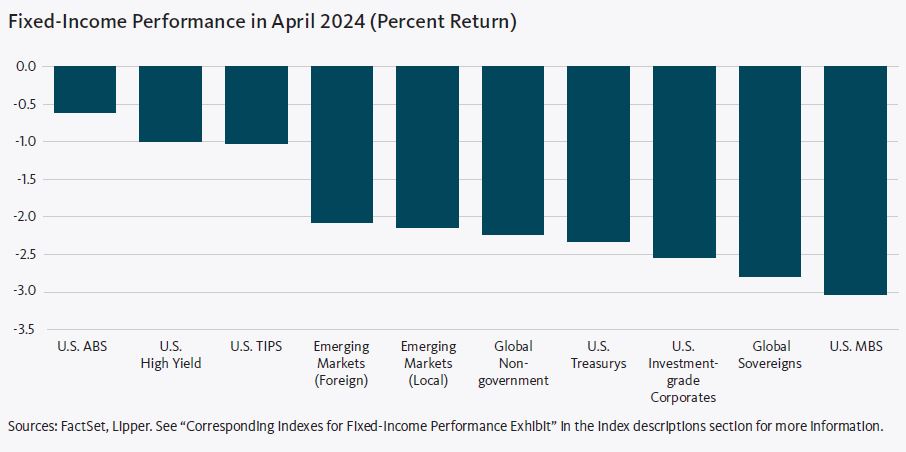
Global fixed-income assets, as measured by the Bloomberg Global Aggregate Bond Index, were down 2.5% in April. High-yield bonds recorded the smallest declines for the month and led the U.S. fixed-income market, outperforming U.S. Treasury securities, corporate bonds, and mortgage-backed securities (MBS). Treasury yields rose for all maturities during the month, with the exception of 1- and 3-month bills. Yields on 2-, 3-, 5- and 10-year Treasury notes increased 0.45%, 0.47%, 0.51%, and 0.49%, respectively, in April. The spread between 10- and 2-year notes narrowed from –0.39% to –0.35% over the month, and the yield curve remained inverted.
Global commodity prices, as measured by the Bloomberg Commodity Total Return Index, rose 2.7% in April. The West Texas Intermediate (WTI) and Brent crude oil prices dipped 1.5% and 0.8%, respectively. Early-month gains amid expectations that ongoing geopolitical tensions in the Middle East would disrupt oil exports subsequently were offset by cautious optimism regarding U.S.-led negotiations for a ceasefire in the Israel-Hamas conflict. The New York Mercantile Exchange (NYMEX) natural gas price climbed 12.9% over the month amid concerns that the tensions in the Middle East could curb shipments from Qatar. The gold spot price rose 2.9% in April as the Israel-Hamas conflict prompted investors to seek “safe-haven” investments. Wheat prices rose 7.7% for the month on speculation that weather in Russia, Europe and the U.S. could lead to supply constraints.
As widely anticipated, the Federal Open Market Committee (FOMC) left the federal-funds rate unchanged in a range of 5.25% to 5.50% following its meeting on April 30-May 1, and suggested that interest-rate cuts are not imminent. In a statement announcing the rate decision, the FOMC noted, “Inflation has eased over the past year but remains elevated. In recent months, there has been a lack of further progress toward the Committee’s 2 percent inflation objective.” Additionally, the Fed announced that, beginning in June, it will reduce the pace of the runoff in its Treasury holdings from 3$60 billion to $25 billion, while maintaining the $35 billion cap on the reduction of MBS. A rapid runoff of the Fed’s holdings can lead to higher interest rates as the market absorbs the increased supply of debt as the central bank does not purchase new securities. Slowing the runoff would decrease the debt supply in the market, easing the pressure on interest rates.
At a news conference following the FOMC meeting, Fed Chair Jerome Powell commented that, despite stubborn inflation, the central bank does not see the need for a rate hike. Powell said, “I think it’s unlikely that the next policy rate move will be a hike.” But the Fed Chair also said that the central bank is “prepared to maintain the current target range for the federal funds rate for as long as appropriate.” Furthermore, Powell quashed talk of stagflation, an environment of stagnant activity, accelerating inflation, and rising unemployment. “I don’t really understand where that’s coming from,” he stated, noting that the economy continues to grow and the annual inflation rate is under 3%. “I don’t see the ‘stag’ or the ‘flation’.”
On the geopolitical front, Iran deployed missiles and drones in an attack on Israel on April 13. The Israelis were able to repel the attack with the aid of a coalition that included the U.S., the U.K., France, Saudi Arabia, and Jordan. In the early morning (local time) of April 19, Israel retaliated with a narrowly focused drone attack on several military facilities in the city of Isfahan in central Iran. There appeared to be limited damage and no reports of fatalities in either skirmish. The Biden administration urged both countries not to escalate the hostilities.
In a related matter, after several months of contentious debate, the U.S. House of Representatives passed legislation to provide nearly $95 billion in aid to Ukraine ($60.1 billion), Israel ($26.4 billion), and Taiwan and the Indo-Pacific region ($8.2 billion). The Senate approved the aid package in a 79-18 vote on April 23, and President Joe Biden signed the legislation the following day. Republican Party leaders in the U.S. House of Representatives previously had rejected the aid packages that were approved with bipartisan support in the Senate.
Economic data
U.S.
The Department of Labor reported that the consumer-price index (CPI) rose 0.4% in March, matching the increase in February. The 3.5% year-over-year advance in the index exceeded market expectations, and was up from the 3.2% annual rise in February. Housing and gasoline prices accounted for more than half of the month-over-month increase in the CPI. Housing costs increased 0.4% and 5.7% in March and year-over-year, respectively, while gasoline prices posted corresponding increases of 1.7% and 1.3% for the month and the previous 12-month period. Food prices ticked up 0.1% in March after finishing flat in February, and rose 2.2% year-over-year, matching the annual upturn for the preceding month. The 3.8%
rolling 12-month rise in core inflation, as measured by the CPI for all items less food and energy, was unchanged from the year-over-year upturn in February, and represented the smallest annual increase since April 2021.
According to the initial estimate from the Department of Commerce, U.S. gross domestic product (GDP) grew at a lower-than-expected annualized rate of 1.6% in the first quarter of 2024—down sharply from the 3.4% rise in the fourth quarter of 2023. The largest contributors to GDP growth for the first quarter included consumer spending, residential fixed investment (purchases of private residential structures and residential equipment that property owners use for rentals), and nonresidential fixed investment (purchases of both nonresidential structures and equipment and software). The government attributed the lower GDP growth rate in the first quarter relative to the previous three-month period to slowdowns in consumer spending, exports, state and local government spending, and federal government spending.
U.K.
The Office for National Statistics (ONS) reported that inflation in the U.K., as measured by the Consumer Prices Index (CPI), rose 0.6% in March, matching the increase in February. The CPI’s 3.2% year-over-year advance was down from the 3.4% annual increase for the previous month. The largest contributors to the 12-month rise in inflation included alcohol and tobacco, as well as communication. These more than offset a decline in housing and household services costs. Core inflation, which excludes volatile food prices, rose at an annual rate of 4.2% in March, down from the 4.5% year-over-year increase in February.
According to the initial estimate of the ONS, U.K. GDP ticked up 0.1% in February (the most recent reporting period), following a 0.3% increase in January. GDP grew 0.3% over the three-month period ending February 29. Output in the production and services sectors rose 1.1% and 0.1%, respectively, in February, while construction output fell 1.9%. The ONS reported that U.K. GDP rose 0.3% for the three-month period ending in February.
Eurozone
Eurostat pegged the inflation rate for the eurozone at 2.4% for the 12-month period ending in March, modestly lower than the 2.6% annual increase in February. Costs in the services sector rose 4.0% for the period. While prices for food, alcohol and tobacco were up 2.6% year-over-year in March, the pace of acceleration slowed considerably from the 3.9% annual rate for the previous month. Energy prices fell 1.8% over the previous 12 months following a 3.7% annual decline in February. Core inflation, which excludes volatile energy and food prices, rose at an annual rate of 2.9% in March, down 0.2 percentage point from the 3.1% year-over-year increase in February.
Eurostat also reported that eurozone GDP was flat in the fourth quarter of 2023, unchanged from the third quarter of last year. Additionally, GDP was up 0.2% year-over-year. The economies of Denmark, Norway, and Croatia were the strongest performers for the fourth quarter, expanding 2.6%, 1.5%, and 1.3%, respectively. Conversely, Ireland’s GDP fell 3.4%, while the economies of Finland and Estonia contracted by corresponding margins of 0.8% and 0.7% during the quarter.
Central banks
Two weeks before the FOMC meeting, during an appearance at the Wilson Center’s Washington Forum on the Canadian Economy, Fed Chair Powell cautioned that sticky inflation data during the first quarter had led to doubts that the central bank will be able to reduce interest rates while there are no signs of a slowdown in the U.S. economy. Powell also noted that the central bank most likely will maintain the federal-funds rate at its current range of 5.25% to 5.50% as long as the annual inflation rate remains above its 2% target. “We think [monetary] policy is well positioned to handle the risks that we face. Right now, given the strength of the labor market and progress on inflation so far, it’s appropriate to allow restrictive policy further time to work.”
The Bank of England (BOE) left the Bank Rate unchanged at a 15-year high of 5.25% following its meeting on March 20. In its announcement of the rate decision, the BOE commented that inflation is falling “relatively sharply,” and acknowledged that its “restrictive stance of monetary policy is weighing on activity in the real economy, is leading to a looser labour market, and is bearing down on inflationary pressures. Nonetheless, key indicators of inflation persistence remain elevated.” The central bank also noted that wage increases are slowing. The BOE did not take any monetary policy action in April; the next MPC meeting is scheduled for May 9.
The European Central Bank (ECB) left its benchmark interest rate unchanged at 4.50% following its meeting on April 11, but left the door open for possible rate cuts in the not-to-distant future. In a statement announcing the rate decision, the ECB’s Governing Council noted that its actions going forward “will ensure that its policy rates will stay sufficiently restrictive for as long as necessary. If the Governing Council’s updated assessment of the inflation outlook, the dynamics of underlying inflation and the strength of monetary policy transmission were to further increase its confidence that inflation is converging to the target in a sustained manner, it would be appropriate to reduce the current level of monetary policy restriction.“ The ECB’s statement boosted hopes that the central bank will pivot to rate cuts at its next meeting in early June.
The Bank of Japan (BOJ) maintained its benchmark interest rate in a range of 0.0% to 0.1% after its meeting on April 25-26. In a statement announcing the rate decision, the central bank stated that future monetary policy “will depend on future developments in economic activity and prices as well as financial conditions. Uncertainties surrounding these economic and financial developments at home and abroad remain high. If the aforementioned outlook for economic activity and prices will be realized and underlying inflation will increase, the [BOJ] will adjust the degree of monetary accommodation, while it anticipates that accommodative financial conditions will be maintained for the time being.” The Japanese yen briefly fell 3% against the U.S. dollar on April 29 in response to the BOJ’s announcement and amid diminished hopes that the Fed will reduce its benchmark rate in the near term. According to The Wall Street Journal, the government of Japan intervened in an effort to strengthen the yen, though the Finance Ministry did not confirm the action.
SEI’s view
U.S. interest-rate expectations have converged thus far in 2024, as stubborn inflation data and a mixed employment picture have led investors to back away from predictions of aggressive interest-rate reductions from the Fed. We believe that inflation will remain stickier than expected on a slower decline in service inflation and a continued rebound in goods inflation. As of the end of the first quarter of this year, the market priced in roughly three rate cuts, most likely starting in June, putting market expectations only slightly ahead of our own. Nonetheless, risks to this view are, in our opinion, clearly on the side of fewer rate cuts. Following the Fed’s meeting on May 1, CME’s FedWatch Tool, which provides a gauge of the markets’ expectations of potential changes to the federal-funds target rate while assessing potential Fed monetary policy actions at FOMC meetings, implied a 94% chance that the central will maintain the benchmark rate in a range of 5.25% to 5.50% following its meeting in June. The FedWatch Tool indicated a 40% chance of a 25-basispoint (0.25%) rate cut in September.
The S&P 500 Index currently trades at a forward price-to-earnings (P/E) ratio of around 20.11 That is well above the historical average of roughly 16, which is the current P/E ratio of the rest of the world, as represented by the MSCI EAFE Index. The bar has been set fairly high for earnings to outperform expectations and drive prices higher. While we acknowledge that P/E ratios can still expand from these heights, it no longer appears that the Fed will pivot to easier monetary policy via interest-rate cuts any time soon.
Though the 10-year U.S. Treasury yield is down from the 16-year high of 5% reached in October 2023, it remains well above where it started 2024 (3.95%). We see additional room for bond yields to move higher, not only on the aforementioned sticky inflation data, but also on the substantial budget funding pressures and the lack of term premium priced into the yield curve. We would not be surprised to see the 10-year Treasury yield retest the 5% level, as the prospects for rate cuts have dimmed.
Glossary of Financial Terms
Hawkish refers to the a policy advisor–for example, a central bank–with a negative view of inflation and its economic impact, and thus tends to favor higher interest rates.
Yield is the income returned on an investment, such as the interest received from holding a security. The yield is usually expressed as an annual percentage rate based on the investment’s cost, current market value, or face value.
Yield curve represents differences in yields across a range of maturities of bonds of the same issuer or credit rating (are (which is used to assess the risk of default of companies or countries). A steeper yield curve represents a greater difference between the yields. A flatter curve indicates that short- and long-term yields are closer together.
An inverted yield curve occurs when short-term yields exceed long-term yields. While an inverted yield curve historically has predicted economic recessions, it is an indicator—not a forecast.
The federal-funds rate is the interest rate charged to lending institutions on unsecured overnight loans. It is set by the U.S. Federal Reserve’s Federal Open Market Committee. The rate is increased when the Federal Reserve wants to discourage borrowing and slow the economy and decreased when the Federal Reserve wants to spur economic growth.
Economic output comprises a quantity of goods or services produced in a specific time period.
Monetary policy refers to decisions by central banks to influence the amount of money and credit in the economy by managing the level of benchmark interest rates and the purchase or sale of securities. Central banks typically make policy decisions based on their mandates to target specific levels or ranges for inflation and employment.
Price/earnings (P/E) ratio is calculated by dividing the current market price of a stock by the earnings per share. Price/earnings multiples often are used to compare companies in the same industry, or to assess the historical performance of an individual company.
Index Descriptions
All indexes are quoted in gross performance unless otherwise indicated.
The MSCI ACWI Index is a market capitalization-weighted index that tracks the performance of over 2,000 companies, and is representative of the market structure of 48 developed and emerging-market countries in North and South America, Europe, Africa, and the Pacific Rim. The index is calculated with net dividends reinvested in U.S. dollars.
The MSCI EAFE Index is a market capitalization-weighted equity index that tracks the performance of the developed world outside North America.
The Bloomberg Global Aggregate Bond Index is a market capitalization-weighted index that tracks the performance of investment-grade (rated BBB- or higher by S&P Global Ratings/Fitch Ratings or Baa3 or higher by Moody’s Investors Service) fixed income securities denominated in 13 currencies. The index reflects reinvestment of all distributions and changes in market prices.
The Bloomberg US High Yield Index tracks the performance of fixed-rate, publicly issued, non-investment-grade (rated BB+ or lower by S&P Global Ratings and Fitch Ratings or Ba1 or lower by Moody’s Investors Service) bonds.
The Bloomberg US Treasury Index tracks the performance of fixed-rate, nominal debt issued by the US Treasury.
The Bloomberg US Corporate Investment Grade Index tracks the performance of the investment-grade, fixed-rate, taxable corporate bond market.
The Bloomberg U.S. Mortgage Backed Securities Index tracks the performance of fixed-rate agency mortgage-backed securities (MBS) guaranteed by the Government National Mortgage Association (GNMA), Federal National Mortgage Association (FNMA), and Freddie Mac (FHLMC).
The Bloomberg Commodity Total Return Index comprises futures contracts and tracks the performance of a fully collateralized investment in the index. This combines the returns of the index with the returns on cash collateral invested in 13-week (three-month) U.S. Treasury bills.
Consumer-price indexes measure changes in the price level of a weighted-average market basket of consumer goods and services purchased by households. A consumer price index is a statistical estimate constructed using the prices of a sample of representative items whose prices are collected periodically.
Disclosures
This material represents an assessment of the market environment at a specific point in time and is not intended to be a forecast of future events, or a guarantee of future results. This information should not be relied upon by the reader as research or investment advice regarding SEI’s portfolios or any stock in particular, nor should it be construed as a recommendation to purchase or sell a security, including futures contracts.
There are risks involved with investing, including loss of principal. International investments may involve risk of capital loss from unfavorable fluctuation in currency values, from differences in generally accepted accounting principles or from economic or political instability in other nations. Emerging markets involve heightened risks related to the same factors as well as increased volatility and lower trading volume. Narrowly focused investments and smaller companies typically exhibit higher volatility. Bonds and bond funds will decrease in value as interest rates rise. High-yield bonds involve greater risks of default or downgrade and are more volatile than investment-grade securities, due to the speculative nature of their investments.
Diversification may not protect against market risk. Past performance does not guarantee future results. Index returns are for illustrative purposes only and do not represent actual portfolio performance. Index returns do not reflect any management fees, transaction costs or expenses. One cannot invest directly in an index.
Information provided by SEI Investments Management Corporation, a wholly owned subsidiary of SEI Investments Company (SEI).


