Monthly Market Commentary: Staring at the ceiling.
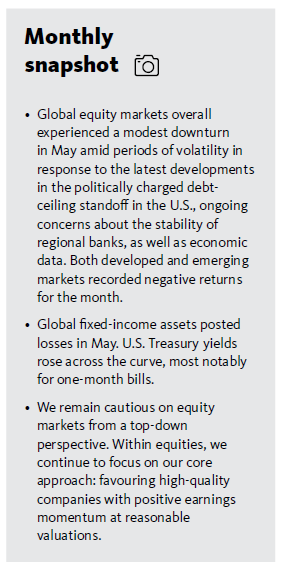
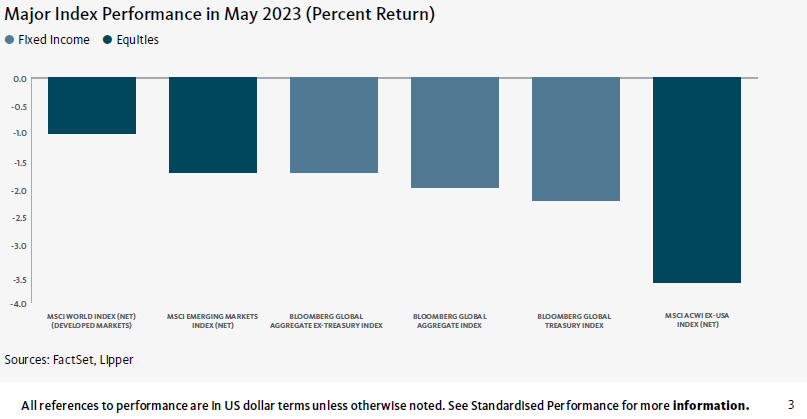
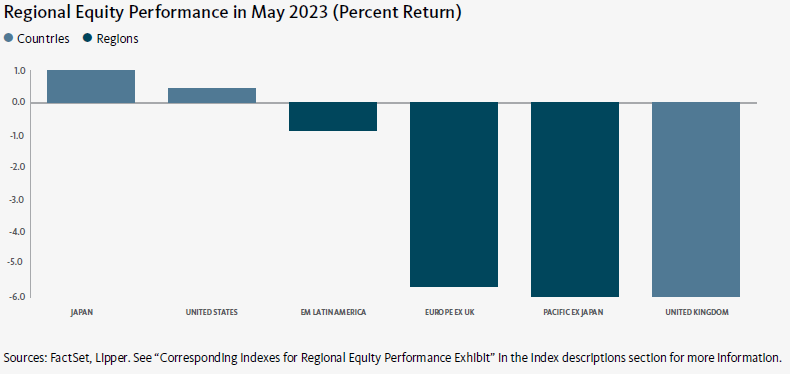
Global equity markets overall experienced a modest downturn in May amid periods of volatility in response to the latest developments in the politically charged debt-ceiling standoff in the U.S., ongoing concerns about the stability of U.S. regional banks, as well as economic data. Developed markets slightly outperformed emerging markets. The Far East garnered a moderately positive return and was the top-performing region among developed markets in May attributable primarily to strength in Japan. Europe was the primary market laggard due to weakness in Belgium and Portugal. Despite posting a negative return, Latin America was the top performer within the emerging markets in May, buoyed by the relatively strong performance of Brazil. Conversely, the Europe, Middle East and Africa (EMEA) region saw a significant downturn and was the weakest performer among emerging markets as stock prices in South Africa fell sharply over the month.1
President Joe Biden and Kevin McCarthy, Speaker of the U.S. House of Representatives, reached an agreement on raising the $31.4 trillion debt ceiling during the last week of May. The debt ceiling is the total amount of money that the U.S. government is authorized to borrow to meet its existing legal obligations, including Social Security and Medicare benefits, military salaries, interest on the national debt, tax refunds, and other payments. Failing to increase the debt limit would cause the government to default on its legal obligations. Both the U.S. House of Representatives and the Senate passed the debt-ceiling legislation by wide margins, with strong support from Republicans and Democrats. The bill suspends the debt ceiling through 1 January 2025, maintains non-military spending close to current levels for the 2024 fiscal year, which begins in October, and implements a 1% cap on increases in non-military spending for the 2025 fiscal year. The fast-track approval of the legislation, which Biden subsequently signed into law, enabled the government to avoid a potential default on its debt on 5 June, the “X-date” on which Treasury Secretary Janet Yellen had warned that the U.S. would no longer be able to meet its financial obligations. During a nationally televised address following the vote in the Senate, Biden said, “No one gets everything they want in a negotiation, but make no mistake: This bipartisan agreement is a big win for our economy and the American people.”
Shortly before the initial announcement of the debt-ceiling agreement, creditrating agency Fitch placed the United States’ AAA-rated debt on “Rating Watch Negative,” citing “increased political partisanship that is hindering reaching a resolution to raise or suspend the debt limit.” Similarly, another credit-rating agency, DBRS Morningstar, expressed concerns that “political polarization in the context of a divided congress poses some risk to the U.S. government’s willingness to ensure all debts are paid on time and in full.”
U.S. regional bank stocks encountered significant volatility again in May, and ended the month with notable losses. Early in the month, U.S. regulators took control of California-based First Republic Bank. The California Department of Financial Protection and Innovation–which oversees the operations of state-licensed financial institutions, including banks and credit unions–issued a statement announcing that it had taken over the bank and appointed the Federal Deposit Insurance Corporation (FDIC) as receiver. The FDIC subsequently accepted J.P. Morgan Chase Bank’s bid “to assume all deposits, including all uninsured deposits, and substantially all assets of First Republic Bank.” The KBW Regional Banking Index, which tracks the performance of publicly traded U.S. regional banks and thrifts, fell 9.2% in May, and was down nearly 29% for the year to date.
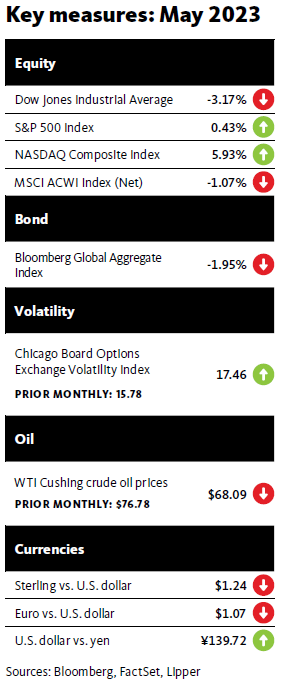
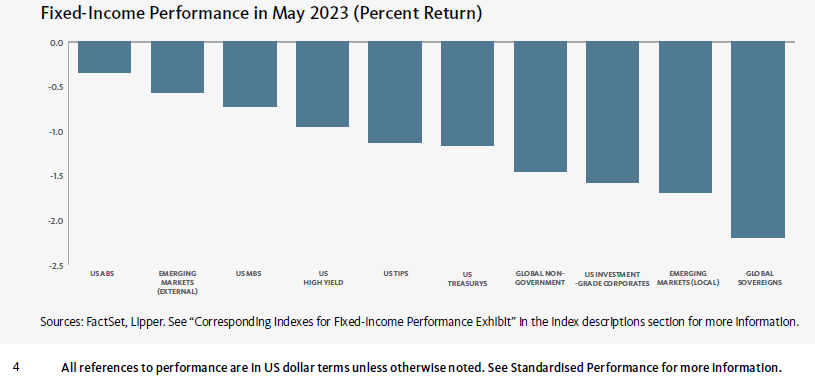
Global fixed-income assets lost ground in May. In the U.S. market, high-yield bonds recorded the smallest losses and were the top performers for the month, followed by mortgage-backed securities (MBS).2 U.S. Treasurys and corporate bonds were the weakest performers..3 U.S. Treasury yields moved sharply higher across the curve in May. Yields on 1-month U.S. Treasury bills (T-bills) with maturities close to the U.S. government’s “X-date” of 5 June for the default on its financial obligations climbed 167 basis points (1.67%) to 6.02%–the highest level since the introduction of the 1-month T-bill in July 20014–before tumbling to 5.28% over the last two days of the month following the announcement of a potential agreement on raising the debt ceiling. Investors demanded higher yields as compensation for the additional risk that the U.S. government could default on its debt in early June. The yields on 2-, 3-, 5-, and 10-year Treasury notes climbed 0.36%, 0.29%, 0.23%, and 0.20%, respectively, in May. The spread between 10- and 2-year notes widened from -0.60% to -0.76% during the month, further inverting the yield curve.
Global commodity prices moved lower during the month. The West Texas Intermediate (WTI) crude-oil spot price and the Brent crude oil price fell 11.3% and 9.6%, respectively, in U.S. dollar terms, hampered by the strong performance of the greenback in May, as well as investors’ fears of waning demand for oil. The 12.1% decline in the New York Mercantile Exchange (NYMEX) natural gas price in May was attributable to concerns about lower demand, as well as an increase in supply. Wheat prices fell 6.3% in May after Ukraine and Russia renewed an agreement that allows the shipment of Ukrainian grain through the Black Sea.5 The gold spot price dipped 0.9% during the month as progress in the debt-ceiling negotiations in the U.S.
reduced the demand for the precious metal as a “safe-haven” asset.6
Geopolitical tensions rose in the Asia-Pacific region in late May. North Korea notified the International Maritime Organization, the United Nations’ specialised agency with responsibility for the security of shipping and the prevention of marine and atmospheric pollution by ships, of its intention to launch its first military reconnaissance satellite between 31 May and 11 June. Japan’s Ministry of Defense subsequently announced that it had placed its ballistic missile defenses on alert and vowed to shoot down any North Korean missile or debris if it entered Japan’s territory. A reconnaissance satellite would enhance North Korea’s capability to carry out a preemptive military strike and monitor potential incoming threats from the U.S. and South Korea. Japan, the U.S. and South Korea issued a joint statement warning that, if North Korea proceeds with the satellite launch, “there will be a stern, unified response from the international community.”7
Regarding the ongoing Russia-Ukraine conflict, the Wagner Group, a Russian paramilitary organization, began to retreat from the city of Bakhmut, Ukraine, in late May. The mercenaries were scheduled to complete their retreat by the beginning of June, and would be replaced by regular Russian troops. The Wagner Group had been fighting in Bakhmut since the summer of 2022. The withdrawal from the city occurred after the group’s leader, Yevgeny Prigozhin, claimed that Russian Defense Minister Sergei Shoigu and Valery Gerasimov, Chief of the General Staff, had intentionally withheld ammunition from Wagner Group fighters.8
Economic data
U.S.
- According to the U.S. Department of Commerce, the personal-consumptionexpenditures (PCE) price index rose 0.4% in April and 4.4% over the previous 12-month period, fueling speculation over the possibility of further Fed rate hikes to combat inflation. Food prices dipped less than 0.1% during the month and were up 6.9% year-over-year. Energy prices increased 0.7% in April but fell 6.3% over the previous 12 months. The PCE price index is the Fed’s preferred gauge of inflation, as it tracks the change in prices paid by or on behalf of consumers for a more comprehensive set of goods and services than that of the consumer-price index (CPI).
- The Department of Labor also reported that U.S. payrolls expanded by 253,000 in April, up from 236,000 in March. The unemployment rate dipped 0.2% to 3.4%. The professional and business services, health care, and leisure and hospitality sectors saw the largest employment gains in April. Despite the greater-than-expected growth in payrolls during the month, the total lagged the 400,000 monthly average job gains for the 2022 calendar year. Average hourly earnings rose 0.5% In April and 4.4% year-over-year. The 12-month increase was modestly higher than the 4.2% annual rise in March.
- Higher mortgage rates continue to weigh on the U.S. housing market. The National Association of Realtors (NAR) reported that sales of existing homes fell 3.4% in April and plummeted 23.2% versus the same period in 2022. The median existing-home price was down 1.7% year-over-year to $388,000—the biggest 12-month decline since January 2012. The inventory of unsold existing homes increased 7.2% from the previous month to 1.04 million at the end of April, equivalent to 2.9 months’ supply at the current monthly sales pace. According to the NAR, a six-month supply of homes historically has indicated a “balanced market,” in which prices rise modestly. Inventories of greater than six months typically favour buyers; inventories of less than six months typically favour sellers.
- According to the second estimate of the Department of Commerce, U.S. gross domestic product (GDP) grew at an annualised rate of 1.3% in the first quarter of 2023, up modestly from the initial estimate of 1.1%, but down from the 2.6% rise in the fourth quarter of 2022. The largest increases for the first quarter of this year were in consumer spending, exports, and federal government spending. These gains offset reductions in private inventory investment (a measure of the changes in values of inventories from one time period to the next) and residential fixed investment (purchases of private residential structures and residential equipment that property owners use for rentals). The government attributed the slower GDP growth rate relative to the fourth quarter of 2022 to a downturn in private inventory investment and a decline in nonresidential fixed investment (purchases of both nonresidential structures and equipment and software).
U.K.
- According to the Office for National Statistics (ONS), consumer prices in the U.K. rose 1.2% month-over-month in April, up from the 0.8% increase in March. The inflation rate rose 7.8% over the previous 12-month period, but was significantly lower than the 8.9% year-over-year rise in March. Food and non-alcoholic beverages, as well as housing and household services (particularly electricity) were the most notable contributors to the annual increase in prices. Core inflation, which excludes volatile food and energy prices, rose at an annual rate of 6.2% in April, unchanged from the increase in March.
- The ONS also reported that U.K. GDP ticked up 0.1% in the first quarter of 2023, with a 0.5% expansion in January, flat growth in February, and a 0.3% decline in March. The services and production sectors recorded marginal growth rates for the quarter, while household consumption was flat.
- The S&P Global/CIPS Flash UK Manufacturing Output Index declined 1.9 to a four-month low of 47.4 in May due to a decrease in orders, along with customer destocking (a planned reduction in stock or inventory). A reading below 50 indicates contraction in the manufacturing sector.
- The S&P Global/CIPS Flash UK Services PMI Business Activity Index dipped 0.8 to 55.1 in May, but indicated expansion for the third consecutive month. The slowdown in the rate of growth relative to the previous month resulted mainly from budget pressures among corporate clients, rising economic uncertainty, and higher borrowing costs.
Eurozone
- Inflation in the eurozone ticked up 0.1% to 7.0% for the 12-month period ending in April. Prices for food, alcohol and tobacco, as well as non-energy industrial goods, led the upturn in the year-over-year inflation rate.9
- Eurozone manufacturing decreased in April, with the HCOB Flash Eurozone Manufacturing Output Index falling 2.2 to a six-month low of 46.3.
- Services activity in the eurozone expanded in April, but the HCOB Flash Eurozone Services PMI Activity Index dipped 0.3 to 55.9.
- According to Eurostat’s second estimate, eurozone GDP increased 0.1% in the first quarter of 2023, unchanged from the initial estimate. The eurozone saw flat economic growth in the fourth quarter of 2022. GDP increased 1.3% over the previous 12 months. Poland’s economy was the strongest performer, expanding 3.9% in the first quarter, while Lithuania’s GDP decreased 3.0% during the period.
Central banks
- The U.S. Federal Reserve (Fed) raised the federal-funds rate by 25 basis points (0.25%) to a range of 5.00%-5.25% at its meeting in early May—the central bank’s tenth increase since it began its rate-hiking cycle to combat inflation in March 2022. In a statement announcing the rate hike, the Federal Open Market Committee (FOMC) commented that “[we] will closely monitor incoming information and assess the implications for monetary policy. In determining the extent to which additional policy firming may be appropriate to return inflation to 2 percent over time, the Committee will take into account the cumulative tightening of monetary policy, the lags with which monetary policy affects economic activity and inflation, and economic and financial developments.” Regarding concerns about the stability of the banking sector, the Fed stated: “The extent of these effects remains uncertain.”
- The minutes from the FOMC’s meeting revealed that, “Participants generally expressed uncertainty about how much more policy tightening may be appropriate.” While some investors believe that the Federal Reserve (Fed) is preparing to pause its rate-hiking cycle, the FOMC’s meeting minutes stress that, “Many participants focused on the need to retain optionality,” leaving the door open for further rate hikes. The next FOMC meeting is scheduled for 13-14 June.
- In a split 7-2 vote, the Bank of England (BOE) raised its benchmark rate by 0.25% to 4.50% on 11 May. The BOE’s Monetary Policy Committee (MPC) expects U.K. GDP to be virtually flat over the first half of 2023; however, it anticipates that there will be a modest increase in underlying economic output. Additionally, the MPC projects that the UK’s inflation rate, as measured by the consumer-price index, will drop below 2% within the next two to three years.
- The European Central Bank (ECB) increased its benchmark interest rate by 0.25% to 3.75% following its meeting on May 10. In a statement announcing the rate hike, the central bank noted, “The inflation outlook continues to be too high for too long…Headline inflation has declined over recent months, but underlying price pressures remain strong.”
- The Bank of Japan’s (BOJ) next monetary policy meeting is scheduled for June 15-16. The central bank left its benchmark interest rate unchanged at -0.1% on 28 April following the first monetary policy meeting under new BOJ Governor Kazuo Ueda. In its Outlook for Economic Activity and Prices for April, which was released in early May, the BOJ commented, “Japan’s economy is likely to recover moderately toward around the middle of fiscal 2023, supported by factors such as the materialization of pent-up demand, although it is expected to be under downward pressure stemming from past high commodity prices and a slowdown in the pace of recovery in overseas economies.”
SEI’s view
Political brinksmanship is back in full force, thanks to the U.S. debt ceiling. If U.S. political dysfunction seemed high in the 2011 and 2013 debt-ceiling episodes, it’s even worse today. Prior to the agreement between Biden and McCarthy and the subsequent vote in the U.S. Congress to suspend the debt ceiling until the beginning of 2025, yields on U.S. Treasury securities maturing this summer varied quite a bit by maturity, reflecting fluctuating degrees of confidence in whether holders will be made whole on schedule. There was near-universal acknowledgement that a default would have constituted a catastrophic policy error.
The tumult in the banking system isn’t over yet. Although it appears that the crisis stage has eased, smaller banks are facing ongoing pressure to raise deposit rates to more competitive levels, while borrowing from the Fed and U.S. government agencies to improve their liquidity. Smaller banks are struggling financially after the Fed’s rate hikes over the past 15 months have significantly reduced the value of their bond holdings, resulting in estimated unrealised losses totalling $1.8 trillion. SEI views the situation as a crisis of confidence, not the credit crunch that occurred during the Global Financial Crisis of 2007-2008. Between the asset/liability mismatch and the downstream effects from 5.25% of Fed rate hikes in an incredibly short period of time, we think that the market will continue to judge and punish the “weak hands.”
Regarding Fed monetary policy, some interpreted the language in the FOMC’s statement following its 0.25% rate hike in early May as an indication that the central bank was giving itself the flexibility to pause its rate-hiking cycle at its June meeting. We’re in the “pause” camp. We don’t see a cut in 2023 unless we see a sudden extreme acceleration in the softening of prices and a dramatic deterioration in employment trends.
Labour input costs are one of the most prominent drivers of inflation and, with worker participation levels softening over time (particularly for the working-age male cohort) and the swift aging of populations in many major developed and emerging economies, we may see continued upward pressure on wages that help keep inflation higher for longer. The most recent reported unemployment rates are at or below long-term equilibrium levels for many countries. This implies that labour markets globally are extremely tight and wage growth is likely to remain higher-than-desired, putting continued upward pressure on inflation.
SEI has consistently predicted that inflation would be higher for longer since the spring of 2021. Our out-of-consensus call was based in part on the tight labourmarket conditions that prevailed in the U.S., Canada, the U.K., and Europe.
“Labour pains” may persist until an economic recession fully takes root. Nonetheless, even the bitter pill of a recession won’t alleviate all pressure from the labour market, as population aging can’t be reversed by economic distress. While we believe that a recession is likely, we expect it will be relatively shallow and brief. Unfortunately, at least some labour pains may outlive a recession.
We remain cautious on equity markets from a top-down perspective. Within the equity asset class, we continue to focus on our core approach: favouring highquality companies with positive earnings momentum at reasonable valuations.
Looking forward, we see opportunities and risks in both the resilient (equities, credit) and the divergent (value, rates) segments of the global financial markets. Specifically, we are fading the resilient and leaning into the divergent.
Glossary of Financial Terms
The debt ceiling is the total amount of money that the U.S. government is authorized to borrow to meet its existing legal obligations, including Social Security and Medicare benefits, military salaries, interest on the national debt, tax refunds, and other payments. Failing to increase the debt limit would cause the government to default on its legal obligations.
Credit ratings are an assessment of the risk of default of companies or countries. The higher the credit quality (or rating), the lower the perceived risk of default. The ratings for S&P Global Ratings and Fitch Ratings range from AAA (highest) to D (the lowest). Moody’s Investors Service assigns credit ratings from Aaa to C. Ratings below BBB/Baa are classified as noninvestment-grade, or “junk,” and are considered to be riskier.
Yield is the income returned on an investment, such as the interest received from holding a security. The yield is usually expressed as an annual percentage rate based on the investment’s cost, current market value, or face value.\
Mortgage-backed securities (MBS) are pools of mortgage loans packaged together and sold to the public. They are usually structured in tranches (a slice or portion of a structured security) that vary by risk and expected return.
U.S. Treasury bills are short-term debt obligations backed by the U.S. Treasury Department with a maturity of one year or less.
Yield curve represents differences in yields across a range of maturities of bonds of the same issuer or credit rating (are (which is used to assess the risk of default of companies or countries). A steeper yield curve represents a greater difference between the yields. A flatter curve indicates the short- and long-term yields are closer together.
An inverted yield curve occurs when short-term yields exceed long-term yields. While an inverted yield curve historically has predicted economic recessions, it is an indicator—not a forecast.
The federal-funds rate is the interest rate charged to lending institutions on unsecured overnight loans. It is set by the U.S. Federal Reserve’s Federal Open Market Committee. The rate is increased when the Federal Reserve wants to discourage borrowing and slow the economy and decreased when the Federal Reserve wants to spur economic growth.
Economic output comprises a quantity of goods or services produced in a specific time period.
Monetary policy refers to decisions by central banks to influence the amount of money and credit in the economy by managing the level of benchmark interest rates and the purchase or sale of securities. Central banks typically make policy decisions based on their mandates to target specific levels or ranges for inflation and employment.
A recession is a significant and prolonged downturn in economic activity.
Index Descriptions
The MSCI All Country World Index (ACWI) is a market capitalization-weighted index that tracks the performance of over 2,000 companies, and is representative of the market structure of 48 developed and emerging-market countries in North and South America, Europe, Africa, and the Pacific Rim. The index is calculated with net dividends reinvested in U.S. dollars.
The ICE BofA U.S. High Yield Constrained Index is a market capitalization-weighted index which tracks the performance of U.S. dollar-denominated below-investment-grade (rated BB+ or lower by S&P Global Ratings and Fitch Ratings or Ba1 or lower by Moody’s Investors Service) corporate debt publicly issued in the U.S. domestic market.
The ICE BofA U.S. Corporate Index includes publicly issued, fixed-rate, nonconvertible investment-grade (rated BBB- or higher by S&P Global Ratings and Fitch Ratings or Baa3 or higher by Moody’s Investors Service) dollar-denominated, U.S. Securities and Exchange (SEC)-registered corporate debt having at least one year to maturity.
The ICE BofA U.S. Treasury Index tracks the performance of fixed-rate, nominal debt issued by the U.S. Treasury.
The S&P U.S. Mortgage-Backed Securities Index tracks the performance of U.S. dollar-denominated, fixed-rate and adjustable-rate/hybrid mortgage pass-through securities issued by Ginnie Mae (GNMA), Fannie Mae (FNMA) and Freddie Mac (FHLMC).
The KBW Regional Banking Index tracks the performance of U.S. regional banks and thrifts that are publicly traded in the U.S.
Consumer-price indexes measure changes in the price level of a weighted-average market basket of consumer goods and services purchased by households. A consumer price index is a statistical estimate constructed using the prices of a sample of representative items whose prices are collected periodically.
A purchasing managers’ index (PMI) tracks the prevailing direction of economic trends in the manufacturing and service sectors.
The S&P Global/CIPS Flash UK Manufacturing Output Index measures the activity level of purchasing managers in the manufacturing sector of the U.K. A reading above 50 indicates expansion in the sector; below 50 indicates contraction.
The S&P Global/CIPS Flash UK Services PMI Business Activity Index measures the activity level of purchasing managers in the services sector. A reading above 50 indicates expansion in the sector; a reading below 50 indicates contraction.
The HCOB Flash Eurozone Manufacturing Output Index measures the activity level of purchasing managers in the manufacturing sector of the eurozone. A reading above 50 indicates expansion in the sector; below 50 indicates contraction.
The HCOB Eurozone Services PMI Activity Index measures the activity level of purchasing managers in the services sector of the eurozone. A reading above 50 indicates expansion in the sector; below 50 indicates contraction.
Important Information
The information contained herein is for general and educational information purposes only and is not intended to constitute legal, tax, accounting, securities, research or investment advice regarding the Strategies or any security in particular, nor an opinion regarding the appropriateness of any investment. This information should not be construed as a recommendation to purchase or sell a security, derivative or futures contract. You should not act or rely on the information contained herein without obtaining specific legal, tax, accounting and investment advice from an investment professional. This material represents an assessment of the market environment at a specific point in time and is not intended to be a forecast of future events, or a guarantee of future results. There is no assurance as of the date of this material that the securities mentioned remain in or out of the SEI Strategies. Positioning and holdings are subject to change. All information as of 31 May 2023.
Information contained herein that is based on external sources or other sources is believed to be reliable, but is not guaranteed by SEI, and the information may be incomplete or may change without notice. This document may not be reproduced, distributed to another party or used for any other purpose.
There are risks involved with investing, including loss of principal. Diversification may not protect against market risk. There may be other holdings which are not discussed that may have additional specific risks. Narrowly focused investments and smaller companies typically exhibit higher volatility. International investments may involve risk of capital loss from unfavourable fluctuation in currency values, from differences in generally accepted accounting principles or from economic or political instability in other nations. Emerging markets involve heightened risks related to the same factors, in addition to those associated with their relatively small size and lesser liquidity. Bonds will decrease in value as interest rates rise. High yield bonds involve greater risks of default or downgrade and are more volatile than investment grade securities, due to the speculative nature of their investments. SEI products may use derivative instruments such as futures, forwards, options, swaps, contracts for differences, credit derivatives, caps, floors and currency forward contracts. These instruments may be used for hedging purposes and/or investment purposes.
While considerable care has been taken to ensure the information contained within this document is accurate and up-to-date, no warranty is given as to the accuracy or completeness of any information and no liability is accepted for any errors or omissions in such information or any action taken on the basis of this information.
The value of an investment and any income from it can go down as well as up. Investors may get back less than the original amount invested. Returns may increase or decrease as a result of currency fluctuations. Past performance is not a reliable indicator of future results. Investment may not be suitable for everyone. If you should have any doubt whether it is suitable for you, you should obtain expert advice.
Index returns are for illustrative purposes only, and do not represent actual account performance. Index returns do not reflect any management fees, transaction costs or expenses. Indexes are unmanaged and one cannot invest directly in an index.
Not all strategies discussed may be available for your investment.
This material is not directed to any persons where (by reason of that person’s nationality, residence or otherwise) the publication or availability of this material is prohibited. Persons in respect of whom such prohibitions apply must not rely on this information in any respect whatsoever.
The views and opinions within this document are of SEI only and are subject to change. They should not be construed as investment advice.
The views contained herein are not to be taken as advice or a recommendation to buy or sell any investment in any jurisdiction. Our outlook contains forward-looking statements that are judgments based upon our current assumptions, beliefs and expectations. If any of the factors underlying our current assumptions, beliefs or expectations change, our statements as to potential future events or outcomes may be incorrect. We undertake no obligation to update our forward-looking statements.
The SEI Global Assets Fund Plc, SEI Global Investments Fund Plc, and SEI Global Master Fund Plc (the “SEI UCITS Funds”) are structured as open-ended collective investment schemes and are authorised in Ireland by the Central Bank as a UCITS pursuant to the UCITS Regulations. The SEI UCITS Funds are managed by SEI Investments, Global Ltd (“SIGL”). SIGL has appointed SEI Investments (Europe) Ltd (“SIEL”) to provide general distribution services in relation to the SEI UCITS Funds either directly or through the appointment of other sub-distributors. The SEI UCITS Funds may not be marketed to the general public except in jurisdictions where the funds have been registered by the relevant regulator. The matrix of the
SEI UCITS fund registrations can be found here seic.com/GlobalFundRegistrations.
No offer of any security is made hereby. Recipients of this information who intend to apply for shares in any SEI UCITS Fund are reminded that any such application may be made solely on the basis of the information contained in the Prospectus. Please refer to our latest Prospectus (which includes information in relation to the use of derivatives and the risks associated with the use of derivative instruments), Key Investor Information Document, Summary of UCITS Shareholder rights (which includes a summary of the rights that shareholders of our funds have) and the latest Annual or Semi-Annual Reports for more information on our funds, which can be located at Fund Documents. SIEL has appointed SEI Investments (Asia) Limited (SEIAL) of Suite 904, The Hong Kong Club Building, 3 Jackson Road, Central, Hong Kong as the sub-distributor of the SEI UCITS funds.
Singapore
The offer or invitation to subscribe for or purchase shares of the Sub-Funds (the “Shares), which is the subject of this Information Memorandum, is an exempt offer made only: (i) to “institutional investors” pursuant to Section 304 of the Securities and Futures Act, Chapter 289 of Singapore (the “Act”), (ii) to “relevant persons” pursuant to Section 305(1) of the Act, (iii) to persons who meet the requirements of an offer made pursuant to Section 305(2) of the Act, or (iv) pursuant to, and in accordance with the conditions of, other applicable exemption provisions of the Act.
No exempt offer of the Shares for subscription or purchase (or invitation to subscribe for or purchase the Shares) may be made, and no document or other material (including this Information Memorandum) relating to the exempt offer of Shares may be circulated or distributed, whether directly or indirectly, to any person in Singapore except in accordance with the restrictions and conditions under the Act. By subscribing for Shares pursuant to the exempt offer under this Information Memorandum, you are required to comply with restrictions and conditions under the Act in relation to your offer, holding and subsequent transfer of Shares.
This information is being made available in Hong Kong by SEIAL. The contents of this document have not been reviewed by any regulatory authority in Hong Kong. You are advised to exercise caution in relation to the offer. If you are in any doubt about any of the contents of this document, you should obtain independent professional advice.
The SEI UCITS Funds have not been authorised by the SFC in Hong Kong and will be an unregulated collective investment scheme for the purpose of the Securities and Futures Ordinance of Hong Kong (the “SFO”). Shares of the SEI UCITS Funds may not be offered or sold by means of any document in Hong Kong other than (a) to professional investors as defined in the SFO and its subsidiary legislation or (b) in other circumstances which do not result in the document being a “prospectus” as defined in the Companies Ordinance (“CO”) or which do not constitute an offer to the public within the meaning of the CO. This document does not constitute an offer or invitation to the public in Hong Kong to acquire shares in the SEI UCITS Funds. These materials have not been delivered for registration to the Registrar of Companies in Hong Kong.
It is the responsibility of every recipient to understand and observe applicable regulations and requirements in their jurisdiction. This information is only directed at persons residing in jurisdictions where the SEI UCITS Funds are authorised for distribution or where no such authorisation is required.
The Shares may not be offered, sold or delivered directly or indirectly in the US or to or for the account or benefit of any US Person except pursuant to an exemption from, or in a transaction not subject to, the registration requirements of the Securities Act of 1933 and any applicable state laws.
This information is made available in Latin America FOR PROFESSIONAL (non-retail) USE ONLY by SIEL.
Any questions you may have in relation to its contents should solely be directed to your Distributor. If you do not know who your Distributor is, then you cannot rely on any part of this document in any respect whatsoever.
SEI has not considered the suitability or appropriateness of any of the SEI UCITS Funds against your individual needs and risk tolerance. SEI shall not be liable for, and accepts no liability for, the use or misuse of this document by the Distributor. For all Distributors of the SEI UCITS Funds please refer to your sub-distribution agreement with SIEL before forwarding this information to your clients. It is the responsibility of every recipient to understand and observe applicable regulations and requirements in their jurisdiction. The Distributor is, amongst other things, responsible for ensuring that the Shares are only offered, and any literature relating to the SEI UCITS Funds (including this document) are only distributed, in jurisdictions where such offer and/or distribution would be lawful.
Issued in South Africa by SEI Investments (South Africa) (Pty) Ltd. FSP No. 13186 which is a financial services provider authorised and regulated by the Financial Sector Conduct Authority (FSCA). Registered office: 3 Melrose Boulevard, 1st Floor, Melrose Arch 2196, Johannesburg, South Africa.
A number of sub-funds of the SEI Global Master Fund plc and the SEI Global Investment Fund plc (the “SEI UCITS Funds”) have been approved for distribution in South Africa under s.65 of the Collective Investment Schemes Control Act 2002 as foreign collective investment schemes in securities. If you are unsure at any time as to whether or not a portfolio of SEI is approved by the Financial Sector Conduct Authority (“FSCA”) for distribution in South Africa, please consult the FSCA’s website (www.fsca.co.za).
Collective Investment Schemes (CIS) are generally medium to long term investments and investors may not get back the amount invested. The value of participatory interests or the investment may go down as well as up. SEI does not provide any guarantee either with respect to the capital or the return of an SEI UCITS Fund. The SEI UCITS Funds are traded at ruling prices and can engage in borrowing and scrip lending. A schedule of fees and charges and maximum commissions is available upon request from SEI. The SEI UCITS Funds invest in foreign securities. Please note that such investments may be accompanied by additional risks such as: potential constraints on liquidity and the repatriation of funds; macroeconomic, political/emerging markets, foreign currency risks, tax and settlement risks; and limits on the availability of market information.
This commentary is intended for information purposes only and the information in it does not constitute financial advice as contemplated in terms of the Financial Advisory and Intermediary Services Act.
Please refer to our latest Prospectus (which includes information in relation to the use of derivatives and the risks associated with the use of derivative instruments), Key Investor Information Document and the latest Annual or Semi-Annual Reports for more information on our funds, which can be located at Fund Documents.


