Monthly Market Commentary: Markets resurface after taking a dive
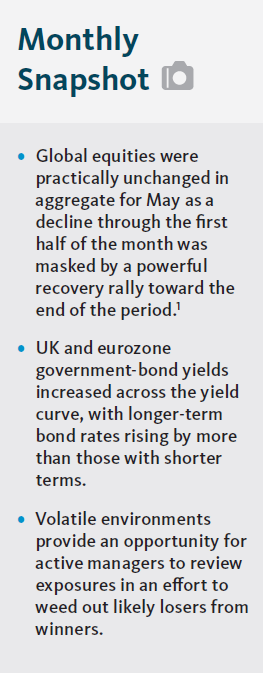
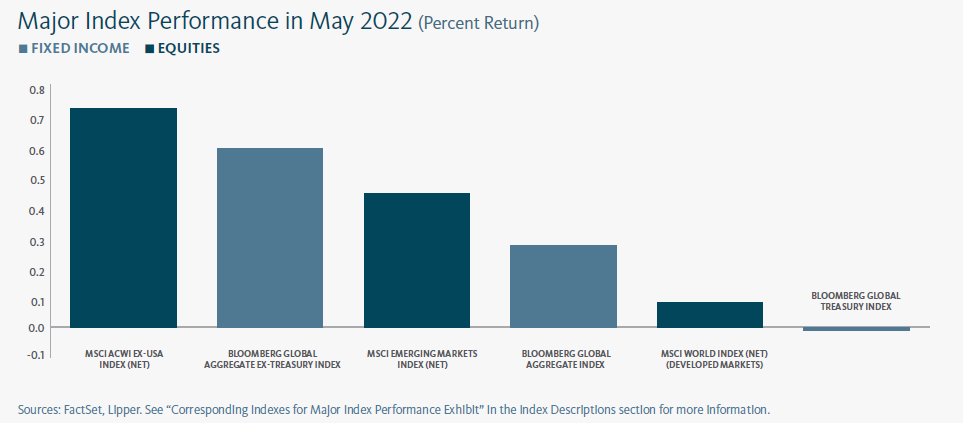
Global equities were practically unchanged in aggregate for May as a decline through the first half of the month was masked by a powerful recovery rally toward the end of the period.1 Emerging-market shares performed in line with developed markets, but a top-down perspective fails to capture the wide range of regional performances.
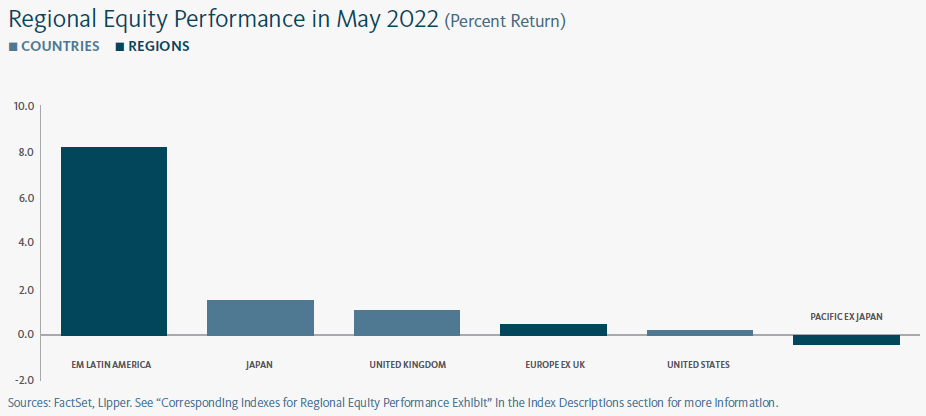
Latin American equities generally had the greatest concentration of strong gains in May, with Chile, Colombia, Brazil, and Mexico delivering the top-four country-level performances. The broader Middle East was well-represented among May’s poorest performers: the United Arab Emirates, Egypt, Saudi Arabia, Turkey, and Qatar earned five of the month’s seven largest losses (Pakistan and Hungary had the first and second steepest drops, respectively).
Among major markets, Hong Kong shares led with a strong gain, and UK and Japanese equities also performed quite well. Mainland Chinese shares generated a healthy positive return, while European shares were modestly positive and US shares were moderately negative.
UK and eurozone government-bond yields increased across the yield curve, with longer-term bond rates rising by more than those with shorter terms. Shorter- and longer-term US Treasury rates increased, while rates declined on Treasurys with maturities of 2 to 10 years.
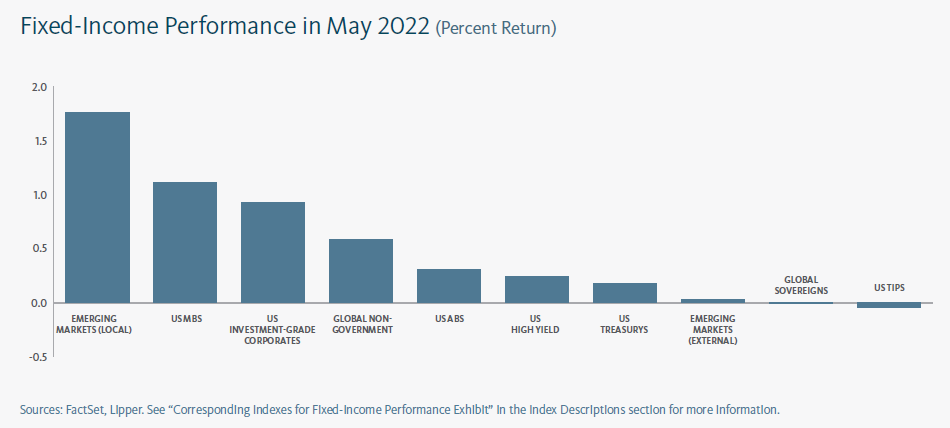
Local-currency emerging-market debt was the best-performing fixed-interest segment in May as the US dollar’s nearly yearlong ascent (measured by the US Dollar Index) appeared to crest in mid-May before retreating through the end of the month. Most other fixed-interest asset classes were also positive besides inflation-indexed securities.
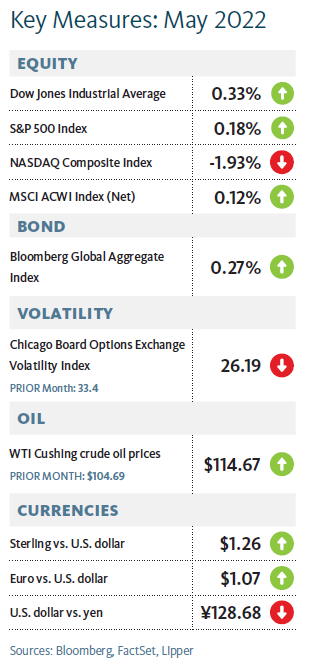
Commodity prices continued to climb in May. Brent and West-Texas Intermediate crude oil prices gained 7.9% and 9.5%, respectively, and natural gas prices increased by 10.7%. The EU prepared to impose additional sanctions on Russian oil imports as May concluded, and planned to ban insurance providers from covering tanker ships transporting Russian oil to anywhere in the world.
Russia’s aggression against Ukraine has also resulted in sanctions on Russian wheat; this, along with Russia’s blockade of Ukrainian ports pushed importers of the food staple further into crisis as the two nations accounted for nearly 30% of global wheat exports in recent years.3
United Nations efforts to broker a compromise between Russia and Western powers—which would allow critical Russian fertilizer exports if Russia gives way on Ukrainian ports—received a cool reception by Moscow in late May as it pushed for broader relief from sanctions.
The UK signed formal declarations of mutual defence with Finland and Sweden in early May. Shortly thereafter, both Scandinavian countries applied for NATO membership. Their applications—which require unanimous approval by current members—were met with resistance by Turkey; the NATO member demanded that Finland and Sweden both cease support for the Kurdistan Workers Party (PKK) and resume arms exports to Turkey.
In late May, the US prepared a defence-assistance package for Ukraine valued at $700 million. The package included mobile long-range artillery rocket systems, the first time the US has provided these weapons to Ukraine. This development invited Russia’s ire, although US President Joe Biden assured the Kremlin that the rockets would not be used to target Russian territory. Earlier in May, Biden signed a $40 billion bill passed by Congress for new assistance to Ukraine.
Shanghai’s residents counted down to midnight on the last night of May as the city of 25 million people prepared to emerge from a zero-COVID-19 lockdown that lasted roughly two months. Restaurant dining will remain closed beyond 1 June, and residents are required to take a PCR test every 72 hours. Beijing’s shorter and less-restrictive lockdown measures also eased as May concluded. The lockdowns, while an apparent success in drastically reducing new COVID-19 cases, took a steep economic toll and aggravated existing supply-chain weaknesses.
Economic Data
UK
- Consumer prices in the UK jumped by 9.0% in the 12 months to April compared to a 7.0% 12-month climb in March, and the highest level since 1982.5
- UK’s claimant count (which calculates the number of people claiming Jobseeker’s Allowance) declined in May for the fifteenth consecutive month—by about 57,000, with total claimants representing 4.1% of the population in April compared to 4.2% in March.
- UK manufacturing growth continued to cool slightly in May from a January peak, but remained at healthy levels.6
- Growth in the UK services sector dropped sharply during May from elevated April levels and red-hot growth in March.7
- The UK economy expanded by 0.8% during the first quarter and 8.7% year over year, slowing from rates of 1.3% and 9.5%, respectively, in the fourth quarter of 2021.
Eurozone
- The eurozone unemployment rate held at 6.8% in April—the lowest level since Eurostat began tracking the dataset in 1998.
- Consumer prices in the eurozone increased during May by 0.8% for the month and 8.1% for the 12-month period, compared to relatively slower respective rates of 0.6% and 7.5% in April.
- Eurozone manufacturing activity remained healthy but eased in May compared to the uptick that held through March and April.8
- Expansion in eurozone services maintained a solid pace in May, but below April’s peak.9
- The eurozone economy grew by 0.3% during the first quarter and 5.1% year over year, compared to 0.3% and 4.7%, respectively, in the fourth quarter of 2021.
US
The US labour market added 390,000 jobs in May, while average hourly earnings increased by 0.3% for the month and 5.2% over the prior year. The unemployment rate held at 3.6%, just above a 50-year low.
The US consumer-price index increased by 8.3% in the year through April, just below the multi-decade high of 8.5% recorded in March.
Manufacturing activity in the US was mixed in May, with healthy new-order growth, stagnant employment conditions, and high price pressures.10
US services growth continued to slow in May after accelerating sharply from the beginning of the year.11
The overall US economy contracted during the first quarter by an annualised 1.5%, the first decline since the second quarter of 2020.
Central banks
- The Bank of England’s (BoE) Monetary Policy Committee (MPC) voted to increase the bank rate by 0.25% for the fourth consecutive time at its May meeting, pushing the benchmark rate to 1.0%, its highest level in 13 years. It also began to reduce its balance sheet by ceasing to reinvest proceeds from its asset-purchase programme and commencing corporate bond sales.
- The European Central Bank (ECB) did not hold a monetary policy meeting in May. Following its mid-April meeting, the central bank restated its commitment to winding down its Asset Purchase Programme—set to conclude in the third quarter following monthly net purchases of €40 billion in April, €30 billion in May, and €20 billion in June.
- At its early May meeting, the US Federal Open Market Committee (FOMC) increased the federal-funds rate by 0.50%—the first hike of its size since 2000—to a 0.75%-to-1% range. The FOMC also announced plans to reduce its balance sheet in June, allowing Treasurys and mortgages to run off (that is, mature without being replaced) at maximum respective paces of $60 billion and $35 billion per month.
- The Bank of Japan (BOJ) did not hold a monetary policy meeting in May after redoubling its commitment to loose policy at its late-April meeting. Its short term interest rate remained at -0.1%, and the 10-year Japanese government bond (JGB) yield target held near 0%. The central bank offered unlimited purchases of 10-year JGBs at 0.25% in order to keep its yield within the BOJ’s acceptable range.
SEI’s View
As was the case with the pandemic that hit with full force this time two years ago, no one knows how long the Ukraine-Russia conflict will last or how extensive its impact will be on the global economy. However, our experience with COVID-19 and the economic and financial response to prior geopolitical events serve as a guide.
Pre-invasion, we were optimistic that global economic growth would remain solid as countries eased their COVID-19-related restrictions. Europe was expected to improve at least as fast as the US, if not faster. This is now a questionable assumption. We cannot emphasise enough how uncertain the economic environment has become. Instead of seeing a normalisation of activity with fewer supply-chain delays and easing COVID-19 restrictions, we are witnessing a war that is expected to extend and exacerbate the “everything shortage.” COVID-19- related disruptions in Asia also remain an ever-present threat.
It is fortunate for the advanced economies that households and businesses were in mostly good financial shape coming into the crisis.
Year-over-year growth in employment was continuing to accelerate heading into 2022 despite the Omicron outbreak. Despite this labour-market vibrancy, workers’ wages have begun to fall behind the high inflation rates recorded in the US and elsewhere. One would think that a contraction in real compensation is a sure sign that an economic recession is already underway. Yet that is not the case. Median wage growth in the US for the lowest-income quartile is up 6.4% over the 12 months ended April, in line with the 6.3% rise in the Fed’s Personal Consumption Expenditures (PCE) Price Index for overall personal-consumption expenditures. By comparison, the overall median wage gain for this period amounted to only 4.7%.
While wage gains are lagging inflation at the upper quartiles, higher-income groups have benefited from the boom in home prices and the long bull market in financial assets; they also hold the bulk of excess saving that built up during the pandemic.
Although incomes in the aggregate are not keeping up with inflation, we anticipate that households will draw down savings and increase debt in an effort to maintain living standards. In the US, the household saving rate has fallen sharply to 4.4% of disposable income from an average of 7.5% over the 2014-to- 2019 period. Between 2005 and 2007, by contrast, the saving rate averaged less than 4%. Today, each percentage-point drop in the saving rate would translate into a 4% gain in nominal GDP.
Businesses face a similar scenario. The long period of ultra-low interest rates has allowed companies to engage in a refinancing boom. Earnings before interest and taxes in the US non-financial corporate sector cover interest expense 7.9 times, the highest ratio in more than 50 years.12
Meanwhile, Russia’s aggression toward Ukraine has placed government leaders in the US, Europe and other advanced countries in a quandary. They have been tasked with responding urgently to the crisis by providing support while simultaneously pulling back on monetary and fiscal excesses that are partially to blame for the worst inflation in decades.13,14 European governments will seek to mitigate the influx of Ukrainian refugees and the invasion-induced impact of spiking fuel and electricity costs and make a significant upward adjustment in defence spending.
By contrast, the US fiscal response to inflation is likely to be far less robust as it remains bedevilled by political gridlock. Not only has the US registered one of the largest increases in emergency spending among the major economies over the last two years, it also has one of the worst inflation problems at a time when the domestic political environment is in an extremely fractious state.
Turning to monetary policy, the move toward higher interest rates and the end of quantitative easing appear to be a global trend (with the main exception of Japan). Households and businesses were in strong financial shape coming into this rate-hiking cycle at a time when there is a great deal of pent-up demand. It may well take some time to put a big dent in this economic momentum. Of course, the economy will eventually tip into recession if central banks are forced to raise rates well above the inflation rate. That may happen during the current cycle if inflation proves harder to tamp down than currently anticipated.
There is no denying that these conditions present major challenges for financial assets beyond the uncertainties caused by war. This is especially so for long duration assets such as growth-oriented equities that trade at higher price-to earnings ratios and longer-maturity bonds.
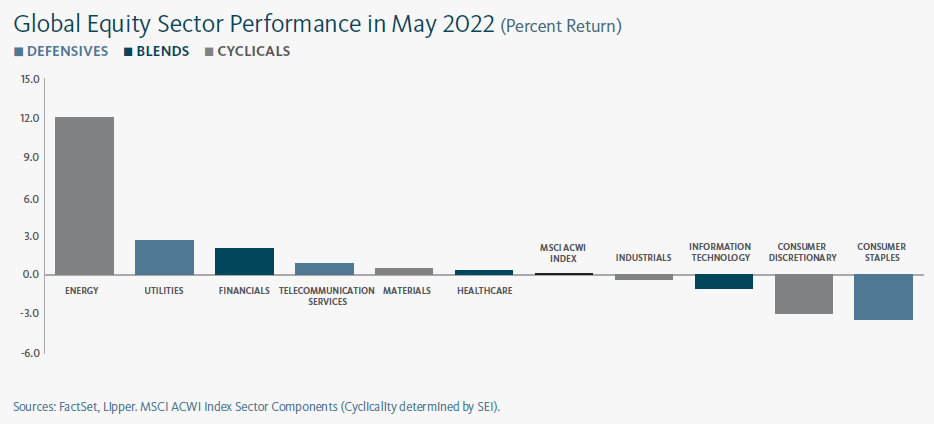
Commodity markets have been surging due to the shortages caused by COVID-19 disruptions, and now by the war in Ukraine. US value stocks have held up relatively well in the year to date, led by a large absolute price gain in the energy sector and better-than-benchmark performances in financials, utilities, industrials, materials and health care (as measured by the S&P 500 Index). Meanwhile, technology
companies and equities with high valuations have suffered as earnings multiples contracted amid the climb in bond yields, while the decline in the bond market itself is especially notable.
In emerging markets, Latin America has bucked the trend seen in other geographies as the region generally benefits from the rise in commodity prices. The jump in interest rates in countries like Brazil and Mexico has also stabilized their currencies against the US dollar despite currently high domestic rates of inflation.
Emerging Asia, a major consumer of commodities, has lost ground as COVID-19 has continued to exert an impact on economic activity. The technology sector in China remains under pressure, although strong government verbal support resulted in a big rally in the middle of March.
Amid all this variability in performance, emerging markets appear to be fertile ground for active management. Volatile environments provide an opportunity for active managers to review exposures in an effort to weed out likely losers from winners.
Periods of crisis and instability are worrying for all investors, particularly as the turn of events in the short term can be difficult to predict. We saw this in the first weeks following Russia’s invasion of Ukraine, as impacts from the crisis overwhelmed more traditional market drivers.
During times like these, one of the greatest mistakes an investor can commit is to panic and indiscriminately make changes for fear of losing money. In periods of unusual stress, a clear philosophy and process can guide calm, rational, long-term decision making.
Glossary of Financial Terms
Asset Purchase Programme (APP): The ECB’s APP is part of a package of non-standard monetary policy measures that also includes targeted longer-term refinancing operations, and which was initiated in mid-2014 to support the monetary policy transmission mechanism and provide the amount of policy accommodation needed to ensure price stability.
Bull market: A bull market refers to a market environment in which prices are generally rising (or are expected to rise) and investor confidence is high.
Commercial paper: Commercial paper is a type of short-term loan that is not backed by collateral and does not tend to pay interest.
Debt ceiling: The debt ceiling refers to the US federal government’s borrowing limit, which can be changed through action by the US Congress.
European Commission: The European Commission is the executive branch of the European Union. It operates as a cabinet government, with 27 members of the Commission headed by a President.
Fiscal policy: Fiscal policy relates to decisions about government revenues and outlays, like taxation and economic stimulus.
Group of 7 (G7): The G7 is an inter-governmental forum for the leaders of major advanced democratic nations that includes Canada, France, Germany, Italy, Japan, the UK and the US.
Hawk: Hawk refers to a central-bank policy advisor who has a negative view of inflation and its economic impact, and thus tends to favour higher interest rates.
International Energy Agency (IEA): The IEA is an international organisation that advises national governments on energy policy and provides information on global energy trends.
Monetary policy: Monetary policy relates to decisions by central banks to influence the amount of money and credit in the economy by managing the level of benchmark interest rates and the purchase or sale of securities. Central banks typically make policy decisions based on their mandates to target specific levels or ranges for inflation and employment.
Mortgage-Backed Securities: Mortgage-backed securities (MBS) are pools of mortgage loans packaged together and sold to the public. They are usually structured in tranches that vary by risk and expected return.
NATO: The North Atlantic Treaty Organization (NATO) is an intergovernmental military alliance among 28 European countries and 2 North American countries.
Pandemic Emergency Purchase Programme (PEPP): PEPP is a temporary asset-purchase programme of private and public sector securities established by the European Central Bank to counter the risks to monetary-policy transmission and the outlook for the euro area posed by the COVID-19 outbreak.
Price-to-earnings (PE) ratio: The PE ratio is equal to the market capitalization of a share or index divided by trailing (over the prior 12 months) or forward (forecasted over the next 12 months) earnings. The higher the PE ratio, the more the market is willing to pay for each dollar of annual earnings.
Quantitative easing: Quantitative easing refers to expansionary efforts by central banks to help increase the supply of money in the economy.
Summary of Economic Projections: The Fed’s Summary of Economic Projections (SEP) is based on economic projections collected from each member of the Fed Board of Governors and each Fed Bank president on a quarterly basis.
Yield: Yield is a general term for the expected return, in percentage or basis points (one basis point is 0.01%), of a fixed-income investment.
Yield curve: The yield curve represents differences in yields across a range of maturities of bonds of the same issuer or credit rating (likelihood of default). A steeper yield curve represents a greater difference between the yields. A flatter curve indicates the yields are closer together.
Index Descriptions
The Bloomberg Commodity Index is composed of futures contracts and reflects the returns on a fully collateralised investment in the Index. This combines the returns of the Index with the returns on cash collateral invested in 13-week (3-month) US Treasury bills.
The Bloomberg Global Aggregate Index is an unmanaged market-capitalisation-weighted benchmark that tracks the performance of investment-grade fixed-income securities denominated in 13 currencies. The Index reflects reinvestment of all distributions and changes in market prices.
The US Consumer Price Index (CPI) measures changes in the price level of a weighted-average market basket of consumer goods and services purchased by households. A consumer price index is a statistical estimate constructed using the prices of a sample of representative items whose prices are collected periodically.
The MSCI ACWI Index is a market-capitalisation-weighted index composed of over 2,000 companies, and is representative of the market structure of 46 developed- and emerging-market countries in North and South America, Europe, Africa and the Pacific Rim. The index is calculated with net dividends reinvested in US dollars.
The US Personal Consumption Expenditures (PCE) Price Index is the primary inflation index used by the Federal Reserve when making monetary-policy decisions.
The S&P 500 Index is a market-capitalization-weighted index that consists of 500 publicly-traded large U.S. companies that are considered representative of the broad U.S. stock market.
The U.S. Dollar Index (DXY Index) measures the value of the U.S. dollar relative to a basket of other currencies, including the currencies of some of the US’s major trading partners: the euro, Swiss franc, Japanese yen, Canadian dollar, British pound, and Swedish krona.
Important Information
Data refers to past performance. Past performance is not a reliable indicator of future results.
Investments in SEI Funds are generally medium- to long-term investments. The value of an investment and any income from it can go down as well as up. Investors may get back less than the original amount invested. Returns may increase or decrease as a result of currency fluctuations. Additionally, this investment may not be suitable for everyone. If you should have any doubt whether it is suitable for you, you
should obtain expert advice.
No offer of any security is made hereby. Recipients of this information who intend to apply for shares in any SEI Fund are reminded that any such application may be made solely on the basis of the information contained in the Prospectus. This material represents an assessment of the market environment at a specific point in time and is not intended to be a forecast of future events, or a guarantee of future results. This information should not be relied upon by the reader as research or investment advice regarding the funds or any stock in particular, nor should it be construed as a recommendation to purchase or sell a security, including futures contracts.
In addition to the normal risks associated with equity investing, international investments may involve risk of capital loss from unfavourable fluctuation in currency values, from differences in generally accepted accounting principles or from economic or political instability in other nations. Bonds and bond funds are subject to interest rate risk and will decline in value as interest rates rise. High yield bonds involve greater risks of default or downgrade and are more volatile than investment grade securities, due to the speculative nature of their investments. Narrowly focused investments and smaller companies typically exhibit higher volatility. SEI Funds may use derivative instruments such as futures, forwards, options, swaps, contracts for differences, credit derivatives, caps, floors and currency forward contracts. These instruments may be used for hedging purposes and/or investment purposes.
While considerable care has been taken to ensure the information contained within this document is accurate and up-to-date, no warranty is given as to the accuracy or completeness of any information and no liability is accepted for any errors or omissions in such information or any action taken on the basis of this information.
This information is issued by SEI Investments (Europe) Limited, 1st Floor, Alphabeta, 14-18 Finsbury Square, London EC2A 1BR which is authorised and regulated by the Financial Conduct Authority.
SEI sources data directly from FactSet, Lipper, and BlackRock, unless otherwise stated.
The opinions and views in this commentary are of SEI only and should not be construed as investment advice.
Please refer to our latest Prospectus (which includes information in relation to the use of derivatives and the risks associated with the use of derivative instruments), Key Investor Information Document, Summary of UCITS Shareholder rights (which includes a summary of the rights that shareholders of our funds have) and the latest Annual or Semi-Annual Reports for more information on our funds, which can be located at Fund Documents. And you should read the terms and conditions contained in the Prospectus (including the risk factors) before making any investment decision.


