Monthly Market Commentary: Investors deal with inflated expectations.
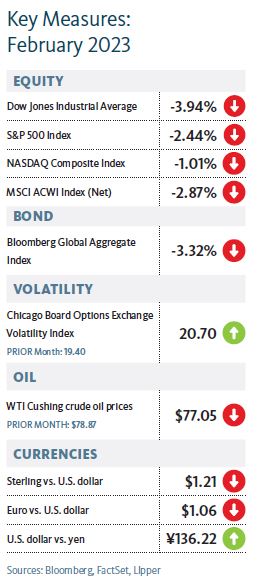
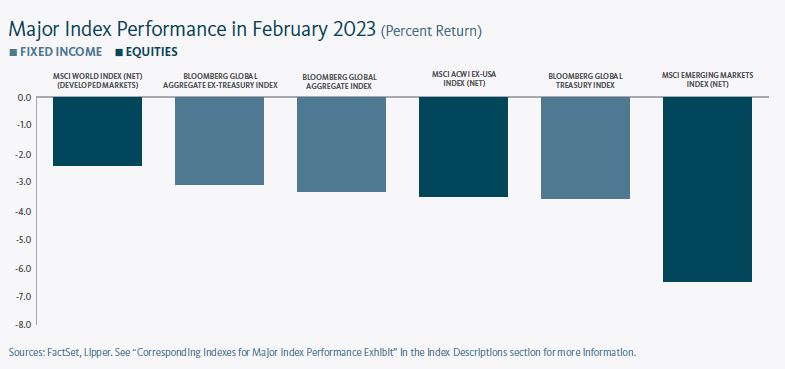
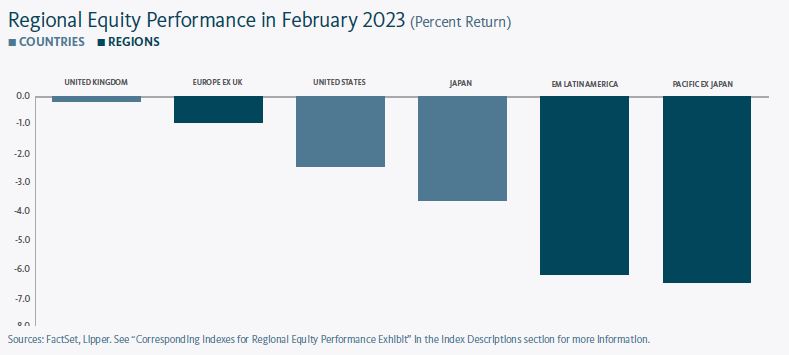
Following strong performance to start the year, most global equity markets reversed direction in February. Investors were concerned that ongoing inflationary pressures, including stronger-than-expected labour market data, would prompt the U.S. Federal Reserve (Fed) and other major central banks to extend their interest rate-hiking cycles. Developed-market equities saw less significant declines than their emerging-market counterparts during the month. Europe was the strongest performer within both the developed and emerging markets in February. Conversely, North America was the weakest-performing developed market, with Canada trailing the U.S. Among emerging markets, Asia was the primary laggard due mainly to weakness in China. Latin America stocks also recorded sizeable losses, most notably in Brazil.
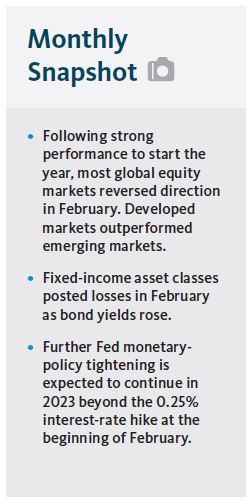
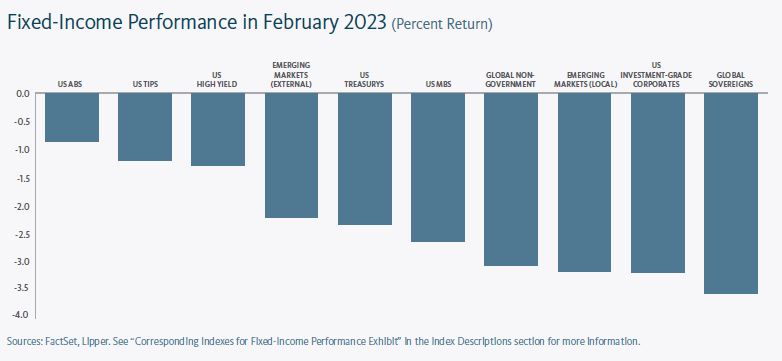
U.S. fixed-income assets posted losses in February as bond yields rose across the U.S. Treasury yield curve (yields and prices have an inverse relationship). High-yield bonds saw the smallest declines and were the top performers for the month, followed by U.S. Treasury and mortgage-backed securities (MBS). Corporate bonds were the primary fixed-income market laggards in February. The increase in Treasury yields during the month was most pronounced in the two-, three- and five-year segments of the curve. The spread between two- and ten-year notes increased 0.20% over the month, further inverting the yield curve.
Prices in the global commodities markets generally lost ground in February. The West Texas Intermediate crude-oil spot price decreased 2.3%, while Brent crude oil fell 2.4% amid concerns that additional interest-rate hikes from central banks will weigh on global economic growth and reduce demand. The New York Mercantile Exchange (NYMEX) natural gas price climbed 6.7% during the month, bolstered by the U.S. Energy Information Administration’s report of a greater-than-expected decline in inventories during the week ending February 20. Natural gas prices had fallen steadily since mid-December of last year as an unusually mild winter in the U.S. continued to weigh on demand during the winter home-heating season. The gold spot price was down 5.6% in February amid investors’ worries that the Fed’s rate hikes may lead to a recession in the U.S., which would hamper demand for precious metals. Wheat prices fell 7.3% in February as Egypt made a large purchase tender for Russian wheat at a relatively low price. Russia reduced its prices in a bid to undercut those of other wheat-exporting countries.
In the U.S., all eyes (and ears) were on the Fed in February. During a discussion at the Economic Club of Washington, D.C., early in the month, Fed Chair Jerome Powell commented that the central bank’s efforts to cool inflation are “likely to take quite a bit of time. It’s not going to be smooth. So we think we’re going to have to do further [rate] increases, and we think we’ll have to hold policy at a restrictive level for some time.” Later in the month, Federal Reserve Bank of Cleveland President Loretta Meister stated her view that the federal funds rate must surpass 5% in order to bring inflation down to the central bank’s 2% target rate. In light of this assessment, she believed that there was “a compelling economic case” for a 50-basis-point (0.50%) increase at the Fed’s meeting on January 31-February 1. The Federal Open Market Committee approved a 25-basis-point rate hike during the meeting.
The U.S. dollar made a strong comeback in February following a four-month retreat. After reaching a bottom on February 1, the ICE U.S. Dollar Index rose over 3%, benefiting mainly from expectations that the Fed will need to increase interest rates further to tame stubbornly high inflation. The DXY fell more than 11% between late September 2022 and late January of this year due to investors’ worries about a possible recession in the U.S.
There were signs of a break in the ongoing labour tensions between U.K. public employees and the government. The administration of Prime Minister Rishi Sunak has been plagued by public-sector employee strikes and other job actions as pay increases have not kept up with the U.K.’s inflation rate, which rose 10.1% year over year in January. Sunak is considering pay increases of a maximum of 5% for public employees after the Office for National Statistics (ONS) reported that the public sector had a budget surplus of £5.4 billion (US$6.5 billion) in January. During the current financial year (which runs from April 6, 2022, to April 5, 2023) through January, the U.K. public sector borrowed £30.6 billion (US$36.7 billion) less than the Office for Financial Responsibility had projected in November 2022. The lower-than-expected credit costs resulted mainly from higher-than-expected tax revenues, reduced borrowing by local authorities and nationalized industries, and lower-than-anticipated government subsidies for household and company energy bills. U.K. Chancellor Jeremy Hunt will introduce the government’s budget proposal for the 2023-2024 financial year in mid-March. In response to the news of a possible pay raise, the Royal College of Nursing canceled its plan for a 48-hour strike to restart labour negotiations with the U.K. National Health Service (NHS). In a related matter, the Financial Times reported that, according to an internal memo from the HM Treasury, the U.K.’s economic and finance ministry, there was minimal risk that public-sector pay hikes of up to 5% would establish a precedent for large pay increases for private-sector workers.
In the eurozone, there were fears of recession in Germany as the nation’s economy contracted by a greater-than-expected annual rate of 0.4% in the fourth quarter of 2022. High inflation weighed on consumer spending and investments in buildings and machinery during the quarter.
Nearly a year after the beginning of Russia’s invasion of Ukraine, U.S. President Joe Biden made an unannounced visit to Ukraine to meet with his counterpart, Volodymyr Zelenskyy, and to encourage ongoing support from U.S. allies. The visit occurred as Russian President Vladimir Putin increased military activity in eastern Ukraine. Biden’s trip was particularly risky as there was no protection from U.S. military personnel on the ground in Ukraine.
According to The Wall Street Journal, a classified intelligence report recently provided to the White House and several members of the U.S. Congress revealed that the U.S. Department of Energy agreed with the Federal Bureau of Investigation’s (FBI) determination that the COVID-19 pandemic began with a leak in a lab in China; four other U.S. agencies still believe that the virus likely originated from natural transmission. The Energy Department reached this conclusion based on new intelligence information. However, the agency noted that it made its judgment with “low confidence.”9 China’s government vehemently disputed the determination of the Department of Energy. A spokesperson for the National Security Council said that the Biden Administration still has not come to a conclusion regarding the origin of COVID.
Economic data
U.S.
- Inflation data for January sent mixed signals. The U.S. Department of Labor’sconsumer-price index (CPI) accelerated on a monthly basis (rising by 0.5% compared to 0.1% in December). However, the index recorded its smallest annual gain since October 2021, as it slowed to 6.4% year over year from 6.5% in December. Housing costs contributed significantly to inflation both for the month and for the 2022 calendar year. Food and energy prices (particularly gasoline) rose sharply in January. Core inflation, as measured by the CPI for all items less food and energy, rose 0.4% for the month and 5.6% year over year.
- According to the U.S. Department of Commerce, the personal-consumption-expenditures (PCE) price index posted greater-than-expected increases of 0.6% in January and 5.4% over the previous 12-month period. The PCE price index tracks the change in prices paid by or on behalf of consumers for a more comprehensive set of goods and services than the consumer-price index (CPI). Consequently, the PCE price index is the Fed’s preferred gauge of inflation. Energy goods and services comprised the bulk of the upturn in the PCE price
index in January, climbing 2.0%. Prices for nondurable goods rose 0.8% for the month after falling 0.7% in December. Food and energy goods and services costs recorded year-over-year increases of 11.1% and 9.6%, respectively.
- The Census Bureau reported that U.S. retail sales–a gauge of consumer spending that comprises more than two-thirds of gross domestic product (GDP) increased 3.0% in January and 6.4% year over year. All 13 retail categories achieved sales growth for the month, with the largest gains in food services and drinking places, motor vehicle and parts dealers, and furniture and home furnishings stores. Annual growth was strongest in food services and drinking places, while sporting goods, hobby, musical instrument, and book stores also performed well. Conversely, sales for electronics and appliance stores declined over the previous 12-month period.
- According to the Department of Commerce, U.S. GDP grew at an annual rate of 2.7% in the fourth quarter of 2022, marking a slowdown from the third quarter’s increase of 3.2%. The reading is also down slightly from the government’s initial fourth-quarter estimate of 2.9%. The government attributed the revised estimate to a downward revision to consumer spending and an increase in imports (which are subtracted from the calculation of GDP). The U.S. economy expanded by 2.1% for the 2022 calendar year.
U.K.
- According to the Office for National Statistics, consumer prices in the U.K. fell 0.4% month over month in January—a reversal of the 0.4% increase in December 2022. The inflation rate dipped to 10.1% over the previous 12-month period compared to the 10.5% year-over-year rise in December. Housing and household services (mainly from electricity, gas, and other fuels), as well as food and non-alcoholic beverages, were the primary contributors to the annual increase in prices.
- The ONS also reported that U.K. GDP fell by 0.5% in December 2022, following marginal growth of 0.1% in November, and was flat for the three-month period ending in December. The economy expanded by 4.1% for the 2022 calendar year. Production output increased 0.3% in December, led by electricity, gas, steam and air conditioning supply. Conversely, the services sector declined 0.8% for the month due mainly to downturns in human health and social work activity, and education.
- The S&P Global/CIPS Flash UK Manufacturing Output Index rose 4.6 to a nine-month high of 51.6 in January—the first increase in activity in seven months. (A reading above 50 indicates expansion.)
- The S&P Global/CIPS Flash UK Services PMI Business Activity Index was up 4.6 to 53.3 in January. There was particular strength in the services sector following four consecutive months of modest declines in activity.
Eurozone
- Inflation in the eurozone slowed by 0.6% to 8.6% in the 12-month period ending in January. Prices for energy and food, alcohol and tobacco saw double-digit gains for the year.
- Eurozone manufacturing activity expanded in February, with the S&P Global Flash Eurozone Manufacturing Purchasing Managers Index (PMI) rising 1.5 points to 50.4.
- Services activity in the eurozone reached an eight-month high in February, with the S&P Global Flash Eurozone Services PMI increasing 2.2 points to 53.0.
- According to Eurostat’s revised estimate issued in mid-February, the eurozone’s economy grew by 0.1% in the fourth quarter of 2022, unchanged from the initial growth estimate released in January. GDP rose by 1.9% year over year in the fourth quarter and increased by 3.5% for the 2022 calendar year.
Central banks
- It appears that the Fed believes that it will need to raise the federal funds rate above the previously expected year-end 2023 median of 5.1%, as noted in its “dot plot” of economic projections published in December of last year. In the minutes of its meeting concluded on February 1, the Federal Open Market Committee observed that “a policy stance that proved to be insufficiently restrictive could halt recent progress in moderating inflationary pressures, leading inflation to remain above the Committee’s 2 percent objective for a longer period, and pose a risk of inflation expectations becoming unanchored.”
- The Bank of England (BOE) released its monthly monetary policy survey of 59 financial market participants. The survey participants anticipate that the BOE will raise the Bank Rate by 0.25% at its next meeting in late March, then leave it unchanged for the remainder of the year. The central bank conducted the survey from January 18-20, so the participants may not express as much optimism in the next monthly survey, as the U.K.’s year-over-year inflation rate remains in double digits. The BOE increased its benchmark rate by 0.5% to 4.0% in early February.
- The respondents to the European Central Bank’s Survey of Professional Forecasters (SPF) for the first quarter of 2023 increased their projections for eurozone inflation to annual rates of 5.9% for 2023 and 2.7% in 2024—up from their estimates of 5.8% and 2.4%, respectively, noted in the Q4 2022 survey released in late October. The participants also forecasted eurozone GDP to increase by 0.2% in 2023 and 1.4% in 2024 compared to their previous estimates of 0.1% and 1.6% for the corresponding calendar years.
- In an address to the National Diet, Japan’s legislative body, Kazuo Ueda, the nominee for governor of the Bank of Japan (BOJ), signaled that he will maintain the central bank’s loose monetary policy even though annual inflation of 4.3% in January is well above the BOJ’s 2% target. Ueda commented: “I believe it is appropriate to continue monetary easing measures while being creative in line with the situation.” He cautioned that raising interest rates in the near term could slow the economy, as strong demand is not driving the current rise in inflation. Both Ueda and the two nominees for deputy governor are expected to be confirmed by the Diet in March.
SEI’s view
We still anticipate further volatility across asset classes as investors face familiar headwinds: inflation rates exceeding the targets of major central banks; interest-rate increases potentially continuing throughout the first half of the year; quantitative tightening; and, for many countries, stagnant or recessionary economies through 2023, and perhaps, into 2024.
“Stagnation” is the best way to describe the state of the global economy, but several regions will likely enter recession in the coming months. The Philadelphia Fed’s most recent survey pegged the probability of a U.S. recession occurring in the first quarter in 2023 at 42%.13 However, it is not at all clear to us whether that will be the case.
Wages are down in inflation-adjusted terms, the housing market is suffering a severe contraction, and some industries (notably within technology) are losing a significant number of jobs. However, the overall economy still isn’t declining in a pronounced, pervasive, and persistent manner—the so-called three Ps that characterize a typical recession.
With regard to inflation, we view it as a mistake to assume that prices will fall as precipitously as they have risen, or that they will make their way back to the 2% target that central banks of advanced economies set for themselves. This is especially true in the U.S. and other countries challenged by exceptionally tight labor markets and already-high wage inflation.
Further Fed monetary-policy tightening is expected to continue in 2023 beyond the 0.25% interest-rate hike at the beginning of February—with its target range projected to reach 5%-to-5.25% by June and 5.1% by year end, as noted in its “dot plot” issued in December. However, greater-than-expected monthly and annual increases in the PCE index may prompt the Fed to maintain its “steady-but- slower” rate-hiking cycle. The obvious question is whether the Fed’s forceful approach over the past year and, presumably, in the year ahead, will be sufficient to tame inflation. Or will it still prove insufficient, thereby forcing the central bank to keep raising its policy rate beyond its current expectations?
On the geopolitical front, the Russia’s war in Ukraine rages on. Energy prices are expected to remain volatile. Despite military aid to Ukraine from the U.S. and some of its allies, the country’s war with Russia appears likely to persist well into this year at the very least. As Russia is a major exporter of oil and natural gas to Europe, the possibility exists for more surprises that will keep energy prices quite volatile.
The Chinese government’s easing of the most onerous COVID-19 should help offset, at least partially, the impact of a global slowdown in advanced countries. It also eventually could exert upward pressure on commodity prices, especially for energy and metals. This would benefit commodity-oriented exporters in Latin America and the Middle East, along with South Africa, Indonesia, and Malaysia.
Glossary of Financial Terms
Yield is the income returned on an investment, such as the interest received from holding a security. The yield is usually expressed as an annual percentage rate based on the investment’s cost, current market value, or face value.
Mortgage-backed securities (MBS) are pools of mortgage loans packaged together and sold to the public. They are usually structured in tranches (a slice or portion of a structured security) that vary by risk and expected return. Gross domestic product (GDP) is the total monetary or market value of all the goods and services produced in a country during a certain period.
The federal-funds rate is the interest rate charged to lending institutions on unsecured overnight loans. It is set by the U.S. Federal Reserve’s Federal Open Market Committee. The rate is increased when the Federal Reserve wants to discourage borrowing and slow the economy and decreased when the Federal Reserve wants to spur economic growth.
Yield curve represents differences in yields across a range of maturities of bonds of the same issuer or credit rating (are (which is used to assess the risk of default of companies or countries). A steeper yield curve represents a greater difference between the yields. A flatter curve indicates the short- and long-term yields are closer together.
Monetary policy refers to decisions by central banks to influence the amount of money and credit in the economy by managing the level of benchmark interest rates and the purchase or sale of securities. Central banks typically make policy decisions based on their mandates to target specific levels or ranges for inflation and employment.
A recession is a significant and prolonged downturn in economic activity. Inflation is the rate of increase in prices over a given period of time.
Quantitative easing refers to expansionary efforts by central banks to help increase the supply of money in the economy. These actions include the purchase of long-term government bonds and mortgage-backed securities (pools of mortgage loans packaged together and sold to the public).
Quantitative tightening refers to efforts by central banks to decrease the supply of money in the economy.
Yield curve control comprises the targeting of a longer-term interest rate by a central bank, which then buys or sells as many bonds as necessary to hit that rate target.
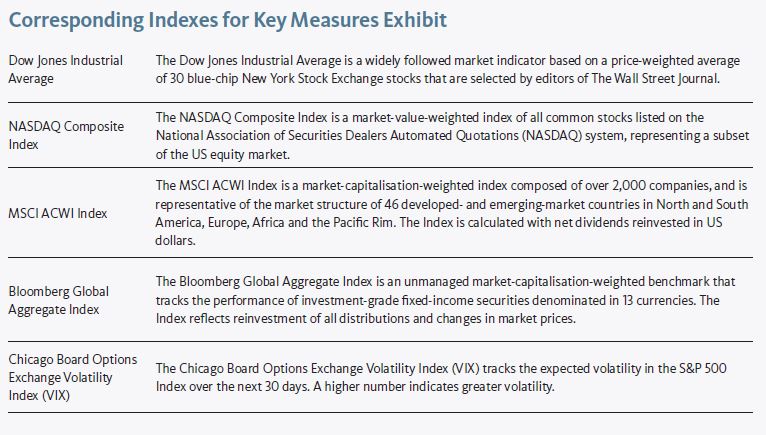
Index Descriptions
The ICE BofA U.S. High Yield Constrained Index is a market capitalization-weighted index which tracks the performance of U.S. dollar-denominated below-investment-grade (rated BB+ or lower by S&P Global Ratings and Fitch Ratings or Ba1 or lower by Moody’s Investors Service) corporate debt publicly issued in the U.S. domestic market.
The ICE BofA U.S. Treasury Index tracks the performance of fixed-rate, nominal debt issued by the U.S. Treasury.
The ICE BofA U.S. Corporate Index includes publicly issued, fixed-rate, nonconvertible investment-grade (rated BBB- or higher by S&P Global Ratings and Fitch Ratings or Baa3 or higher by Moody’s Investors Service) dollar-denominated, U.S. Securities and Exchange (SEC)-registered corporate debt having at least one year to maturity.
The S&P U.S. Mortgage-Backed Securities Index tracks the performance of U.S. dollar-denominated, fixed-rate and adjustable-rate/ hybrid mortgage pass-through securities issued by Ginnie Mae (GNMA), Fannie Mae (FNMA) and Freddie Mac (FHLMC).
The ICE U.S. Dollar Index measures the value of the U.S. dollar relative to a basket of foreign currencies.
Consumer-price indexes measure changes in the price level of a weighted-average market basket of consumer goods and services purchased by households. A consumer price index is a statistical estimate constructed using the prices of a sample of representative items whose prices are collected periodically.
A purchasing managers’ index (PMI) tracks the prevailing direction of economic trends in the manufacturing and service sectors.
The S&P Global/CIPS Flash UK Manufacturing Output Index measures the activity level of purchasing managers in the manufacturing sector of the U.K. A reading above 50 indicates expansion in the sector; below 50 indicates contraction.
The S&P Global Flash UK Services PMI Business Activity Index measures the activity level of purchasing managers in the services sector. A reading above 50 indicates expansion in the sector; a reading below 50 indicates contraction.
The S&P Global Flash Eurozone Manufacturing PMI measures the activity level of purchasing managers in the manufacturing sector of the eurozone. A reading above 50 indicates expansion in the sector; below 50 indicates contraction.
The S&P Global Flash Eurozone Services PMI measures the activity level of purchasing managers in the services sector of the eurozone. A reading above 50 indicates expansion in the sector; below 50 indicates contraction.
Important Information
The information contained herein is for general and educational information purposes only and is not intended to constitute legal, tax, accounting, securities, research or investment advice regarding the Strategies or any security in particular, nor an opinion regarding the appropriateness of any investment. This information should not be construed as a recommendation to purchase or sell a security, derivative or futures contract. You should not act or rely on the information contained herein without obtaining specific legal, tax, accounting and investment advice from an investment professional. This material represents an assessment of the market environment at a specific point in time and is not intended to be a forecast of future events, or a guarantee of future results. There is no assurance as of the date of this material that the securities mentioned remain in or out of the SEI Strategies. Positioning and holdings are subject to change. All information as of February 28, 2023.
Information contained herein that is based on external sources or other sources is believed to be reliable, but is not guaranteed by SEI, and the information may be incomplete or may change without notice. This document may not be reproduced, distributed to another party or used for any other purpose.
There are risks involved with investing, including loss of principal. Diversification may not protect against market risk. There may be other holdings which are not discussed that may have additional specific risks. Narrowly focused investments and smaller companies typically exhibit higher volatility. International investments may involve risk of capital loss from unfavourable fluctuation in currency values, from differences in generally accepted accounting principles or from economic or political instability in other nations. Emerging markets involve heightened risks related to the same factors, in addition to those associated with their relatively small size and lesser liquidity. Bonds will decrease in value as interest rates rise. High yield bonds involve greater risks of default or downgrade and are more volatile than investment grade securities, due to the speculative nature of their investments. SEI products may use derivative instruments such as futures, forwards, options, swaps, contracts for differences, credit derivatives, caps, floors and currency forward contracts. These instruments may be used for hedging purposes and/or investment purposes.
While considerable care has been taken to ensure the information contained within this document is accurate and up-to-date, no warranty is given as to the accuracy or completeness of any information and no liability is accepted for any errors or omissions in such information or any action taken on the basis of this information.
The value of an investment and any income from it can go down as well as up. Investors may get back less than the original amount invested. Returns may increase or decrease as a result of currency fluctuations. Past performance is not a reliable indicator of future results. Investment may not be suitable for everyone. If you should have any doubt whether it is suitable for you, you should obtain expert advice.
Index returns are for illustrative purposes only, and do not represent actual account performance. Index returns do not reflect any management fees, transaction costs or expenses. Indexes are unmanaged and one cannot invest directly in an index.
Not all strategies discussed may be available for your investment.
This material is not directed to any persons where (by reason of that person’s nationality, residence or otherwise) the publication or availability of this material is prohibited. Persons in respect of whom such prohibitions apply must not rely on this information in any respect whatsoever.
The views and opinions within this document are of SEI only and are subject to change. They should not be construed as investment advice.
The SEI Global Assets Fund Plc, SEI Global Investments Fund Plc, and SEI Global Master Fund Plc (the “SEI UCITS Funds”) are structured as open-ended collective investment schemes and are authorised in Ireland by the Central Bank as a UCITS pursuant to the UCITS Regulations. The SEI UCITS Funds are managed by SEI Investments, Global Ltd (“SIGL”). SIGL has appointed SEI Investments (Europe) Ltd (“SIEL”) to provide general distribution services in relation to the SEI UCITS Funds either directly or through the appointment of other sub-distributors. The SEI UCITS Funds may not be marketed to the general public except in jurisdictions where the funds have been registered by the relevant regulator. The matrix of the SEI UCITS fund registrations can be found here seic.com/GlobalFundRegistrations.
No offer of any security is made hereby. Recipients of this information who intend to apply for shares in any SEI UCITS Fund are reminded that any such application may be made solely on the basis of the information contained in the Prospectus. Please refer to our latest Prospectus (which includes information in relation to the use of derivatives and the risks associated with the use of derivative instruments), Key Investor Information Document, Summary of UCITS Shareholder rights (which includes a summary of the rights that shareholders of our funds have) and the latest Annual or Semi- Annual Reports for more information on our funds, which can be located at Fund Documents.
SIEL has appointed SEI Investments (Asia) Limited (SEIAL) of Suite 904, The Hong Kong Club Building, 3 Jackson Road, Central, Hong Kong as the sub-distributor of the SEI UCITS funds.
Singapore
The offer or invitation to subscribe for or purchase shares of the Sub-Funds (the “Shares), which is the subject of this Information Memorandum, is an exempt offer made only: (i) to “institutional investors” pursuant to Section 304 of the Securities and Futures Act, Chapter 289 of Singapore (the “Act”), (ii) to “relevant persons” pursuant to Section 305(1) of the Act, (iii) to persons who meet the requirements of an offer made pursuant to Section 305(2) of the Act, or (iv) pursuant to, and in accordance with the conditions of, other applicable exemption provisions of the Act.
No exempt offer of the Shares for subscription or purchase (or invitation to subscribe for or purchase the Shares) may be made, and no document or other material (including this Information Memorandum) relating to the exempt offer of Shares may be circulated or distributed, whether directly or indirectly, to any person in Singapore except in accordance with the restrictions and conditions under the Act. By subscribing for Shares pursuant to the exempt offer under this Information Memorandum, you are required to comply with restrictions and conditions under the Act in relation to your offer, holding and subsequent transfer of Shares.
This information is being made available in Hong Kong by SEIAL. The contents of this document have not been reviewed by any regulatory authority in Hong Kong. You are advised to exercise caution in relation to the offer. If you are in any doubt about any of the contents of this document, you should obtain independent professional advice.
The SEI UCITS Funds have not been authorised by the SFC in Hong Kong and will be an unregulated collective investment scheme for the purpose of the Securities and Futures Ordinance of Hong Kong (the “SFO”). Shares of the SEI UCITS Funds may not be offered or sold by means of any document in Hong Kong other than (a) to professional investors as defined in the SFO and its subsidiary legislation or (b) in other circumstances which do not result in the document being a “prospectus” as defined in the Companies Ordinance (“CO”) or which do not constitute an offer to the public within the meaning of the CO. This document does not constitute an offer or invitation to the public in Hong Kong to acquire shares in the SEI UCITS Funds. These materials have not been delivered for registration to the Registrar of Companies in Hong Kong.
It is the responsibility of every recipient to understand and observe applicable regulations and requirements in their jurisdiction. This information is only directed at persons residing in jurisdictions where the SEI UCITS Funds are authorised for distribution or where no such authorisation is required.
The Shares may not be offered, sold or delivered directly or indirectly in the US or to or for the account or benefit of any US Person except pursuant to an exemption from, or in a transaction not subject to, the registration requirements of the Securities Act of 1933 and any applicable state laws.
This information is made available in Latin America FOR PROFESSIONAL (non-retail) USE ONLY by SIEL.
Any questions you may have in relation to its contents should solely be directed to your Distributor. If you do not know who your Distributor is, then you cannot rely on any part of this document in any respect whatsoever.
SEI has not considered the suitability or appropriateness of any of the SEI UCITS Funds against your individual needs and risk tolerance. SEI shall not be liable for, and accepts no liability for, the use or misuse of this document by the Distributor. For all Distributors of the SEI UCITS Funds please refer to your sub-distribution agreement with SIEL before forwarding this information to your clients. It is the responsibility of every recipient to understand and observe applicable regulations and requirements in their jurisdiction. The Distributor is, amongst other things, responsible for ensuring that the Shares are only offered, and any literature relating to the SEI UCITS Funds (including this document) are only distributed, in jurisdictions where such offer and/or distribution would be lawful.
Issued in South Africa by SEI Investments (South Africa) (Pty) Ltd. FSP No. 13186 which is a financial services provider authorised and regulated by the Financial Sector Conduct Authority (FSCA). Registered office: 3 Melrose Boulevard, 1st Floor, Melrose Arch 2196, Johannesburg, South Africa.
A number of sub-funds of the SEI Global Master Fund plc and the SEI Global Investment Fund plc (the “SEI UCITS Funds”) have been approved for distribution in South Africa under s.65 of the Collective Investment Schemes Control Act 2002 as foreign collective investment schemes in securities. If you are unsure at any time as to whether or not a portfolio of SEI is approved by the Financial Sector Conduct Authority (“FSCA”) for distribution in South Africa, please consult the FSCA’s website (www.fsca.co.za).
Collective Investment Schemes (CIS) are generally medium to long term investments and investors may not get back the amount invested. The value of participatory interests or the investment may go down as well as up. SEI does not provide any guarantee either with respect to the capital or the return of an SEI UCITS Fund. The SEI UCITS Funds are traded at ruling prices and can engage in borrowing and scrip lending. A schedule of fees and charges and maximum commissions is available upon request from SEI. The SEI UCITS Funds invest in foreign securities. Please note that such investments may be accompanied by additional risks such as: potential constraints on liquidity and the repatriation of funds; macroeconomic, political/emerging markets, foreign currency risks, tax and settlement risks; and limits on the availability of market information.
This commentary is intended for information purposes only and the information in it does not constitute financial advice as contemplated in terms of the Financial Advisory and Intermediary Services Act.
Please refer to our latest Prospectus (which includes information in relation to the use of derivatives and the risks associated with the use of derivative instruments), Key Investor Information Document and the latest Annual or Semi-Annual Reports for more information on our funds, which can be located at Fund Documents.


