Monthly Market Commentary: Gravity-Defying Rally Trips on Tariff Tightrope
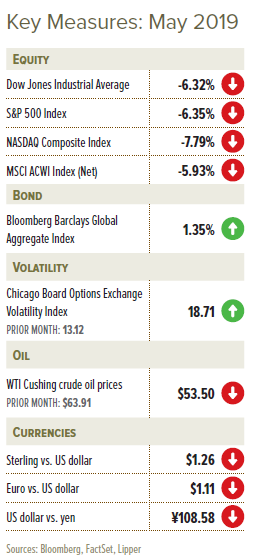
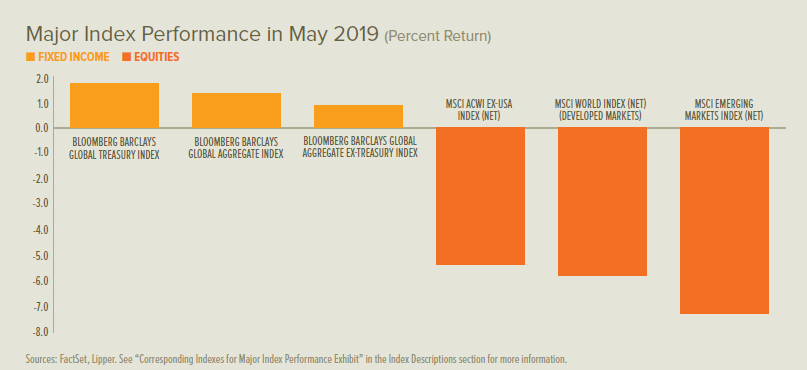
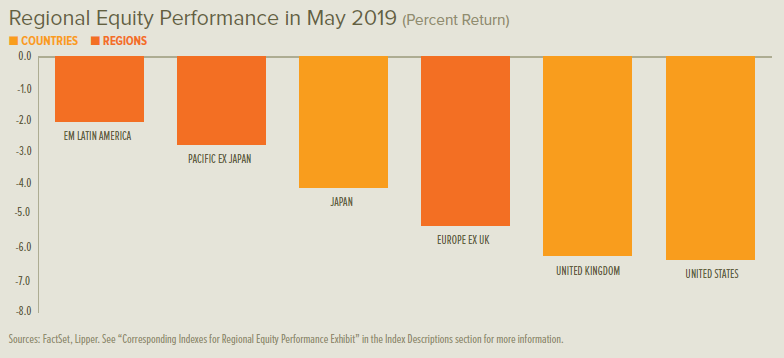
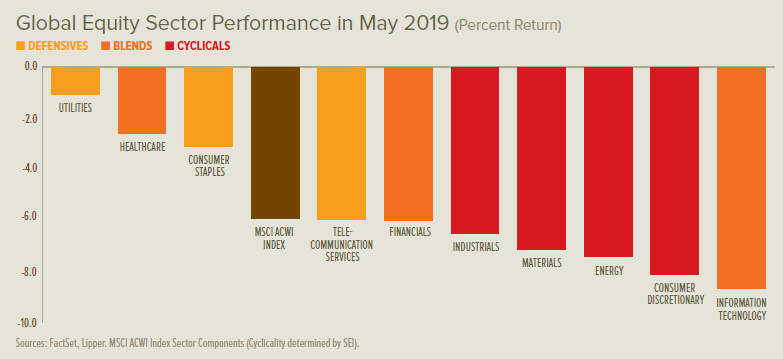
The early-year global rebound in stocks came to a halt during May. Emerging-market equities were hit hard, particularly China, and cyclical sectors around the globe tumbled sharply alongside oil prices. Government-bond yields declined in the UK, Europe and the US; the 3-month-to-10-year spread on US Treasurys turned negative again after briefly inverting in March, prompting renewed speculation about the reliability of this fairly dependable recession indicator.
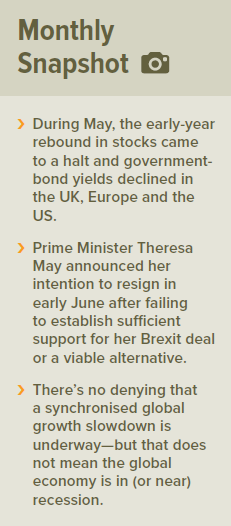
Prime Minister Theresa May announced on 24 May her intention to resign in early June following a poor showing for Conservatives in European Parliamentary elections. May’s inability to establish sufficient support for her Brexit deal or a viable alternative had become an impasse, and her recent overtures for a second referendum alienated a large subset of her party’s leadership. Since May’s announcement, more than a dozen candidates have announced plans to run as her replacement. Former foreign secretary and prominent Brexit proponent Boris Johnson was polling ahead of other candidates, offering campaign assurances that he would steer the UK out of the EU by the Brexit deadline of 31 October—with or without a deal.
Elections for European Parliament exposed support for centrist parties shifting toward more polarising alternatives on the left and right. Concerns about the impact of climate change bolstered the Green Party alliance, especially in Germany, where it outpaced the Social Democratic Party (which serves as the junior partner in Chancellor Angela Merkel’s coalition government). Euro-sceptic nationalist parties also fared well, particularly in France and Italy (where they earned a plurality of votes).
The US announced an escalation in tariffs on Chinese imports in early May as a trade delegation was headed to Washington, DC, and talks appeared to be in advanced stages. Tariffs on $200 billion of Chinese imports were increased from 10% to 25% (joining $50 billion of Chinese imports that have been taxed at 25% since 2018). The Office of the United States Trade Representative also proposed additional tariffs of 25% on the remaining $300 billion in US imports from China, which could take effect in the coming months. China responded with plans to raise the tariff rates on about $60 billion of imports from the US in June.
Elsewhere, the EU and Japan temporarily avoided tariffs on US imports of their automobiles. President Donald Trump opted to delay a decision on import taxes in favour of trade negotiations with a limited six-month window. Mexico and Canada were extended temporary relief from broadly-applied US tariffs on imports of their steel (at 25%) and aluminium (at 10%)
as the Trump administration prepared to seek Congressional approval of the United States–Mexico–Canada Agreement. The honeymoon was cut short for Mexico, however, with Trump’s late-month announcement that there will be 5% tariffs on all goods imported from the country beginning in June—until it stops illegal immigration across the southern US border. These immigration-linked tariffs are set to escalate by 5% on the first day of each subsequent month until reaching 25% in October.
The Bank of England’s Monetary Policy Committee and the US Federal Open Market Committee held their respective meetings at the beginning of May; both declined to adjust their policy paths. Neither the European Central Bank nor the Bank of Japan convened monetary policy meetings during May.
Economic Data
- UK manufacturing activity tipped slightly into contraction during May, as the respectable growth exhibited during April evaporated. Services sector activity remained modestly within growth territory. Labour-market conditions were firm in April, with the claimant-count UK unemployment rate holding at 3%; the broader January-to-March UK unemployment rate edged down to 3.8% (from 3.9%), while average year-over-year earnings growth eased to 3.2% (from 3.5%) in the three-month period.
- Eurozone manufacturing conditions contracted in May for the fourth straight month. Services sector activity continued to expand, albeit at a slower pace. The eurozone unemployment rate edged down to 7.6% in April, primarily thanks to a large decline in Spanish joblessness.
- US manufacturing and services growth continued to decelerate in May, representing a precipitous slowdown—especially the services sector, which was strongly expanding through the end of the first quarter. The US economy grew at a 3.1% annualised rate during the first quarter, based on a slight downward revision in the latest estimate.
SEI’s View
There’s no denying that a synchronised global growth slowdown is underway. However, it does not mean that the global economy is in (or near) recession. China and the UK, for example, are the second and fourth worst-performing countries, respectively, according to the Organisation for Economic Co-operation and Development’s composite leading indicators. Yet China continues to post gross domestic product growth in the vicinity of 6%, while the UK recorded an increase of 1.3% last year (both in inflationadjusted terms).
The spread between 3-month and 10-year US Treasurys turned convincingly negative in May after narrowing throughout much of the expansion. Recession historically occurs within 12 to 18 months of the yield curve either narrowing to 25 basis points or inverting. The only time recession did not follow a yield-curve inversion was in the 1966-to-1967 period—although US economic growth did slow dramatically.
Deeper recessions usually cause sharper share-price declines (as was the case in 1973). More expensive stock markets (as seen following the 1998- to-2000 tech bubble) also are more vulnerable. But the time between an initial yield-curve inversion and the emergence of a bear market can be extremely long.
By stressing patience and data dependence, the US Federal Reserve’s (Fed) change in rhetoric at the start of the year certainly has been a helpful catalyst in sparking the risk-asset rally and credit-spread narrowing. The Fed’s decision makers approvingly noted that the benefits of the long economic expansion are finally being distributed more evenly as the labour market tightens; they seem confident that the US economy can grow without generating worrisome inflationary pressures, even as most measures of labour-market activity point toward accelerating wage inflation.
We see plenty of opportunities in emerging equities as investors gain confidence that the worst is behind us for the asset class. But a sustained improvement depends on better global growth. In our view, China is the linchpin; we are optimistic that the country’s economic conditions will improve as it begins to feel the lagged impact of easier economic and monetary policies. We also expect domestic political pressures will likely force the Chinese government to ease further. Those political pressures certainly have influenced China’s trade discussions with the US. Meanwhile, Trump is grappling with similar pressures; he does not want the US economy to sputter or the US stock market to turn down as the country heads into a presidential election year. To put it bluntly, the leaders of both countries need a “win.”
While it may seem like a remote possibility today given the recent acrimony between the US and China, an expansive trade agreement would provide a much-needed boost to the Chinese economy. It also would benefit nations that have high export exposure to China, both directly and through the supply-chain network. MSCI Emerging Markets Index performance will depend on the economic fortunes of China, South Korea and Taiwan, which account for 54% of its market capitalisation as at 31 May, according to MSCI.
Investor pessimism about Europe appears overwhelming. The European Central Bank recently cut its forecast for 2019 eurozone gross domestic product growth to 1.1% from 1.7% just three months earlier. It’s a wonder that the year-to-date performance of European equities managed to nearly keep pace with that of US equities.
Many of Europe’s problems are structural and difficult to improve. Its demographic profile, for example, looks rather bleak. Europe is the only major region where the population is expected to contract between now and 2050. The unemployment rate for Europeans aged 25 to 29 is still in double digits (by comparison, the average annual unemployment rate in the US for this age group is approximately 4%). Of course, demographics alone do not explain Europe’s poor economic performance. A well-developed welfare state has its costs in the form of high taxation, extensive work rules, and regulations.
The shadow of a looming trade war with the US surely hasn’t helped sentiment in Europe. European autos appear safe from tariffs for the time being, but headline risks may continue to have negative impacts—and
it’s still possible that Trump will turn his full attention to trade with Europe once his administration concludes negotiations with China. Speaking of which, China’s slowdown is an additional factor behind the slide in Europe’s exports. Not only was European industrial production in decline for the 2018 calendar year, but it started this year 23% below its January 2008 level.
In our view, the best-case Brexit scenario is one in which the UK maintains close ties to the EU through a customs union. Failing that, now that voters have a better understanding of the costs and consequences of leaving, we think a second referendum either on Brexit alternatives or on Brexit itself makes sense. However, a referendum on reversing Brexit would risk further political upheaval given the number of people who still support the divorce. It would be nice to say that a no-deal Brexit is off the table, but it may have actually increased with Prime Minister May’s approaching resignation.
The uncertainty surrounding Brexit outcomes and timing remains a depressant for economic growth in the UK and the rest of Europe. Bottomup analysts expect UK earnings to decelerate to just 1.8% in 2019, which is in stark contrast with last year’s surprisingly strong rate of 10.9%.
The re-emergence of heightened volatility since the beginning of 2018 is a reminder that one should always expect the unexpected when it comes to investing. Cash was king in 2018, providing a 2.1% return. However, cash was consistently one of the worst performers in most other years going back to 2009. Emerging equities fell at the other end of the performance spectrum in 2018, sustaining a total-return loss of 14.6%—but was the strongest category in 2017 and posted a double-digit return in 2016.
In a world where the best- and worst-performing asset classes tend to dominate the headlines, it can be easy to forget that diversification has historically been the most reliable approach for meeting long-term investment goals—especially when looking through the lens of riskadjusted returns. While a diversified portfolio rarely wins from one year to the next, it also rarely loses—and therein lies its beauty.
Glossary of Financial Terms
Dovish: Dovish refers to the views of a policy advisor (for example, at the Bank of England) that are positive on inflation and its economic impact, and thus tends to favour lower interest rates.
Federal-funds rate: The federal-funds rate is the interest rate at which a depository institution lends immediately-available funds (balances at the US Federal Reserve) to another depository institution overnight in the US.
Price-to-earnings ratio: The price-to-earnings ratio is the ratio of a company’s share price to its earnings over the past 12 months; it can be is used to help determine whether a stock is undervalued or overvalued.
Quantitative easing: Quantitative easing refers to expansionary efforts by central banks to help increase the supply of money in the economy.
Yield curve: The yield curve represents differences in yields across a range of maturities of bonds of the same issuer or credit rating (likelihood of default). A steeper yield curve represents a greater difference between the yields. A flatter yield curve indicates that the yields are closer together.
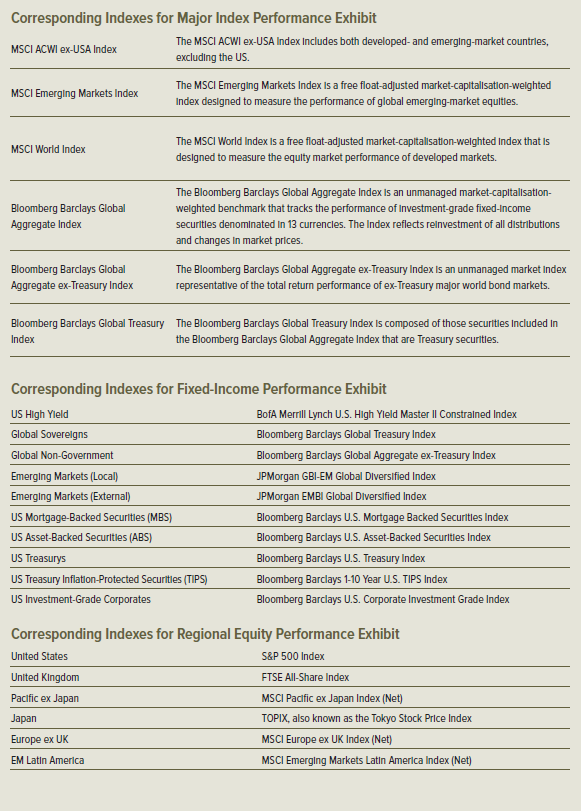
Index Descriptions
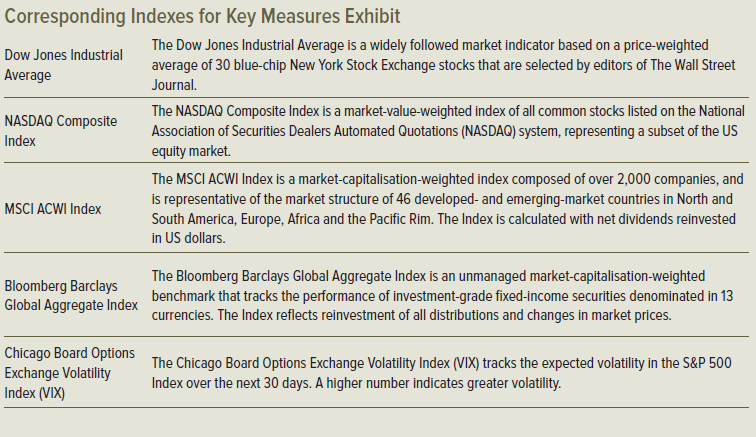
MSCI Emerging Markets Index: The MSCI Emerging Markets Index is a free float-adjusted market-capitalisation-weighted index designed to measure the performance of global emerging-market equities.
Important Information
Data refers to past performance. Past performance is not a reliable indicator of future results.
Investments in SEI Funds are generally medium- to long-term investments. The value of an investment and any income from it can go down as well as up. Investors may get back less than the original amount invested. Returns may increase or decrease as a result of currency fluctuations. Additionally, this investment may not be suitable for everyone. If you should have any doubt whether it is suitable for you, you should obtain expert advice.
No offer of any security is made hereby. Recipients of this information who intend to apply for shares in any SEI Fund are reminded that any such application may be made solely on the basis of the information contained in the Prospectus. This material represents an assessment of the market environment at a specific point in time and is not intended to be a forecast of future events, or a guarantee of future results. This information should not be relied upon by the reader as research or investment advice regarding the funds or any stock in particular, nor should it be construed as a recommendation to purchase or sell a security, including futures contracts.
In addition to the normal risks associated with equity investing, international investments may involve risk of capital loss from unfavourable fluctuation in currency values, from differences in generally accepted accounting principles or from economic or political instability in other nations. Bonds and bond funds are subject to interest rate risk and will decline in value as interest rates rise. High yield bonds involve greater risks of default or downgrade and are more volatile than investment grade securities, due to the speculative nature of their investments. Narrowly focused investments and smaller companies typically exhibit higher volatility. SEI Funds may use derivative instruments such as futures, forwards, options, swaps, contracts for differences, credit derivatives, caps, floors and currency forward contracts. These instruments may be used for hedging purposes and/or investment purposes.
While considerable care has been taken to ensure the information contained within this document is accurate and up-to-date, no warranty is given as to the accuracy or completeness of any information and no liability is accepted for any errors or omissions in such information or any action taken on the basis of this information.
This information is issued by SEI Investments (Europe) Limited, 1st Floor, Alphabeta, 14-18 Finsbury Square, London EC2A 1BR which is authorised and regulated by the Financial Conduct Authority. Please refer to our latest Full Prospectus (which includes information in relation to the use of derivatives and the risks associated with the use of derivative instruments), Key Investor Information Documents and latest Annual or Semi-Annual Reports for more information on our funds. This information can be obtained by contacting your Financial Adviser or using the contact details shown above.
SEI sources data directly from FactSet, Lipper, and BlackRock, unless otherwise stated.
The opinions and views in this commentary are of SEI only and should not be construed as investment advice.


