Monthly Market Commentary: Global equity markets get in the mix amid volatility.
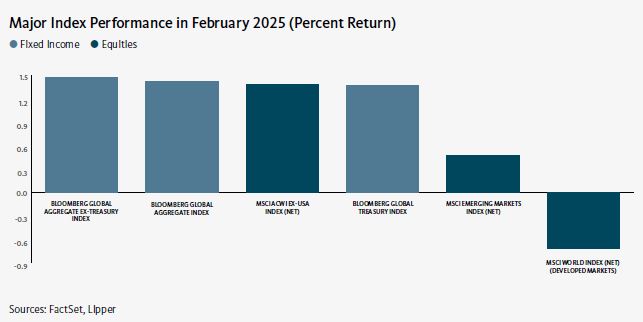
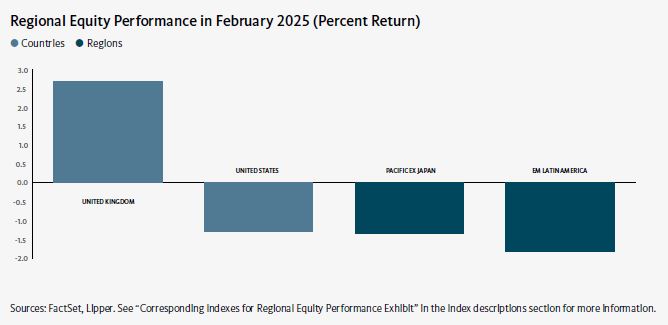
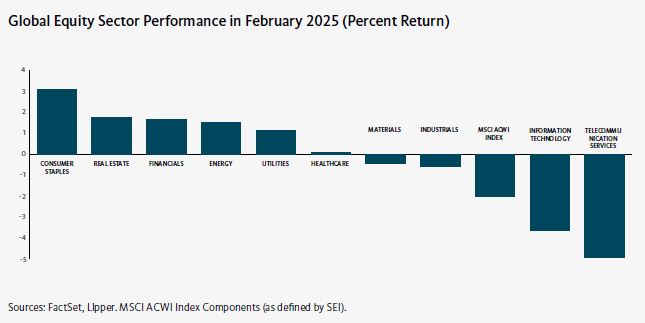
Global equity markets, as measured by the MSCI ACWI Index, lost ground in February, though performance was mixed among regions. Despite a decline towards the end of the month in response to President Trump’s threat to impose tariffs on imported goods from the European Union (a political and economic union of 27 European countries), the European market generally benefited from investors’ optimism that the region would avoid a trade war with the U.S. Uncertainty regarding the proposed tariffs and a downturn in the technology sector hampered the U.S. equity market.
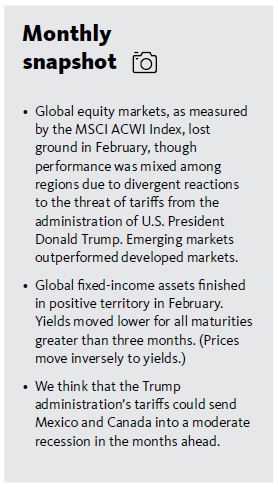
Emerging markets garnered modestly positive returns and outperformed their developed-market counterparts in February. The Nordic countries were the strongest performers within the developed markets for the month, bolstered mainly by strength in Sweden and Denmark. The rally in Europe was attributable primarily to upturns in Ireland and Spain. Conversely, North America was hampered by a decline in the U.S. market. Chinese stocks listed on the Hong Kong Stock Exchange led the emerging markets in February. Additionally, Eastern Europe benefited from strong performance in Poland. In contrast, the Association of Southeast Asian Nations (ASEAN) region recorded a negative return due to weakness in Thailand and Indonesia.
On February 3, a day before 25% across-the-board tariffs on Mexico and Canada (with an exception for Canadian energy, which faces a 10% duty) were scheduled to be implemented, the Trump administration reached agreements with Canada and Mexico to delay the levies for 30 days. This was only after Mexico agreed to send 10,000 troops to the border to combat the flow of fentanyl into the U.S., and Canada pledged to appoint a fentanyl czar, list cartels as terrorists, and launch a joint strike force with the U.S. to combat organised crime, fentanyl trafficking, and money laundering. At the end of February, Trump announced that he was considering 25% tariffs on imports from the European Union. He also commented that the levies against Mexico and Canada were still scheduled to take effect in early March. The ongoing tariff dispute remains highly volatile and in constant flux.
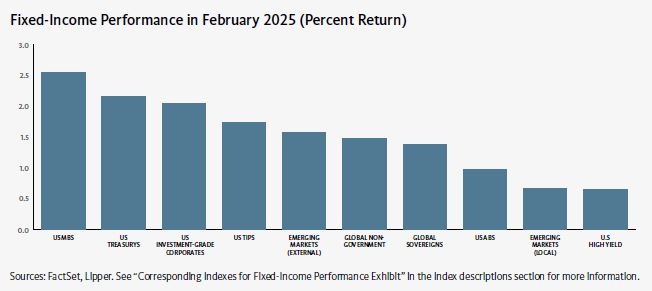
Global fixed-income assets, as measured by the Bloomberg Global Aggregate Bond Index (USD), gained 1.4% in February. Mortgage-backed securities (MBS) were the strongest performers within the U.S. fixed-income market, followed by U.S. Treasury securities, investment-grade corporate bonds, and high-yield bonds. Yields moved lower for all maturities greater than three months. Yields on 2-, 3, 5, and 10-year Treasury notes fell by corresponding margins of 0.23% and 0.28%, 0.33, and 0.24% to 3.99%, 3.99%, 4.03%, and 4.34%, respectively.2 The decline in the yield on the 10-year Treasury resulted in an inverted yield curve (three-month yields exceeded 10-year yields), which historically has predicted economic recessions.
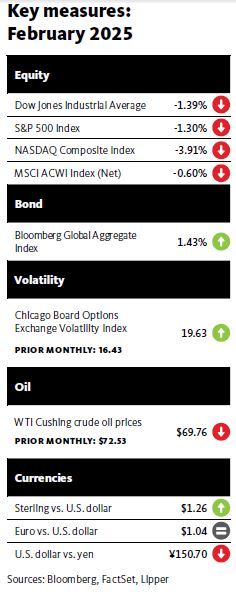
Global commodity prices, as represented by the Bloomberg Commodity Index, rose 0.8% in February. The West Texas Intermediate (WTI) and Brent crude oil prices posted fell by corresponding margins of 3.8% and 5.4% to $69.76 and $71.62, respectively, over the month due to concerns about geopolitical tensions between the U.S. and Ukraine, as well as a possible increase in oil production by the Organization of the Petroleum Exporting Countries (OPEC). (In early March, the oil cartel announced plans for a production increase in April.) The gold price rallied for most of the month as investors sought safe-haven assets amid concerns about the Trump administration’s proposed tariffs. However, a sharp decline in the price in late February attributable to U.S. dollar strength—the gold price typically moves inversely to the greenback—trimmed the monthly gain to 0.5%. The New York Mercantile Exchange (NYMEX) natural gas price surged 26.0% during the month as cold winter weather in the U.S. spurred an increase in demand. Wheat prices dipped 0.7% in February, hampered by strong production from Australia and Argentina, as well as reduced imports from China. These offset the positive impact of a decrease in stockpiles in the U.S.
On the geopolitical front, the Trump administration sought to enter into negotiations to end the Russia-Ukraine conflict after the president spoke with Russian President Vladimir Putin. Trump subsequently extended an invitation to Ukrainian President Volodymyr Zelenskyy to participate in negotiations with Putin for a ceasefire in the war. Toward the end of February, Trump and Zelenskyy agreed to a deal that would give the U.S. access to deposits of Ukraine’s rare earth minerals. The agreement included the establishment of an “investment fund” for Ukraine’s reconstruction. However, the deal appeared to be in jeopardy after Trump cut short a meeting with Zelenskyy at the White House on February 28, following a heated discussion regarding a possible settlement of the Russia-Ukraine conflict.
Economic data
U.S.
The Department of Labor announced that the consumer-price index (CPI) posted a greater-than-expected advance of 0.5% in January, slightly higher than the 0.4% increase in December. Housing costs comprised more than 30% of the upturn in inflation, gaining 0.4% during the month. Food costs also were up 0.4% in January, led by a 15.2% surge in egg prices. The 3.0% year-over-year advance in the CPI was up marginally from the 2.9% annual rise in December. Costs for transportation services and housing climbed 8.0% and 4.4%, respectively, over the previous 12-month period, while commodity prices dipped 0.1%. Core inflation, as measured by the CPI for all items less food and energy, rose 3.3% year-over-year in January, an uptick from the 3.2% annual increase in December.
According to the second estimate from the Department of Commerce, U.S. gross domestic product (GDP) grew at an annualised rate of 2.3% in the fourth quarter of 2024—unchanged from the initial estimate and down from the 3.1% increase in the third quarter. The U.S. economy expanded by 2.5% for the 2024 calendar year, lagging the 3.2% annual gain in 2023. The largest contributors to GDP growth for the fourth quarter included consumer spending and federal government spending. This was partially offset by a decline in nonresidential fixed investment (purchases of both nonresidential structures and equipment and software).
U.K.
The Office for National Statistics (ONS) reported that inflation in the U.K., as measured by the CPI, dipped 0.1% in January, sharply lower than the 0.3% rise in December. The CPI advanced at an annual rate of 3.0% in January, up significantly from the 2.5% increase for the previous month. Costs for education and alcohol and tobacco posted the largest gains in January, while clothing and footwear, and furniture and household goods prices declined. Education, communication, and health care costs rose 7.5% 5.9%, and 5.0% respectively, year-over-year. Core inflation, which excludes volatile food, energy, and alcohol and tobacco prices, rose by an annual rate of 3.7% in January, exceeding the 3.2% year-over-year increase in December.
The ONS also announced that U.K. GDP grew 0.4% in December, and edged up 0.1% over previous three months (the most recent reporting periods). The increase in GDP for December was an improvement from the 0.1% uptick in November. Output in the construction and services sectors rose 0.5% and 0.2%, respectively, for the three-month period ending December 31, while production output fell 0.8%.
Eurozone
Eurostat pegged the inflation rate for the eurozone at 2.5% for the 12-month period ending in January, marginally higher than the 2.4% annual upturn in December. Costs in the services sector rose at an annual rate of 3.9%, slightly below the 4.0% increase in December. Prices for food, alcohol and tobacco increased 2.3% year-over-year in January, down from the 2.6% annual rate for the previous month. Core inflation, which excludes volatile energy and food prices, increased at an annual rate of 2.7% for the fifth consecutive month in January.
Eurostat also reported that eurozone GDP edged up 0.1% the fourth quarter of 2024, weakening from the 0.4% increase in the third quarter. The eurozone economy expanded by 0.7% year-over-year—down modestly from the 0.9% annual growth rate for the previous quarter. The economies of Portugal, Poland, and Lithuania were the strongest performers for the fourth quarter, growing 1.5%, 1.3%, and 0.9%, respectively. In contrast, GDP in Ireland and Germany saw corresponding declines of 1.3% and 0.2% during the quarter.
SEI’s view
We think that the Trump administration’s tariffs could send Mexico and Canada into a moderate recession in the months ahead given their high dependence on the U.S. market. The U.S. could sustain a sharp deceleration of growth and may even experience a pullback in industrial output given the extent of economic integration with its two major trading partners. A broadening of the trade war to include Europe and Asia would further depress economic growth, but on a global scale. In the near-term, supply-chain disruptions and retaliatory actions could increase U.S. inflation beyond 3%. Canada’s economy, already struggling before the imposition of tariffs, should see a further slowing of its inflation rate. Monetary policy across the developed world was already diverging, with interest rates falling more in Canada and the Eurozone than in the U.S. An expanding trade war would exacerbate this trend. Monetary policy divergence also implies a further strengthening of the U.S. dollar.
We see too many potential outcomes leading to a reacceleration in inflation and higher long-term interest rates. The yield on the 10-year U.S. Treasury is our guide for 2025. We will become concerned about equity markets once the yield reaches 5%, as tighter financial conditions may begin to weigh on growth prospects.
We maintain our strategic recommendations for investors to stay diversified globally and focus on profitable companies with strong earnings momentum trading at reasonable prices. Given our views on the likelihood of higher interest rates and heightened volatility, we continue to lean into value and active management across our equity strategies. We favour sectors such as financials, industrials, and staples.
Within fixed-income markets, we remain cautious on interest rates and sanguine on credit. We believe the Fed is still biased toward lower rates (although the central bank left the federal-funds rate unchanged in January) despite core consumer price index and gross domestic product readings both above 3%. In addition, the reality of tariffs and immigration reforms may add additional fuel to the inflation fire. Consequently, we see headwinds for fixed-income returns. On a more positive note, while credit spreads have limited room to tighten, absolute yields remain attractive, defaults remain low, and maturities have been extended.
Glossary of Financial Terms
Yield is the income returned on an investment, such as the interest received from holding a security. The yield is usually expressed as an annual percentage rate based on the investment’s cost, current market value, or face value.
Yield curve represents differences in yields across a range of maturities of bonds of the same issuer or credit rating (are (which is used to assess the risk of default of companies or countries). A steeper yield curve represents a greater difference between the yields. A flatter curve indicates that short- and long-term yields are closer together.
Monetary policy refers to decisions by central banks to influence the amount of money and credit in the economy by managing the level of benchmark interest rates and the purchase or sale of securities. Central banks typically make policy decisions based on their mandates to target specific levels or ranges for inflation and employment.
Index definitions
All indexes are quoted in gross performance unless otherwise indicated.
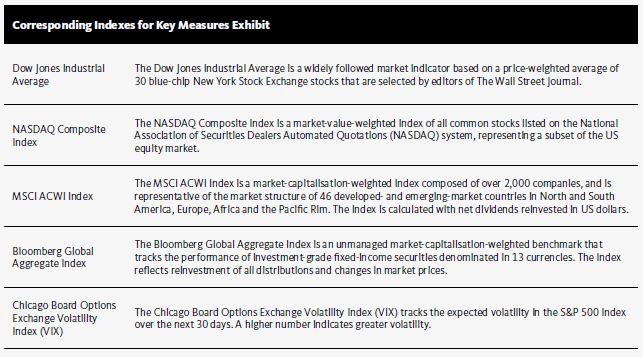
The MSCI ACWI Index is a market capitalization-weighted index that tracks the performance of over 2,000 companies, and is representative of the market structure of 48 developed and emerging-market countries in North and South America, Europe, Africa, and the Pacific Rim. The index is calculated with net dividends reinvested in U.S. dollars.
The S&P 500 Index is a market-weighted index that tracks the performance of the 500 largest publicly traded U.S. companies and is considered representative of the broad U.S. stock market.
The Bloomberg Global Aggregate Bond Index is a market capitalization-weighted index that tracks the performance of investment grade (rated BBB- or higher by S&P Global Ratings/Fitch Ratings or Baa3 or higher by Moody’s Investors Service) fixed-income securities denominated in 13 currencies. The index reflects reinvestment of all distributions and changes in market prices.
The S&P US Mortgage Backed Securities Index tracks the performance of U.S. dollar-denominated, fixed-rate and adjustable-rate/ hybrid mortgage pass-through securities issued by Ginnie Mae (GNMA), Fannie Mae (FNMA) and Freddie Mac (FHLMC).
The ICE BofA U.S. Corporate Index includes publicly issued, fixed-rate, nonconvertible investment-grade (rated BBB- or higher by S&P Global Ratings and Fitch Ratings or Baa3 or higher by Moody’s Investors Service) dollar-denominated, U.S. Securities and Exchange (SEC)-registered corporate debt having at least one year to maturity.
The ICE BofA U.S. High Yield Constrained Index is a market value-weighted index of all domestic and Yankee high-yield bonds, including deferred interest bonds and payment-in-kind securities, with maturities of one year or more and a credit rating of BB+ or lower by S&P Global Ratings and Fitch Ratings or Ba1 or lower by Moody’s Investors Service, but are not in default.
The ICE BofA U.S. Treasury Index tracks the performance of the direct sovereign debt of the U. S. government.
The Bloomberg Commodity Total Return Index comprises futures contracts and tracks the performance of a fully collateralized investment in the index. This combines the returns of the index with the returns on cash collateral invested in 13-week (three-month) U.S. Treasury bills.
Consumer-price indexes measure changes in the price level of a weighted-average market basket of consumer goods and services purchased by households. A consumer price index is a statistical estimate constructed using the prices of a sample of representative items whose prices are collected periodically.
Important Information
This material represents an assessment of the market environment at a specific point in time and is not intended to be a forecast of future events or a guarantee of future results. Positioning and holdings are subject to change. All information as of the date indicated.
This information should not be relied upon by the reader as research or investment advice, (unless you have otherwise separately entered into a written agreement with SEI for the provision of investment advice) nor should it be construed as a recommendation to purchase or sell a security. The reader should consult with their financial professional for more information. Statements that are not factual in nature, including opinions, projections and estimates, assume certain economic conditions and industry developments and constitute only current opinions that are subject to change without notice. Nothing herein is intended to be a forecast of future events, or a guarantee of future results.
Certain economic and market information contained herein has been obtained from published sources prepared by other parties, which in certain cases have not been updated through the date hereof. While such sources are believed to be reliable, neither SEI nor its affiliates assumes any responsibility for the accuracy or completeness of such information and such information has not been independently verified by SEI.
There are risks involved with investing, including loss of principal. The value of an investment and any income from it can go down as well as up. Investors may get back less than the original amount invested. Returns may increase or decrease as a result of currency fluctuations. Past performance is not a reliable indicator of future results. Investment may not be suitable for everyone.
This material is not directed to any persons where (by reason of that person's nationality, residence or otherwise) the publication or availability of this material is prohibited. Persons in respect of whom such prohibitions apply must not rely on this information in any respect whatsoever.
The information contained herein is for general and educational information purposes only and is not intended to constitute legal, tax, accounting, securities, research or investment advice regarding the strategies or any security in particular, nor an opinion regarding the appropriateness of any investment. This information should not be construed as a recommendation to purchase or sell a security, derivative or futures contract. You should not act or rely on the information contained herein without obtaining specific legal, tax, accounting and investment advice from an investment professional. While considerable care has been taken to ensure the information contained within this document is accurate and up-to-date, no warranty is given as to the accuracy or completeness of any information and no liability is accepted for any errors or omissions in such information or any action taken on the basis of this information.
Index returns are for illustrative purposes only, and do not represent actual account performance. Index returns do not reflect any management fees, transaction costs or expenses. Indexes are unmanaged and one cannot invest directly in an index. Not all strategies discussed may be available for your investment.
Information issued in the UK by SEI Investments (Europe) Ltd, 1st Floor, Alphabeta, 14-18 Finsbury Square, London EC2A 1BR which is authorised and regulated by the Financial Conduct Authority.
The contents of this document have not been reviewed by any regulatory authority in Hong Kong. You are advised to exercise caution in relation to the offer. If you are in any doubt about any of the contents of this document, you should obtain independent professional advice.
This information is made available in Latin America and the Middle East FOR PROFESSIONAL (non-retail) USE ONLY by SIEL.
Any questions you may have in relation to its contents should solely be directed to your Distributor. If you do not know who your Distributor is, then you cannot rely on any part of this document in any respect whatsoever.
Issued in South Africa by SEI Investment (South Africa) (Pty) Limited FSP No. 13186 which is a financial services provider authorised and regulated by the Financial Sector Conduct Authority (FSCA). Registered office: 3 Melrose Boulevard, 1st Floor, Melrose Arch 2196, Johannesburg, South Africa.
SIEL is not licensed under Israel’s Regulation of Investment Advising, Investment Marketing and Portfolio Management Law, 5755-1995 (the “Advice Law”) and does not carry insurance pursuant to the Advice Law. This document and any of the SEI Funds mentioned herein have not been approved by the Israeli Securities Authority (the “ISA”).
This material is intended for information purposes only and the information in it does not constitute financial advice as contemplated in terms of the Financial Advisory and Intermediary Services Act.
For professional clients only. Not suitable for retail distribution.


