Monthly Market Commentary : Equity markets go to extremes but come out ahead.
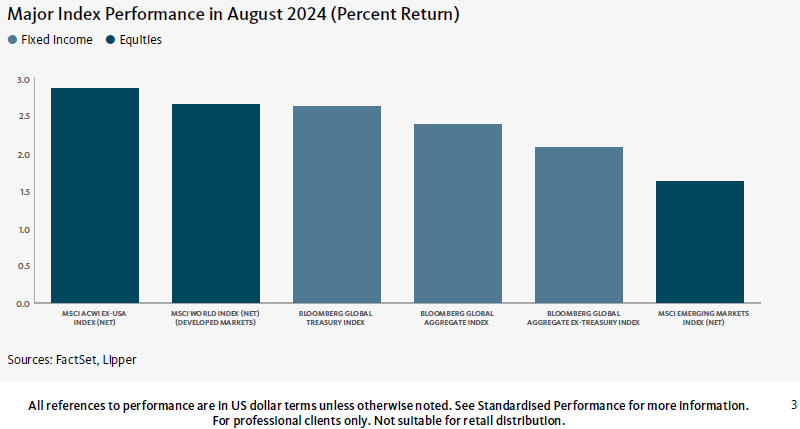
Global equity markets recorded positive returns in August amid periods of volatility, particularly at the beginning and end of the month. Developed stock markets outperformed their emerging-market counterparts. The markets slumped in early August on growing recession worries due to relatively weak U.S. economic data and the Fed’s decision not to cut the federal-funds rate following its meeting at the end of July. Additionally, the PHLX Semiconductor Sector Index™, which tracks the performance of the 30 largest U.S.-listed semiconductor companies, fell more than 7% on August 1—its worst one-day percentage decline since March 2020—after Arm Holdings, a U.K.-based chipmaker, issued disappointing earnings guidance for the remaining three quarters of its 2025 fiscal year. This led to concerns that significant spending on artificial intelligence (AI) computing will not benefit several U.S.-based mega-cap companies as much as previously expected. Stock prices subsequently rallied later in the month as investors were encouraged by relatively weaker labour market data and signs of slowing inflation, which boosted optimism that Fed remains on schedule to cut interest rates in September.
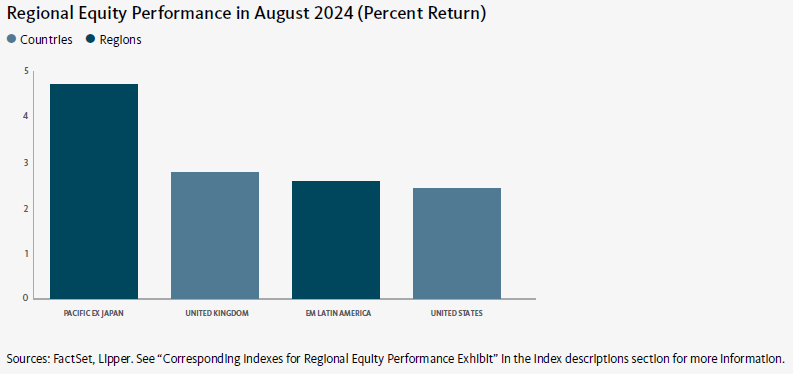
The Nordic countries were the strongest performers among developed markets in August, led by Finland and Sweden. Europe also performed well due mainly to strength in Spain, Italy, and Switzerland. The Far East registered a relatively smaller gain and was the primary market laggard, attributable largely to underperformance in Japan. The Association of Southeast Asian Nations (ASEAN) comprised the top-performing emerging market in August, bolstered mainly by strength in the Philippines, Indonesia, and Malaysia. Conversely, the Latin America ex Brazil and Europe regions were the weakest emerging-market performers for the month, hampered primarily by weakness in Mexico and Turkey, respectively.1
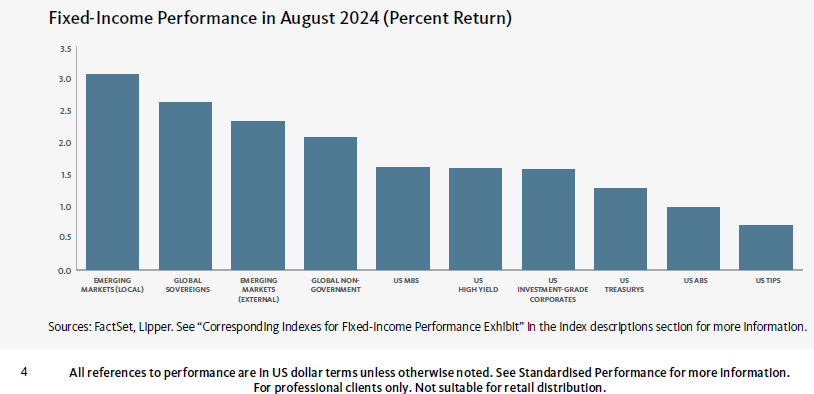
Global fixed-income assets, as measured by the Bloomberg Global Aggregate Bond Index, gained 1.4% in August. High-yield bonds were the strongest performers within the U.S. fixed-income market, followed by mortgage-backed securities (MBS), investment-grade corporate bonds, and U.S. Treasury securities. Treasury yields moved lower across the curve. Yields on 2-, 3-, 5- and 10-year Treasury notes fell by corresponding margins of 0.38%, 0.31%, 0.26%, and 0.18%, ending the month at 3.91%, 3.79%, 3.71%, and 3.91%, respectively.2 The spread between 10- and 2-year notes narrowed 20 basis points in August, resulting in a flat yield curve (which occurs when there is little or no difference between 10- and 2-year yields) at month-end—marking the first time in more than two years that the yield curve was not inverted at the market’s close. A flat yield curve generally is viewed as a sign of uncertainty about future economic growth.
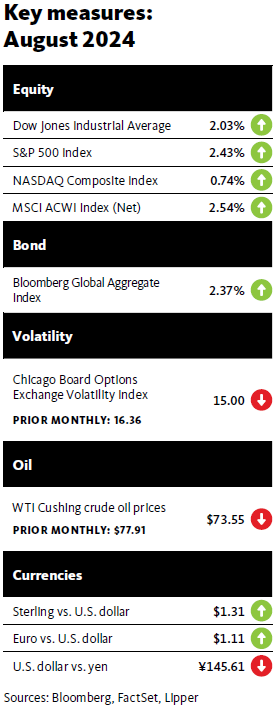
Global commodity prices, as measured by the Bloomberg Commodity Total Return Index, saw an uptick of 0.1% during the month. The West Texas Intermediate (WTI) and Brent crude oil prices declined 3.6% and 4.8%, respectively, amid concerns that China’s slowing economy could hamper demand for oil. The New York Mercantile Exchange (NYMEX) natural gas price rose 4.5% in August. Most of the upturn occurred in the first three weeks of the month due to an increase in demand for natural gas-generated electricity spurred by unusually hot weather in much of the U.S. Relatively cooler temperatures led to declining demand later in August. The gold spot price was up 2.2% during the month, benefiting from growing confidence that the Fed will begin to cut interest rates this month, as well as weakness in the U.S. dollar. (The gold price generally moves inversely to the U.S. dollar.) Wheat prices surged 4.6% over the month due to increased demand and concerns about hot and dry weather in the U.S. Northern Plains, which could lead to a decrease in supply.
During an appearance at the Kansas City Fed’s annual Jackson Hole Economic Symposium in Wyoming on August 23, Fed Chair Jerome Powell signaled that interest-rate cuts are imminent. “The time has come for policy to adjust,” he said. “The direction of travel is clear, and the timing and pace of rate cuts will depend on incoming data, the evolving outlook, and the balance of risks.” Powell commented that the Fed’s restrictive monetary policy “helped restore balance between aggregate supply and demand, easing inflationary pressures and ensuring that inflation expectations remained well anchored.”
At the end of August, the CME Group’s Fed Watch Tool implied a 70% chance that the central bank will implement a 25-basis-point rate cut following its meeting on September 17-18, and indicated a 30% probability of a 50-basispoint reduction.3 The Fed Watch Tool provides a gauge of the markets’ expectations of potential changes to the federal-funds target rate while assessing potential Fed monetary policy actions at Federal Open Market Committee (FOMC) meetings.
Economic data
U.S.
The Department of Labor reported that the consumer-price index (CPI) rose 0.2% in July, following a 0.1% dip in June. The 2.9% year-over-year advance in the index was marginally lower than the 3.0% annual rise in June, and represented the smallest annual increase since March 2021. Housing costs were up 0.4% in July—comprising nearly 90% of the upturn in the CPI for the month—and increased 5.1% versus the same period in 2023. Prices for used cars and trucks declined 2.2% and 10.9% in July and over the previous 12-month period, respectively. Gasoline prices were flat in July and fell 2.2% year-over-year. The 3.2% rolling 12-month rise in core inflation in July, as measured by the CPI for all items less food and energy, was down 0.1 percentage point from the 3.3% annual rise for the previous month, and was the smallest year-over-year increase since April 2021.
According to the second estimate from the Department of Commerce, U.S. gross domestic product (GDP) increased at an annualised rate of 3.0% in the second quarter of 2024—up slightly from the government’s initial estimate of 2.8% and more than doubling the 1.4% rise in the first quarter of the year. The largest contributors to GDP growth for the second quarter included consumer spending, private inventory investment (a measure of the changes in values of inventories from one time period to the next), and nonresidential fixed investment (purchases of both nonresidential structures and equipment and software). Imports, which are subtracted from GDP, increased over the quarter. The government attributed the higher GDP growth rate in the second quarter relative to the previous three-month period to upturns in private inventory investment and consumer spending.
U.K.
The Office for National Statistics (ONS) reported that inflation in the U.K., as measured by the CPI, dipped 0.2% in July, down from the 0.1% increase in June. The CPI rose by a lower-than-expected annual rate of 2.2%, up slightly from the 12-month upturn of 2.0% for the previous month. The largest contributor to the year-over-year rise in inflation included costs for housing and household services prices (mainly gas and electricity), which more than offset declines in prices for restaurants and hotels. Core inflation, which excludes volatile food prices, rose at an annual rate of 3.3% in July, down from the 3.5% year-over-year increase in June.4
According to the second estimate of the ONS, U.K. GDP was flat in June (the most recent reporting period), following a 0.4% growth rate in May. The economy expanded 0.6% for the three-month period ending June 30. Output in the services sector rose 0.8% over the three-month period, while production and construction output each dipped 0.1%.5
Eurozone
Eurostat pegged the inflation rate for the eurozone at 2.2% for the 12-month period ending in August, a decline from the 2.6% annual increase in July. Costs in the services sector rose 4.2% for the period, up from the 4.0% annual gain in July. Prices for food, alcohol and tobacco increased 2.4% year-over-year in August, marginally higher than the 2.3% annual rate for the previous month. Non-energy industrial goods increased 0.4% over the previous 12 months, down from the 0.7% annual rise in July, while energy prices fell 3.0% following a 1.2% year-over-year rise in July. Core inflation, which excludes volatile energy and food prices, increased at an annual rate of 2.8% in August, slightly lower than the 2.9% year-over-year upturn in July.6
Eurostat also reported that eurozone GDP edged up 0.3% in the second quarter of 2024, matching the growth rate in the first quarter, and grew 0.6% year-over-year. The economies of Poland, Ireland, and the Netherlands were the strongest performers for the second quarter, expanding 1.5%, 1.2%, and 1.0%, respectively. Conversely, GDP in Latvia and Sweden declined by corresponding margins of 1.1% and 0.8% during the month.7
Central banks
According to minutes from the Federal Open Market Committee’s (FOMC) July 30-31 meeting, released on August 21, members concurred that recent economic data might have warranted an immediate reduction in the federal funds rate. The meeting participants noted that “inflation had eased over the past year but remained elevated and that, in recent months, there had been some further progress toward the Committee’s 2 percent inflation objective.” Consequently, several FOMC members “observed that the recent progress on inflation and increases in the unemployment rate had provided a plausible case for reducing the target range 25 basis points at this meeting or that they could have supported such a decision.”
By a slim 5-4 margin, the Bank of England (BOE) voted to reduce the Bank Rate by 25 basis points to 5.00% at its meeting on August 1. Four BOE Monetary Policy Committee (MPC) members voted to maintain the Bank Rate at 5.25%. In its announcement of the rate decision, the MPC commented, “It is now appropriate to reduce slightly the degree of policy restrictiveness. The impact from past external shocks has abated and there has been some progress in moderating risks of persistence in inflation. Although GDP has been stronger than expected, the restrictive stance of monetary policy continues to weigh on activity in the real economy, leading to a looser labour market and bearing down on inflationary pressures.” The next MPC meeting is scheduled for September 19.
The European Central Bank (ECB) left its benchmark interest rate unchanged at 4.25% following its meeting on July 24, but hinted that there could be a rate cut in September. The ECB reduced its benchmark interest rate by 25 basis points in early June—its first cut since 2019. During a news conference following the July meeting, ECB President Christine Lagarde commented, “So the question of September and what we do in September is wide open.” In a statement announcing the rate decision, the ECB’s Governing Council noted, “While some measures of underlying inflation ticked up in May owing to one-off factors, most measures were either stable or edged down in June. In line with expectations, the inflationary impact of high wage growth has been buffered by [corporate] profits.” The next ECB meeting will be held on September 12 in Frankfurt, Germany.
The Bank of Japan (BOJ) raised its benchmark interest rate from a range of 0.0%-0.1% to 0.25%—the highest level since 2008— after its meeting on July 29-30, and BOJ Governor Kazuo Ueda indicated that the central bank could implement another rate hike before the end of 2024. During a news conference following the announcement of the rate increase, Ueda said, “If data shows economic conditions are on track, and if such data accumulates, we would of course take the next step.” However, in early August, BOJ Deputy Gov. Shinichi Uchida said that the country’s economic environment is not similar to that in the U.S. and Europe in 2022 and 2023, when rising inflation led central banks to implement numerous rate hikes. “Therefore, the bank will not raise its policy interest rate when financial and capital markets are unstable,” Uchida commented.8
SEI’s view
While it is understandable that investors were concerned over the extreme volatility in the market in August, SEI manages its portfolios for the long term. We remain focused on strategic asset allocation and prudent, thoughtful portfolio management through the market’s ups and downs. This seemed to be an overreaction that was exacerbated by the unwinding of carry trades—in which investors borrow at low interest rates (such as Japan) to invest in higher-yielding assets (including U.S. Treasurys or stocks) following the Bank of Japan’s rate hike in late July—as well as a reevaluation of equity positions in artificial intelligence. We continue to expect that the global economy will avoid recession in the near term, and we remain focused on longer-term trends as opposed to shorter-term variations in the economic data.
Today’s equity market dynamics remind us that diversifying exposures across geographies, sectors, factors and individual companies are as important as ever for investors, and we remain committed to this foundational principle. This is particularly acute for passive investors who, at this stage of the cycle (concentrated and expensive), may want to begin diversifying into actively managed strategies. We continue to view both concentration and valuation as concerning for U.S. equity investors. We believe the current size and future growth expectations of the top names set the bar exceedingly high even for the most stellar companies in the most transformative industries.
Despite the recent slowdown, inflation remains somewhat elevated, with core CPI running 3.2% year-over-year as of July. The labour market still appears to be on the tight side, and nominal wage growth remained relatively high through the first quarter; real wages, however, are finally rising owing to the lower inflation rate. We expect nominal wages to continue to post more moderate gains in the third quarter.
The eurozone economy looks to be accelerating modestly following a year of stagnation and mild recession, but the recovery still appears rather tentative. We think that the recent strengthening of the euro against the U.S. dollar, were it to be sustained, improves the chances of another rate cut by the ECB in September. The outcomes of the recent parliamentary election in the European Union (EU) and the National Assembly election in France aren’t expected to prevent a modest easing of policy rates, as long as inflation continues to moderate. It may, however, limit the decline in longer-term sovereign bond yields, as investors price in the impact of higher-for-longer fiscal deficits, especially in France. SEI emphasises that a return to 0% and negative policy rates in the eurozone is highly unlikely in the years ahead, even against a recessionary backdrop.
Glossary of Financial Terms
The federal-funds rate is the interest rate charged to lending institutions on unsecured overnight loans. It is set by the U.S. Federal Reserve’s Federal Open Market Committee. The rate is increased when the Federal Reserve wants to discourage borrowing and slow the economy and decreased when the Federal Reserve wants to spur economic growth.
Yield is the income returned on an investment, such as the interest received from holding a security. The yield is usually expressed as an annual percentage rate based on the investment’s cost, current market value, or face value.
Yield curve represents differences in yields across a range of maturities of bonds of the same issuer or credit rating (are (which is used to assess the risk of default of companies or countries). A steeper yield curve represents a greater difference between the yields. A flatter curve indicates that short- and long-term yields are closer together.
A flat yield curve occurs when there is little or no spread between short- and long-term yields. A flat yield curve generally is viewed as a sign of uncertainty about future economic growth.
An inverted yield curve occurs when short-term yields exceed long-term yields. While an inverted yield curve historically has predicted economic recessions, it is an indicator—not a forecast.
Monetary policy refers to decisions by central banks to influence the amount of money and credit in the economy by managing the level of benchmark interest rates and the purchase or sale of securities. Central banks typically make policy decisions based on their mandates to target specific levels or ranges for inflation and employment.
Index Descriptions
All indexes are quoted in gross performance unless otherwise indicated.
The PHLX Semiconductor Sector Index™ tracks the performance of the 30 largest U.S.-listed semiconductor companies.
The MSCI ACWI Index is a market capitalization-weighted index that tracks the performance of over 2,000 companies, and is representative of the market structure of 48 developed and emerging-market countries in North and South America, Europe, Africa, and the Pacific Rim. The index is calculated with net dividends reinvested in U.S. dollars.
The Bloomberg Global Aggregate Bond Index is a market capitalization-weighted index that tracks the performance of investment-grade (rated BBB- or higher by S&P Global Ratings/Fitch Ratings or Baa3 or higher by Moody’s Investors Service) fixed-income securities denominated in 13 currencies. The index reflects reinvestment of all distributions and changes in market prices.
The Bloomberg US High Yield Index tracks the performance of fixed-rate, publicly issued, non-investment-grade (rated BB+ or lower by S&P Global Ratings and Fitch Ratings or Ba1 or lower by Moody’s Investors Service) bonds.
The Bloomberg US Treasury Index tracks the performance of fixed-rate, nominal debt issued by the US Treasury.
The Bloomberg US Mortgage Backed Securities Index tracks the performance of fixed-rate agency mortgage-backed securities (MBS) guaranteed by the Government National Mortgage Association (GNMA), Federal National Mortgage Association (FNMA), and Freddie Mac (FHLMC).
The Bloomberg US Corporate Investment Grade Index tracks the performance of the investment-grade, fixed-rate, taxable corporate bond market.
The Bloomberg Commodity Total Return Index comprises futures contracts and tracks the performance of a fully collateralised investment in the index. This combines the returns of the index with the returns on cash collateral invested in 13-week (three-month) U.S. Treasury bills.
Consumer-price indexes measure changes in the price level of a weighted-average market basket of consumer goods and services purchased by households. A consumer price index is a statistical estimate constructed using the prices of a sample of representative items whose prices are collected periodically.
Important Information
This material represents an assessment of the market environment at a specific point in time and is not intended to be a forecast of future events or a guarantee of future results. Positioning and holdings are subject to change. All information as of the date indicated.
This information should not be relied upon by the reader as research or investment advice, (unless you have otherwise separately entered into a written agreement with SEI for the provision of investment advice) nor should it be construed as a recommendation to purchase or sell a security. The reader should consult with their financial professional for more information. Statements that are not factual in nature, including opinions, projections and estimates, assume certain economic conditions and industry developments and constitute only current opinions that are subject to change without notice. Nothing herein is intended to be a forecast of future events, or a guarantee of future results.
Certain economic and market information contained herein has been obtained from published sources prepared by other parties, which in certain cases have not been updated through the date hereof. While such sources are believed to be reliable, neither SEI nor its affiliates assumes any responsibility for the accuracy or completeness of such information and such information has not been independently verified by SEI.
There are risks involved with investing, including loss of principal. The value of an investment and any income from it can go down as well as up. Investors may get back less than the original amount invested. Returns may increase or decrease as a result of currency fluctuations. Past performance is not a reliable indicator of future results. Investment may not be suitable for everyone.
This material is not directed to any persons where (by reason of that person's nationality, residence or otherwise) the publication or availability of this material is prohibited. Persons in respect of whom such prohibitions apply must not rely on this information in any respect whatsoever.
The information contained herein is for general and educational information purposes only and is not intended to constitute legal, tax, accounting, securities, research or investment advice regarding the strategies or any security in particular, nor an opinion regarding the appropriateness of any investment. This information should not be construed as a recommendation to purchase or sell a security, derivative or futures contract. You should not act or rely on the information contained herein without obtaining specific legal, tax, accounting and investment advice from an investment professional. While considerable care has been taken to ensure the information contained within this document is accurate and up-to-date, no warranty is given as to the accuracy or completeness of any information and no liability is accepted for any errors or omissions in such information or any action taken on the basis of this information.
Index returns are for illustrative purposes only, and do not represent actual account performance. Index returns do not reflect any management fees, transaction costs or expenses. Indexes are unmanaged and one cannot invest directly in an index. Not all strategies discussed may be available for your investment.
Information issued in the UK by SEI Investments (Europe) Ltd, 1st Floor, Alphabeta, 14-18 Finsbury Square, London EC2A 1BR which is authorised and regulated by the Financial Conduct Authority.
The contents of this document have not been reviewed by any regulatory authority in Hong Kong. You are advised to exercise caution in relation to the offer. If you are in any doubt about any of the contents of this document, you should obtain independent professional advice.
This information is made available in Latin America and the Middle East FOR PROFESSIONAL (non-retail) USE ONLY by SIEL.
Any questions you may have in relation to its contents should solely be directed to your Distributor. If you do not know who your Distributor is, then you cannot rely on any part of this document in any respect whatsoever.
Issued in South Africa by SEI Investment (South Africa) (Pty) Limited FSP No. 13186 which is a financial services provider authorised and regulated by the Financial Sector Conduct Authority (FSCA). Registered office: 3 Melrose Boulevard, 1st Floor, Melrose Arch 2196, Johannesburg, South Africa.
SIEL is not licensed under Israel’s Regulation of Investment Advising, Investment Marketing and Portfolio Management Law, 5755-1995 (the “Advice Law”) and does not carry insurance pursuant to the Advice Law. This document and any of the SEI Funds mentioned herein have not been approved by the Israeli Securities Authority (the “ISA”).
This material is intended for information purposes only and the information in it does not constitute financial advice as contemplated in terms of the Financial Advisory and Intermediary Services Act.
For professional clients only. Not suitable for retail distribution.


