Monthly Market Commentary: Equities Climb as World Prepares to Reopen for Summer
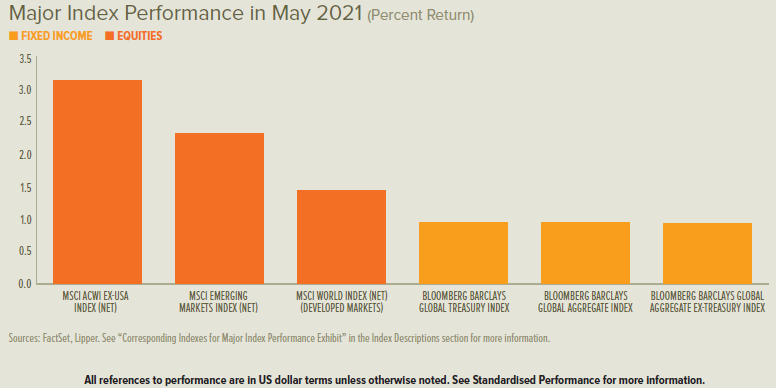
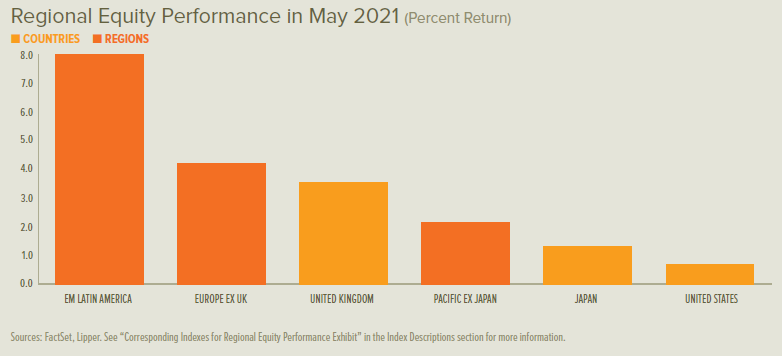
Global equity markets advanced during May for the fourth straight month. Emerging-market shares outpaced developed markets as a group, but performance varied widely from country to country.
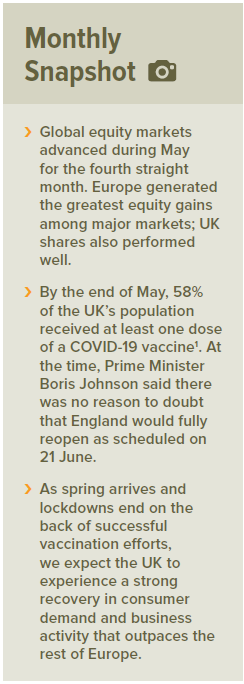
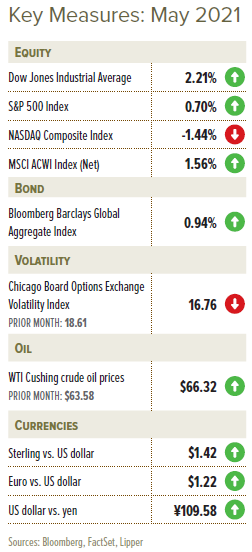
Europe generated the greatest equity gains during May, driven by sharp rallies across Hungary, Poland, Austria and Czech Republic; UK shares also performed quite well. Japan and Hong Kong equities produced healthy returns, while mainland China and US performance was positive but restrained.
Rates for UK gilts and US Treasurys declined across most maturities during May, with the most pronounced moves centred on intermediate- to long-term rates. Eurozone government-bond rates increased across all maturities. The West Texas Intermediate crude-oil price crept up to its highest level since late 2018 as energy demand continued to rise during May. OPEC+ (the Organization of the Petroleum Exporting Countries led by Saudi Arabia, plus Russia) announced on 1 June that it will continue to loosen supply cuts that were implemented to counteract plummeting demand early on in the pandemic.
In the UK, 58% of the population had received at least one dose of a COVID-19 vaccine by the end of May, while its daily COVID-19 infection rate fell to 5% of its peak. At the same time, the US one-dose number stood at 51% of its population as the country’s daily infection rate was 7% of its all-time high; Germany’s respective figures were 43% and 16%, while France’s were 37% and 17%. India’s severe COVID-19 outbreak eased somewhat, with its daily infection rate falling to 45% of its peak by the end of May; several other countries in Southeast Asia along with a number of South American and Caribbean countries remained at or near their highest infection levels.
England’s reopening timetable has continued according to schedule. Restaurants and pubs were allowed to provide indoor service starting on 17 May, while hotels opened up, and people from multiple households were permitted to congregate inside. Prime Minister Boris Johnson said there was no apparent reason to doubt that the final reopening stage—which would eliminate all remaining restrictions on social contact, live performances and nightclubs—would occur on 21 June as scheduled.
In a push to re-establish tourism ahead of the traditionally busy summer season, the EU approved a proposal made by the European Commission in May to ease travel restrictions within the bloc for vaccinated foreigners.
Tensions between the EU and China—which have flared over the last six months as the EU condemned China’s record on human rights and China imposed retaliatory economic sanctions—remained unsettled. In May, the European Parliament suspended ratification of the Comprehensive Agreement on Investment that EU and Chinese leaders had finalized in December 2020. As for EU-US trade relations, friction smoothed as the European Commission delayed an increase to tariffs on the US that had been planned in response to the Trump administration’s tariffs on European metals; existing tariffs will remain as the two sides negotiate a long-term solution.
US President Joe Biden’s administration proposed a $6 trillion budget for the 2022 fiscal year that would serve as a starting point from which Congress can decide how to appropriate the country’s economic funding. The president incorporated his two major economic initiatives into the budget— infrastructure (estimated $2.3 trillion) and families programmes (estimated $1.8 trillion)—along with $1.5 trillion for defence. Negotiations during May produced an offer from the White House to lower its infrastructure price tag to $1.7 trillion and a counter bid from Senate Republicans for a $928 billion package.
Economic Data
- UK manufacturing activity during May surpassed a growth record set in 1994, according to IHS Markit/CIPS’ purchasing managers’ index (PMI) surveys, while UK services activity expanded to the highest level in 91 months. The UK claimant count (which calculates the number of people claiming Jobseeker’s Allowance) remained at 7.2% of the population in April as the total number of claimants decreased from 2.64 million to 2.63 million. The broad UK economy grew by 2.1% during March after expanding by 0.7% in February and contracting by 2.6% in January.
- Eurozone manufacturing growth moved further into record-high territory during May, according to IHS Markit’s eurozone manufacturing PMI survey (which dates back to 1997). Eurozone services activity returned to a healthy pace of growth in May after emerging in April from an extended contraction. The eurozone unemployment rate edged lower from 8.1% to 8.0% during May. Overall eurozone economic activity contracted by 0.6% during the first quarter of 2021 and by 1.8% year over year—a modest improvement from the prior quarter-over-quarter decline of 7.2%, and a substantially improved year-over-year figure compared to the 4.9% decline recorded for the 12-month period ending December 2020.
- US manufacturing activity remained at red-hot growth levels in May, according to multiple PMI surveys. In the same month, IHS Markit’s preliminary US services PMI survey (which dates back to 2009) reported that US services growth set a new high. New claims for jobless benefits continued to decline, from just below 500,000 per week at the start of May to 385,000 at the end of the period. Overall US economic growth jumped to a 6.4% annualised rate during the first quarter of 2021 from 4.3% in the prior quarter.
Central Banks
- The Bank of England’s (BOE) Monetary Policy Committee (MPC) kept the bank rate at 0.1% and retained an £895 billion maximum allowance for asset purchases at its early May meeting. The BOE upgraded its forecast for 2021 UK economic growth to 7.5% from 5% in February, and stated that it could now begin to slow the pace of its monthly asset purchases as planned.
- The European Central Bank (ECB) did not hold a monetary-policy meeting during May; it held course at its late-April meeting, increasing the pace of asset purchases under its €1.85 trillion Pandemic Emergency Purchase Programme (PEPP). This move, previously announced in March, is intended to counter the negative economic impact of rising interest rates.
- The US Federal Open Market Committee (FOMC) did not hold a monetary-policy meeting in May and made no significant policy changes following its late-April meeting. The federal-funds rate remained near zero and asset purchases were set to continue at a level of $80 billion in US Treasurys and $40 billion in agency mortgage-backed securities per month.
- The Bank of Japan (BOJ) had no monetary-policy meeting in May; it made no immediate changes at its late-April meeting after announcing a shift in March from programmatic market interventions to a more as-needed approach.
SEI’s View
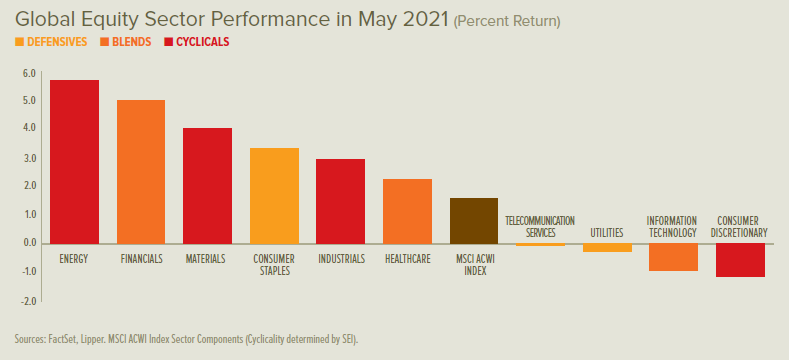
The war against COVID-19 is not over, but the path to victory has become clearer. Investors are anticipating the return to a more normal world. This was reflected in the rapid rise in bond yields during the first quarter, which we believe was one of the most important changes in the financial environment so far this year. The jump caused outsized price drops in long-term fixed-income securities and helped fuel the sharp equity-market rotation away from expensively priced growth shares and into value oriented and cyclical sectors, both in the US and internationally.
With the passage of the latest US fiscal stimulus package, the cumulative amount of US fiscal support since March 2020 totals a remarkable $6 trillion—approaching 30% of US gross domestic product (GDP). The Federal Reserve has gone to great lengths to protect the bond market from the rising tide of Treasury issuance with its purchases of outstanding issues. In the 12 months ended March 2021, the Fed bought $2.3 trillion of Treasury securities; the federal deficit amounted to $4.09 trillion over the same period.
Higher bond yields may cause bouts of indigestion for equities but should not derail the bull market. We expect cyclical and value-oriented shares to continue to advance relative to growth and defensively oriented sectors. In most cycles, value shares outperform growth when the yield curve is rising or is especially wide (rates on long-term Treasury bonds are well above those on short-term securities). Value’s performance against growth bottomed on 1 September, and has moved higher with limited interruption ever since.
While value-oriented shares have been making a comeback against growth in the US, other countries’ equity markets are making a comeback against the US.
As spring arrives and lockdowns end on the back of successful vaccination efforts, we expect the UK to experience a strong recovery in consumer demand and business activity that outpaces the rest of Europe.
UK government policy remains supportive in the near-term. But the recently proposed fiscal budget appears rather restrained compared to measures taken in the US by the Biden administration, adding only about 3% of UK GDP to the budget deficit for the 2021-to-2022 fiscal year. In the 2023-to- 2024 fiscal year and beyond, policy actions are projected to begin reducing the deficit, mostly through increasing the corporation tax rate from 19% to 25% and freezing income-tax thresholds.
Although not as high as the valuation metrics found in the US equity market, shares outside the US still appear expensive. Currently, the MSCI World ex USA Index is priced at almost 17 times the earnings-per-share forecast for the next 12 months, the highest level since 2004.
To repeat, developed-country equity markets still look cheap compared to US equities. The forward price-to-earnings ratio for the MSCI USA Index is above 23. Therefore, the MSCI World ex USA Index trades at an unusually wide 27% discount. Although longer-term growth differentials justify a structurally higher multiple for US equities, rebounding economies and rising interest rates should lead to a narrower valuation gap.
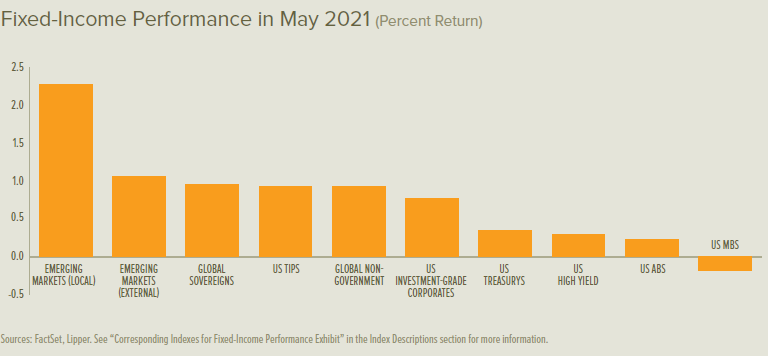
The jump in US bond yields this year has raised investor concerns that emerging markets will be the victims of a 2013-style taper tantrum. Rising rates are a headwind, but we believe emerging economies are generally in a better position to withstand the pressure now than they were eight years ago. Strong growth in the world economy over the next year should help lift most emerging markets.
World trade volumes, for example, had already reached pre-pandemic levels by the end of last year. Over the course of 2021, the expansion in trade should continue. When trade volumes are strong, developing country equity markets tend to perform well against those of economically advanced countries.
We believe the economic backdrop strongly supports cyclical and value-oriented equities in the emerging markets, just as it does in developed markets. The MSCI Emerging Markets Value Index (total return) is highly correlated with industrial commodity prices, which have already vaulted higher from their year-ago lows.
Demand for metals and other commodities will be stoked by the strengthening manufacturing and construction activity in the US and China, the recovery in Europe and Latin America as vaccines become more widely available, the global push into electric vehicles and other climate projects, and the major infrastructure package that is next on the Biden administration’s to-do list.
Emerging economies also look less susceptible to a 2013-style taper tantrum because their external positions are much healthier today; current account balances as a percentage of GDP are generally much smaller than they were eight years ago.
Emerging-market local-currency and US dollar bond yields have moved higher in the year to date, but the increase has been modest so far. Option adjusted spreads are still near their lows of the past three years, certainly not qualifying as a taper tantrum.
Granted, some big countries face continuing problems. Besides Turkey, debt dynamics among the larger countries appear most worrying in Brazil and South Africa. However, most of the debt in these two countries is denominated in local currency, allowing their governments to engage in some form of financial repression (like quantitative easing) in order to temper the pressure on their bond markets.
SEI’s base case is an optimistic one. Developing countries will likely take longer than developed nations to reopen fully due to vaccination distribution challenges. Yet, even these countries will benefit economically from the upswing in developed-market consumer demand.
However, having confidence is not the same as being complacent. Beyond COVID-19 concerns, we expect investors will be increasingly focused on the next multi-trillion dollar US spending package, which will almost certainly include tax increases on corporations and high-income households. Compromises will be needed to keep the Democratic caucus unified.
Generally speaking, the tax and regulatory changes championed by the Biden administration are not considered business- or equity-market friendly. But the same could be said of the economic policies pursued during President Barack Obama’s administration. That did not prevent one of the strongest and most enduring bull-market runs in US history. We caution against making broad asset-allocation changes based on perceived shifts in the political winds.
As for monetary policy, we will be watching whether the US Fed can maintain its stance of a near-zero federal-funds rate through 2023. If the acceleration in inflation proves stronger and longer-lasting than investors expect, bond yields could climb appreciably from today’s levels.
If the Fed accelerates policy rate hikes, we would expect a neutral-to negative reaction in equities and other risk assets. On the other hand, suppressing the rise in bond yields through even more aggressive policy actions could lead to a weaker US dollar and a sharper investor focus on inflation-hedging. Equity valuations could get even more expensive than they are now as investors grow even more exuberant. Interesting times, indeed.
Glossary of Financial Terms
Bear market: A bear market refers to a market environment in which prices are generally falling (or are expected to fall) and investor confidence is low.
Bull market: A bull market refers to a market environment in which prices are generally rising (or are expected to rise) and investor confidence is high.
Comprehensive Agreement on Investment (CAI): The CAI is cross-border investment deal between the EU and China that was first proposed in 2013. Negotiations over the CAI were concluded in December 2020 and it was awaiting approval by the European Parliament, but it has since been withheld given diplomatic tension between the parties.
Cyclical stocks: Cyclical stocks or sectors are those whose performance is closely tied to the economic environment and business cycle. Managers with a pro-cyclical market view tend to favour stocks that are more sensitive to movements in the broad market and therefore tend to have more volatile performance.
Democratic caucus: The Democratic caucus refers to all members of the Democratic Party that serve in the US Congress plus a small group of independent congress people.
Fiscal policy: Fiscal policy relates to decisions about government revenues and outlays, like taxation and economic stimulus.
Fiscal stimulus: Fiscal stimulus refers to government spending intended to provide economic support.
Forward price-to-earnings (PE) ratio: The forward PE ratio is equal to the market capitalisation of a share or index divided by forecasted earnings over the next 12 months. The higher the PE ratio, the more the market is willing to pay for each dollar of annual earnings.
Hedging: Hedging is an investment technique designed to try to limit potential losses from swings in market value (price changes) of stocks, bonds, commodities or currencies.
Monetary policy: Monetary policy relates to decisions by central banks to influence the amount of money and credit in the economy by managing the level of benchmark interest rates and the purchase or sale of securities. Central banks typically make policy decisions based on their mandates to target specific levels or ranges for inflation and employment.
Mortgage-backed securities: Mortgage-backed securities (MBS) are pools of mortgage loans packaged together and sold to the public. They are usually structured in tranches that vary by risk and expected return. Agency means that the debt is guaranteed by a government-sponsored entity.
OPEC+: OPEC+ combines OPEC—a permanent intergovernmental organization of 13 oil-exporting developing nations that coordinates and unifies the petroleum policies of its member countries—with Russia, a major oil exporter, to make collective high-level decisions about oil production levels.
Options: Options are contracts that provide a buyer with the right, but not the obligation, to buy or sell a security at an agreed-upon price.
Pandemic Emergency Purchase Programme (PEPP): PEPP is a temporary asset-purchase programme of private and public sector securities established by the ECB to counter risks to monetary-policy transmission and the outlook for the euro area posed by the COVID-19 outbreak.
Purchasing managers’ index (PMI) survey: A PMI survey is compiled from responses to questionnaires sent to a panel of purchasing managers working, for example, in the manufacturing and business services sectors.
Quantitative easing: Quantitative easing refers to expansionary efforts by central banks to help increase the supply of money in the economy.
Taper tantrum: Taper tantrum describes the 2013 surge in US Treasury yields, resulting from the US Federal Reserve’s announcement of future tapering of its policy of quantitative easing.
Yield: Yield is a general term for the expected return, in percentage or basis points (one basis point is 0.01%), of a fixed-income investment.
Yield curve: The yield curve represents differences in yields across a range of maturities of bonds of the same issuer or credit rating (likelihood of default). A steeper yield curve represents a greater difference between the yields. A flatter curve indicates the yields are closer together.
Index Descriptions
The Bloomberg Commodity Index is composed of futures contracts and reflects the returns on a fully collateralised investment in the Index. This combines the returns of the Index with the returns on cash collateral invested in 13-week (3-month) US Treasury bills.
The MSCI Emerging Markets Value Index measures the performance of large- and mid-cap stocks exhibiting overall value style characteristics across 27 emerging-market countries.
The MSCI USA Index measures the performance of the large- and mid-cap segments of the US market. The Index covers approximately 85% of the free float-adjusted market capitalisation in the US.
The MSCI World Index is a free float-adjusted market-capitalisation-weighted index that is designed to measure the equity-market performance of developed markets.
The MSCI World ex USA Index is a free float-adjusted market-capitalisation-weighted index that is designed to measure the equity market performance of developed markets, excluding the US.
The S&P 500 Index is an unmanaged market-capitalisation-weighted index comprising 500 of the largest publicly traded US companies and is considered representative of the broad US stock market.
Important Information
Data refers to past performance. Past performance is not a reliable indicator of future results.
Investments in SEI Funds are generally medium- to long-term investments. The value of an investment and any income from it can go down as well as up. Investors may get back less than the original amount invested. Returns may increase or decrease as a result of currency fluctuations. Additionally, this investment may not be suitable for everyone. If you should have any doubt whether it is suitable for you, you should obtain expert advice.
No offer of any security is made hereby. Recipients of this information who intend to apply for shares in any SEI Fund are reminded that any such application may be made solely on the basis of the information contained in the Prospectus. This material represents an assessment of the market environment at a specific point in time and is not intended to be a forecast of future events, or a guarantee of future results. This information should not be relied upon by the reader as research or investment advice regarding the funds or any stock in particular, nor should it be construed as a recommendation to purchase or sell a security, including futures contracts.
In addition to the normal risks associated with equity investing, international investments may involve risk of capital loss from unfavourable fluctuation in currency values, from differences in generally accepted accounting principles or from economic or political instability in other nations. Bonds and bond funds are subject to interest rate risk and will decline in value as interest rates rise. High yield bonds involve greater risks of default or downgrade and are more volatile than investment grade securities, due to the speculative nature of their investments. Narrowly focused investments and smaller companies typically exhibit higher volatility. SEI Funds may use derivative instruments such as futures, forwards, options, swaps, contracts for differences, credit derivatives, caps, floors and currency forward contracts. These instruments may be used for hedging purposes and/or investment purposes.
While considerable care has been taken to ensure the information contained within this document is accurate and up-to-date, no warranty is given as to the accuracy or completeness of any information and no liability is accepted for any errors or omissions in such information or any action taken on the basis of this information.
This information is issued by SEI Investments (Europe) Limited, 1st Floor, Alphabeta, 14-18 Finsbury Square, London EC2A 1BR which is authorised and regulated by the Financial Conduct Authority. Please refer to our latest Full Prospectus (which includes information in relation to the use of derivatives and the risks associated with the use of derivative instruments), Key Investor Information Documents and latest Annual or Semi-Annual Reports for more information on our funds. This information can be obtained by contacting your Financial Adviser or using the contact details shown above.
SEI sources data directly from FactSet, Lipper, and BlackRock, unless otherwise stated.
The opinions and views in this commentary are of SEI only and should not be construed as investment advice.


