Monthly Market Commentary: Equities climb as the globe spins into a new season.
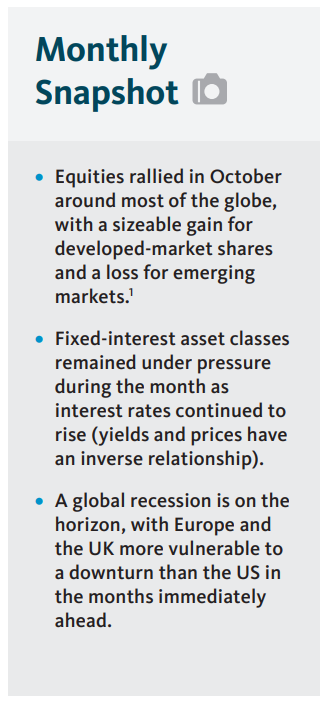
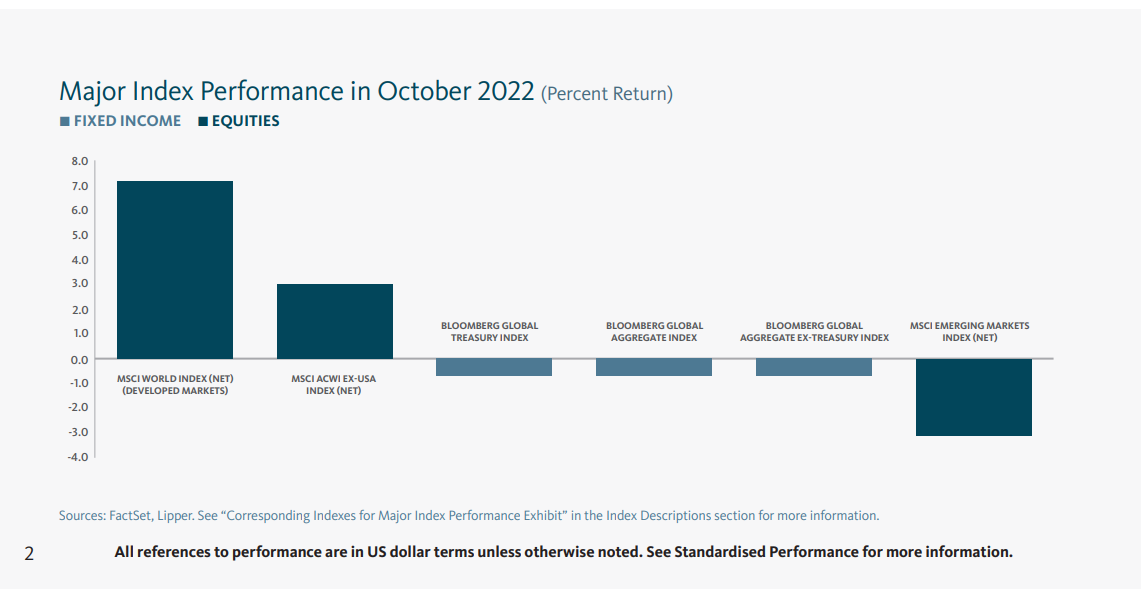
Equities around most of the globe moved higher in October after hitting a fresh bear-market bottom in the first half of the month on a selloff that began in August. The rally was uneven, with a sizeable gain for developed-market shares and a loss for emerging markets due to an abysmal performance by mainland Chinese equities.1
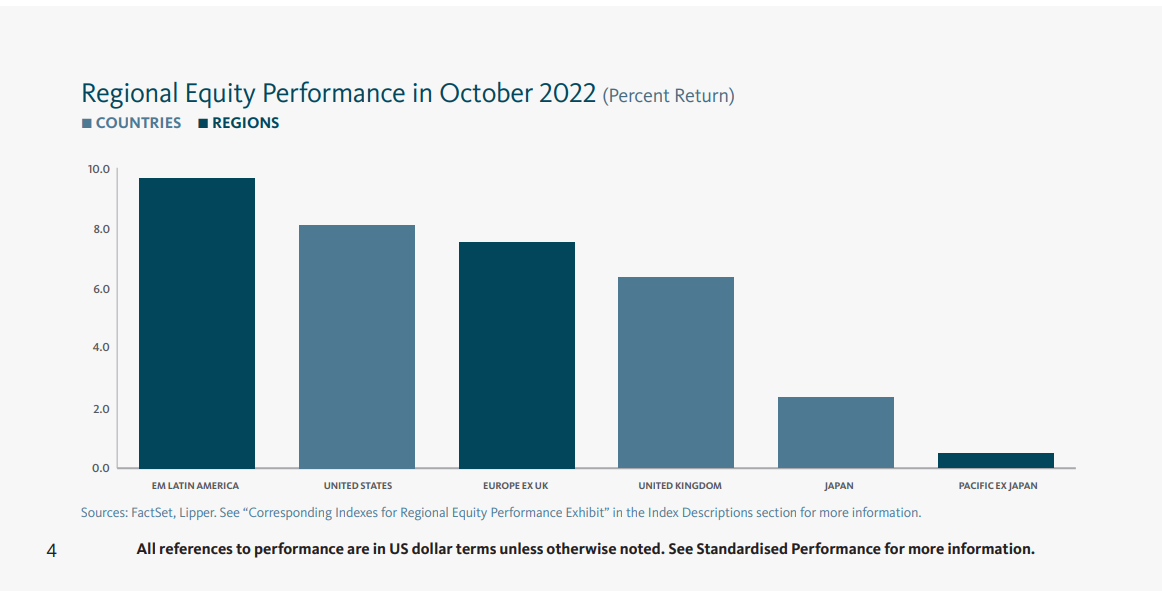
Eastern European shares outpaced other regions for the month, while Latin American equities also performed well. US shares edged out Europe as a whole with a large advance; Europe, in turn, was followed by the UK and then Japan at a distance. Hong Kong equities tumbled by double digits, but not as deeply as they did in mainland China.
Gilt yields declined sharply at shorter maturities and were slightly higher at the long end during October, flattening what had become an inverted curve. Eurozone government-bond rates increased across all maturities through about 25 years and declined thereafter. US Treasury yields climbed across the entire curve, most markedly at the short end, lengthening an inversion.
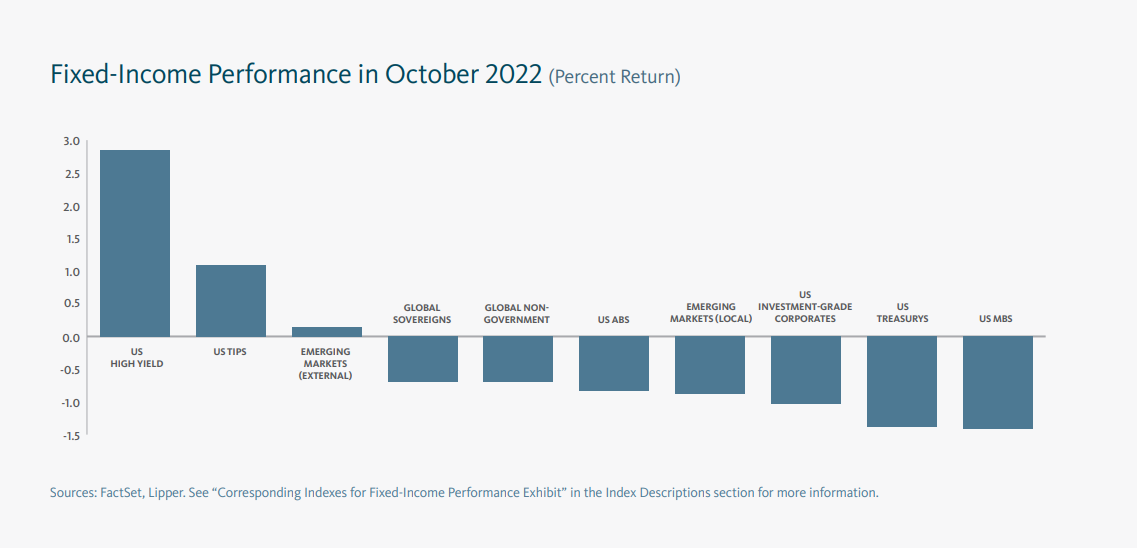
Fixed-interest asset classes remained under pressure in the month as rates continued to rise (yields and prices have an inverse relationship). US high-yield bonds benefited as risk assets rallied, while the most rate-sensitive areas of the market—mortgage-backed securities, US Treasurys, and investment-grade corporates—delivered sizeable losses.2
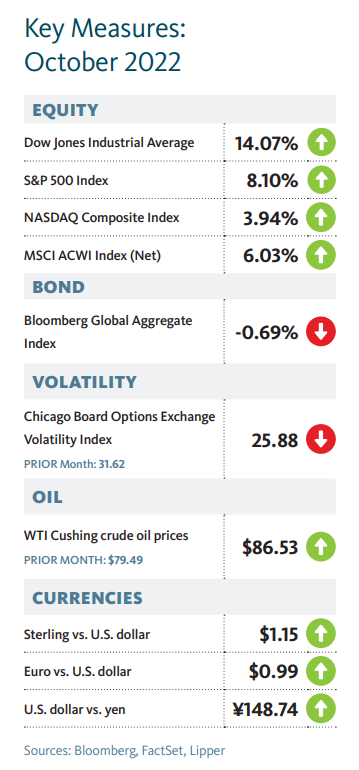
Commodity prices were mixed during October. Brent and West-Texas Intermediate crude oil spot prices climbed by 9.01% and 8.86%, respectively, while natural gas prices slid by 2.36%. Wheat prices finished only 4.26% lower for the full month despite having plummeted by more than 10% late in the period; the recovery— driven by Russia’s threat to back out of a Ukrainian grain-shipping deal—proved brief as prices tumbled back again at the beginning of November.
Liz Truss resigned as UK prime minister in late October after the disastrous reception of her fiscal programme sent gilt and sterling markets reeling, collapsing her support within the Conservative Party. Her departure cleared the way for Rishi Sunak, who ascended as Conservative leader and prime minister near the end of the month.
In China, Xi Jinping began his third five-year term as general secretary of the Communist Party in late October—breaking precedent for 10-year term limits and neglecting to name a clear successor to the Politburo Standing Committee. Xi’s retention of the Party leadership ensures he will continue to serve as president of the People’s Republic of China for another five years.
Russia resumed mass bombardment of Ukraine with missiles and drones in October as gains from Ukraine’s counteroffensive mounted along its southern and eastern fronts. Ukraine claimed that the attacks, which appeared to target electricity infrastructure, took out roughly one-third of the country’s power stations and led to rolling blackouts.
Economic data
UK
- Consumer prices in the UK increased by 0.5% during September and 10.1% over the prior year—setting a new 40-year high for the year-over-year inflation rate.4
- UK manufacturing activity contracted for a third straight month in October after growth began to slow in May.5
- Activity in the UK services sector began to contract in October after expanding at a modest-but-healthy pace through the summer and levelling off in September.6
- The UK’s claimant count (which calculates the number of people claiming Jobseeker’s Allowance) increased in September—by about 25,500—after breaking a 17-month streak of declines in August. Total claimants held firm at 3.9% of the population.
Eurozone
- Eurozone consumer prices increased by 1.5% in October and 10.7% over the prior year—the highest year-over-year inflation figure since Eurostat began tracking data in 1997.7
- A contraction in eurozone manufacturing activity that began in July deepened in October.8
- Eurozone services activity declined further in October after entering contraction territory in the prior month.9
- Eurozone economic growth slowed in the third quarter to 0.2% from 0.7% in the second quarter and to 2.4% from 4.3% in the year over year
US
- The US Commerce Department’s personal-consumption expenditures price index (PCE), which is the US Federal Reserve’s (Fed) preferred inflation measure, held at 0.3% in September and 6.2% year over year.
- Manufacturing growth in the US held near a standstill during October as a slowdown in new orders eased while headcount reduction came to a halt.10,11
- US services activity remained volatile, contracting in October after recovering to a near-breakeven pace in the prior month.12
- Job openings rose from 10.28 million in August to 10.72 million in September. The number of unemployed Americans measured 5.75 million in September, meaning there were about 1.9 jobs available for every jobseeker.
- The overall US economy grew at a 2.6% annualised rate during the third quarter after contracting by an annualised 0.6% in the second quarter
Central banks
- The Bank of England’s (BOE) Monetary Policy Committee did not meet in October after hiking its benchmark rate by 0.50% in both August and September, bringing the bank rate to 2.25%. In late September, the BOE announced a temporary bond-buying programme to help ease concerns about financial stability as long-term rates skyrocketed in response to the new government’s mini-budget.13
- The European Central Bank (ECB) increased all three of its benchmark rates by 0.75% each at its late-October meeting, its second straight hike of that magnitude. The central bank also announced in late October that the applicable rates for its third targeted longer-term refinancing operation, or TLTRO III, would align with its deposit facility rate beginning 23 November. The lending facility was originally established to foster credit availability but has essentially enabled bank subsidies as interest rates have risen, prompting the ECB’s action.
- The US Fed’s Federal Open Market Committee (FOMC) increased the federal-funds rate by 0.75% at the beginning of November—the fourth consecutive increase of its size—making the target range 3.75% to 4.00%. The central bank also settled into an accelerated pace of balance-sheet reduction starting in September, allowing Treasury and mortgage holdings to mature without being replaced at maximum respective monthly paces of $60 billion and $35 billion.
- The Bank of Japan’s (BOJ) short-term interest rate remained -0.1%, and the 10- year Japanese government-bond (JGB) yield target held near 0% at the central bank’s late-October meeting. The BOJ continued to offer purchases of 10-year JGBs at 0.25% in order to keep yields within its acceptable range. In September, the central bank was compelled to intervene in currency markets for the first time since 1998 to limit the yen’s slide.14
SEI’s view
Russia’s assault on Ukraine and its energy blackmail against Europe (and, by extension, the rest of the world) are not exactly new; nor is the aggressive response of central banks to high global inflation or the severe COVID-19-related slowdown in China. All have simply increased in intensity. Most important (from an economic perspective) is that monetary-policy makers now must finally acknowledge the major inflation problem on their hands, one that is neither transitory nor likely to be resolved without pain.
In our opinion, investors should be prepared to see a federal-funds rate that could exceed 5%. Other central banks are following the Fed’s lead, talking tough and implementing outsized policy-rate increases.
Europe will continue to be the area most under pressure due to Russia’s suspension of natural gas exports. Although storage facilities within the EU are now nearly 95% full, the continent still needs a steady flow of gas to get through the high-usage winter months.15 Governments may be forced to impose disruptive energy-saving restrictions on businesses and citizens. Heavy users of electricity, from aluminium smelters to glassmakers, have already been shutting down.
The UK announced plans to cap electricity costs that amount to 6.5% of gross domestic product (GDP). Other countries that allocated funds for energy-related aid in excess of 3% of GDP include Croatia, Greece, Italy, and Latvia. It would not be surprising to see more energy-related fiscal relief. Deficits could balloon in the same way as they did in the early months of the COVID-19 crisis as policy makers do what they must to protect their populations.
Central bankers are mandated to lean hard against the rising trend in prices— even though doing so goes against their own governments’ stimulus efforts. Unfortunately, they’re running just to keep up with the Fed. Interest-rate differentials versus the US are still wide, with only Canada on par with the US.16
The large differential in favour of the US along with the perception that it’s better positioned economically are two major reasons behind the US dollar’s extraordinary appreciation this year. Although a declining currency may give a competitive boost to domestic firms that export goods and services to the US market, it exacerbates inflationary pressures stemming from imports priced in US dollars—most importantly, oil and liquefied natural gas.
Several large US multinational companies have warned that US dollar strength is beginning to exert a negative impact on revenues, suggesting that the currency’s value has risen well beyond its purchasing-power parity (PPP) level. But discrepancies can last for a long time between PPP and market-based exchange rates.
Still, it would not be surprising to see at least a temporary reversal in the US currency’s trend. Given a catalyst—coordinated government action to weaken the dollar or a surprisingly weak US unemployment report, for example—traders might cover their long positions in a major way, causing the dollar to fall abruptly.
The rise in US hourly compensation has been extensive; annualised gains exceeded 6% even when measured over a three-year span. This is the sharpest increase in almost four decades.17 Similar to the 1970s experience, compensation gains have been accelerating despite slowing productivity growth. This divergence is concerning. The difference between the change in compensation and the change in productivity equals the change in unit labour costs.
Although unit labour costs are more volatile than inflation, there is still a strong positive correlation between the two.
Unfortunately, history shows that it usually takes an outright recession to tame inflation, especially when it gets this intense. Fed Chair Jerome Powell’s hope for a soft landing appears to be an exercise in wishful thinking. Unit labour costs jumped in the year over year through August at a rate that far exceeded inflation— and we see no reason to expect a major reversal in the near term, even if the economy stumbles into a bona fide recession.
US companies have been able to push their higher employment and supply costs onto consumers. While economy-wide profit margins have remained above almost all cyclical peaks since 1947, we suspect that margins are on the cusp of a substantial erosion. It’s typical for profit margins to decline well before an economic recession materialises.18
If the economy does fall into recession and profits decline, it will probably force analysts to mark down earnings estimates aggressively in order to catch up with reality. Investors are not waiting for those earnings revisions. They have been pushing equities lower in reaction to the Fed’s aggressive shift and in anticipation of a recession, both in the US and globally.
Fed policymakers project a federal-funds rate in the 4.4%-to-4.9% range next year, but the actual result may still be higher. Unless the central bank is ready to engineer a severe recession, we think PCE price inflation could run in a 3%-to-4% range instead of the pace of less than 2% recorded over much of the past 25 years.
Several asset classes looked extremely oversold by the end of the third quarter, including equities, bonds, currencies, and commodities. The US dollar’s sharp climb has reversed most of this year’s appreciation in the commodities complex. If the currency breaks to the downside, commodities should break to the upside.
We maintain a positive outlook on commodities despite the demand destruction occurring in Europe and other parts of the globe. Years of underinvestment in fossil fuels and metals mines will likely lead to periodic shortages over the next few years.
The Chinese central government has allowed Hong Kong and Macau to open up. This might be a harbinger of what will happen on mainland China as President Xi begins his unprecedented third term as General Secretary of the Communist Party National Congress. Xi’s position may seem unassailable, but we suspect he is looking for a way out of his zero-COVID-19 policy. The loosening of restrictions and return to stronger economic growth is the only logical way out.
Other emerging economies would be big beneficiaries of a revival in Chinese economic activity. Yet US dollar strength is a central factor for investors in emerging-market equities. The relative total-return performance of the MSCI Emerging Market Index versus the MSCI World Index peaked in 2010, more-or-less concurrent with the trough in the trade-weighted value of the US dollar. (Trade-weighting measures the value of the dollar versus other major currencies.) As the US currency grew stronger, emerging-market equities weakened further—and, as of 30 September, gave up almost all gains achieved between 2000 and 2010 versus advanced-country stock markets.
The rate-hiking cycle began far sooner in less-developed economies, during the latter months of 2020. It was not until this year that advanced economies began a general up-cycle in policy rates; in response, interest-rate hikes in the emerging world have accelerated significantly, in both frequency and magnitude. Three-month government bond yields are in double digits in Brazil, Colombia, Hungary, and Turkey, with only Brazil’s comfortably above the inflation rate. Turkey, by contrast, is facing an inflation rate of more than 85%.19 Little wonder that the Brazilian real has maintained its value against the US dollar this year while the Turkish lira declined by almost 30%.
While the effort to tame inflation may prove successful, a global recession will likely result—with Europe and the UK more vulnerable than the US to a downturn.
Short-term gyrations notwithstanding, the primary trend in risk assets still appears negative. Inflation in the US has probably peaked, but we do not expect it to fall as rapidly or as far as the Fed projects. The central bank may still be underestimating the extent to which it needs to tighten policy in order to slow the economy and produce slack in the labour markets.
Glossary of Financial Terms
Anti-fragmentation tool: An anti-fragmentation tool refers to the ECB’s plans to mitigate widening spreads between German government bond yields and those of economically weaker EU members.
Asset Purchase Programme (APP): The ECB’s APP is part of a package of non-standard monetary policy measures that also includes targeted longer-term refinancing operations, and which was initiated in mid-2014 to support the monetary policy transmission mechanism and provide the amount of policy accommodation needed to ensure price stability.
Balance sheet: The balance sheet, as it relates to a central bank, refers to assets—for example, government bonds or mortgages-backed securities—that it has accumulated to support the transmission of monetary policy.
Bear market: A bear market refers to a market environment in which prices are generally fallng (or are expected to fall) and investor confidence is low.
Commercial paper: Commercial paper is a type of short-term loan that is not backed by collateral and does not tend to pay interest.
European Commission: The European Commission is the executive branch of the European Union. It operates as a cabinet government, with 27 members of the Commission headed by a President.
Fiscal policy: Fiscal policy relates to decisions about government revenues and outlays, like taxation and economic stimulus.
Gilt: Gilts are sovereign debt securities issued by the UK government.
Group of 7 (G7): The G7 is an inter-governmental forum for the leaders of major advanced democratic nations that includes Canada, France, Germany, Italy, Japan, the UK and the US.
Hawk: Hawk refers to a central-bank policy advisor who has a negative view of inflation and its economic impact, and thus tends to favour higher interest rates.
Inflation: Inflation refers to rising prices.
Monetary policy: Monetary policy relates to decisions by central banks to influence the amount of money and credit in the economy by managing the level of benchmark interest rates and the purchase or sale of securities. Central banks typically make policy decisions based on their mandates to target specific levels or ranges for inflation and employment.
Mortgage-Backed Securities: Mortgage-backed securities (MBS) are pools of mortgage loans packaged together and sold to the public. They are usually structured in tranches that vary by risk and expected return.
NATO: The North Atlantic Treaty Organization (NATO) is an intergovernmental military alliance among 28 European countries and 2 North American countries.
Pandemic Emergency Purchase Programme (PEPP): PEPP is a temporary asset-purchase programme of private and public sector securities established by the European Central Bank to counter the risks to monetary-policy transmission and the outlook for the euro area posed by the COVID-19 outbreak.
Politburo Standing Committee: The Politburo Standing Committee of the Chinese Communist Party is the top leadership group of the Communist Party, which controls the People’s Republic of China under one-party rule.
Price-to-earnings (PE) ratio: The PE ratio is equal to the market capitalization of a share or index divided by trailing (over the prior 12 months) or forward (forecasted over the next 12 months) earnings. The higher the PE ratio, the more the market is willing to pay for each dollar of annual earnings.
Purchasing power parity (PPP): Purchasing power parity is the exchange rate at which the currency of one country would have to be converted into that of another country to buy the same amount of goods and services in each country.
Quantitative easing: Quantitative easing refers to expansionary efforts by central banks to help increase the supply of money in the economy.
Recession: Recession refers to a period of economic decline and is generally defined by a drop in GDP over two successive quarters.
Summary of Economic Projections: The Fed’s Summary of Economic Projections (SEP) is based on economic projections collected from each member of the Fed Board of Governors and each Fed Bank president on a quarterly basis.
Targeted longer-term refinancing operations (TLTRO): The TLTROs are Eurosystem operations that provide financing to credit institutions. By offering banks long-term funding at attractive conditions they preserve favourable borrowing conditions for banks and stimulate bank lending to the real economy.
Transmission Protection Instrument (TPI): The European Central Bank established the TPI to ensure the smooth transmission of monetary policy normalisation across eurozone countries. According to the ECB, the TPI “can be activated to counter unwarranted, disorderly market dynamics” by making “secondary market purchases of securities issued in jurisdictions experiencing a deterioration in financing conditions.
Yield: Yield is a general term for the expected return, in percentage or basis points (one basis point is 0.01%), of a fixed-income investment.
Yield curve: The yield curve represents differences in yields across a range of maturities of bonds of the same issuer or credit rating (likelihood of default). A steeper yield curve represents a greater difference between the yields. A flatter curve indicates the yields are closer together.
Index Descriptions
Consumer Price Indexes measure changes in the price level of a weighted-average market basket of consumer goods and services purchased by households. A consumer price index is a statistical estimate constructed using the prices of a sample of representative items whose prices are collected periodically.
The Bloomberg Commodity Index is composed of futures contracts and reflects the returns on a fully collateralised investment in the Index. This combines the returns of the Index with the returns on cash collateral invested in 13-week (3-month) US Treasury bills.
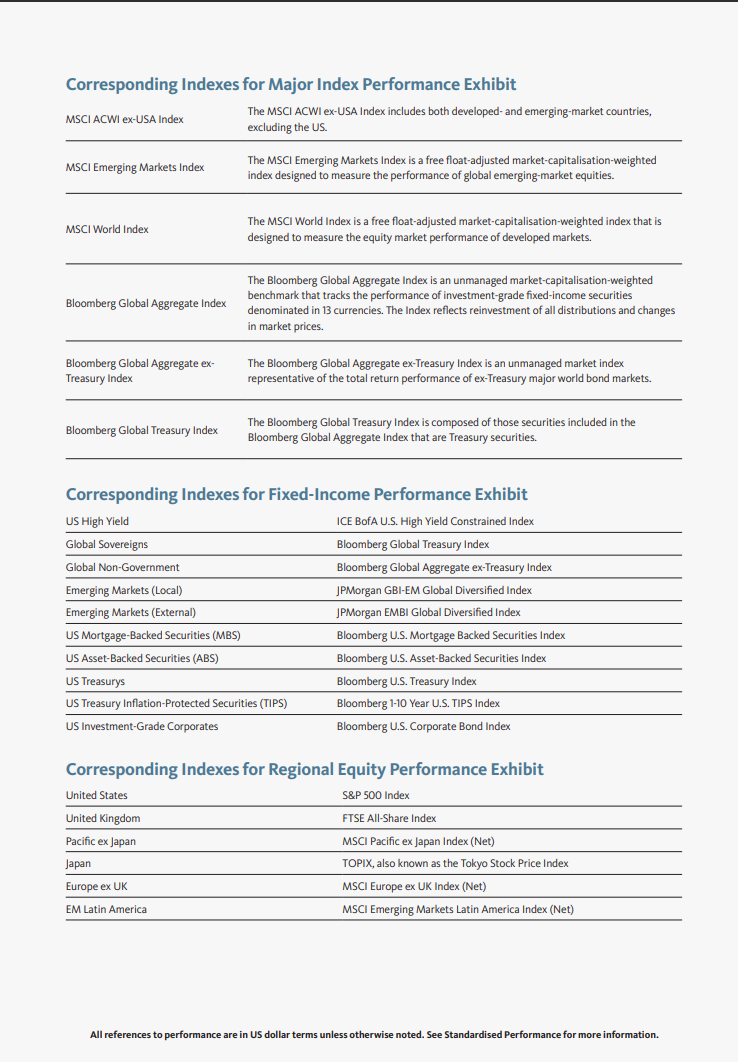
The Bloomberg Global Aggregate Index is an unmanaged market-capitalisation-weighted benchmark that tracks the performance of investment-grade fixed-income securities denominated in 13 currencies. The Index reflects reinvestment of all distributions and changes in market prices.
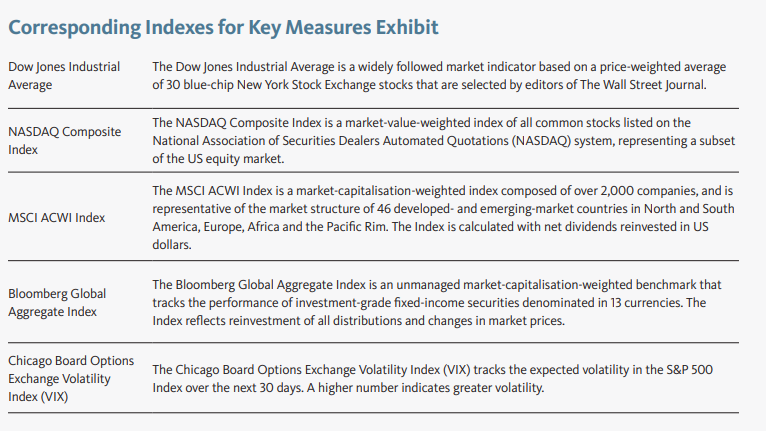
The MSCI ACWI Index is a market-capitalisation-weighted index composed of over 2,000 companies, and is representative of the market structure of 46 developed- and emerging-market countries in North and South America, Europe, Africa and the Pacific Rim. The Index is calculated with net dividends reinvested in US dollars. The MSCI Emerging Markets Index is a free float-adjusted market-capitalisation-weighted index designed to measure the performance of global emerging-market equities. Total return indexes reflect the price performance of index constituents and the income from constituent dividend payments.
The MSCI World Index is a free float-adjusted market-capitalisation-weighted index that is designed to measure the equity market performance of developed markets.
The US Personal Consumption Expenditures (PCE) Price Index is the primary inflation index used by the Federal Reserve when making monetary-policy decisions
The S&P 500 Index is a market-capitalization-weighted index that consists of 500 publicly-traded large US companies that are considered representative of the broad US stock market.
Important Information
Data refers to past performance. Past performance is not a reliable indicator of future results.
Investments in SEI Funds are generally medium- to long-term investments. The value of an investment and any income from it can go down as well as up. Investors may get back less than the original amount invested. Returns may increase or decrease as a result of currency fluctuations. Additionally, this investment may not be suitable for everyone. If you should have any doubt whether it is suitable for you, you should obtain expert advice.
No offer of any security is made hereby. Recipients of this information who intend to apply for shares in any SEI Fund are reminded that any such application may be made solely on the basis of the information contained in the Prospectus. This material represents an assessment of the market environment at a specific point in time and is not intended to be a forecast of future events, or a guarantee of future results. This information should not be relied upon by the reader as research or investment advice regarding the funds or any stock in particular, nor should it be construed as a recommendation to purchase or sell a security, including futures contracts.
In addition to the normal risks associated with equity investing, international investments may involve risk of capital loss from unfavourable fluctuation in currency values, from differences in generally accepted accounting principles or from economic or political instability in other nations. Bonds and bond funds are subject to interest rate risk and will decline in value as interest rates rise. High yield bonds involve greater risks of default or downgrade and are more volatile than investment grade securities, due to the speculative nature of their investments. Narrowly focused investments and smaller companies typically exhibit higher volatility. SEI Funds may use derivative instruments such as futures, forwards, options, swaps, contracts for differences, credit derivatives, caps, floors and currency forward contracts. These instruments may be used for hedging purposes and/or investment purposes.
While considerable care has been taken to ensure the information contained within this document is accurate and up-to-date, no warranty is given as to the accuracy or completeness of any information and no liability is accepted for any errors or omissions in such information or any action taken on the basis of this information.
This information is issued by SEI Investments (Europe) Limited, 1st Floor, Alphabeta, 14-18 Finsbury Square, London EC2A 1BR which is authorised and regulated by the Financial Conduct Authority.
SEI sources data directly from FactSet, Lipper, and BlackRock, unless otherwise stated.
The opinions and views in this commentary are of SEI only and should not be construed as investment advice.
Please refer to our latest Prospectus (which includes information in relation to the use of derivatives and the risks associated with the use of derivative instruments), Key Investor Information Document, Summary of UCITS Shareholder rights (which includes a summary of the rights that shareholders of our funds have) and the latest Annual or Semi-Annual Reports for more information on our funds, which can be located at Fund Documents. And you should read the terms and conditions contained in the Prospectus (including the risk factors) before making any investment decision.


