Monthly Market Commentary: Equities Advance to Start the Second Half
Economic Backdrop
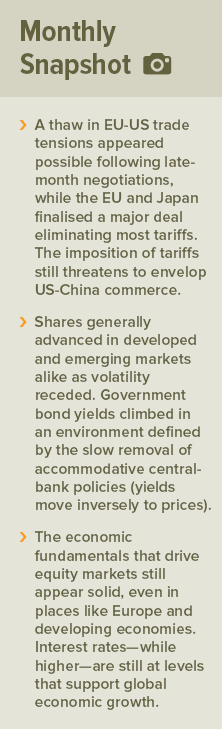
The second half of 2018 began with mixed progress on the global thematic landscape. Trade barriers, which escalated through the beginning of July and still threaten to envelop US-China commerce, appeared set for substantial relief between the US and EU following a successful late-month negotiation by US President Donald Trump and European Commission President Jean-Claude Juncker. The EU and Japan also finalised a major trade deal in mid-July that eliminated most tariffs between the two trading partners.
The Western alliance suffered a setback as President Trump declared the EU a “foe” on trade and called into question the pact’s core mutual-defence principle following a North Atlantic Treaty Organization summit in Brussels. A one-on-one meeting between the US president and Russian President Vladimir Putin raised concerns across the political spectrum—particularly after a subsequent press conference in which Trump second-guessed US intelligence agencies’ unanimous assessment of Russia’s interference in the 2016 US elections.
UK Prime Minister Theresa May ruled out the possibility of allowing Northern Ireland to remain in the EU’s customs union or single market in a bid to please pro-Brexit conservatives—but held out the prospect of harmonising the entire UK trade regime with remaining member states. The EU’s chief Brexit negotiator, Michel Barnier, rejected a key component of May’s plan that sought to have each region collect trade duties on the other’s behalf. May’s foreign and Brexit secretaries resigned early in the month after they deemed her final negotiating proposal too soft.
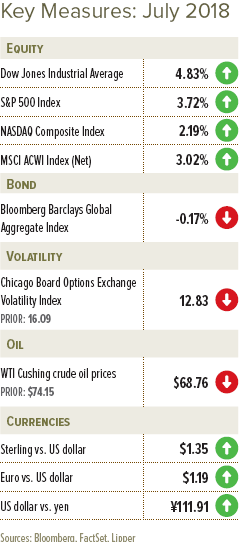
The Bank of England’s Monetary Policy Committee increased its benchmark interest rate at the beginning of August in an effort to dampen inflation pressures; in a late-July meeting, the European Central Bank (ECB) reaffirmed its policy-path commitment to taper asset purchases over the remainder of 2018. The US Federal Open Market Committee refrained from taking additional action on the first of August after increasing the federal funds rate in June. The Bank of Japan maintained its near-zero target rate, but set its band at -0.2% to 0.2% (an increase of 0.1%) at the end of July.
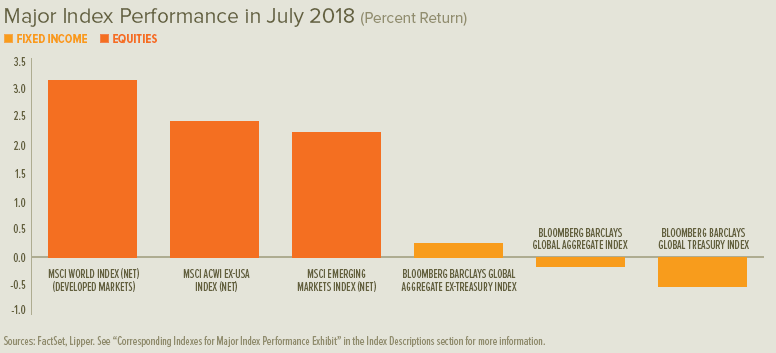
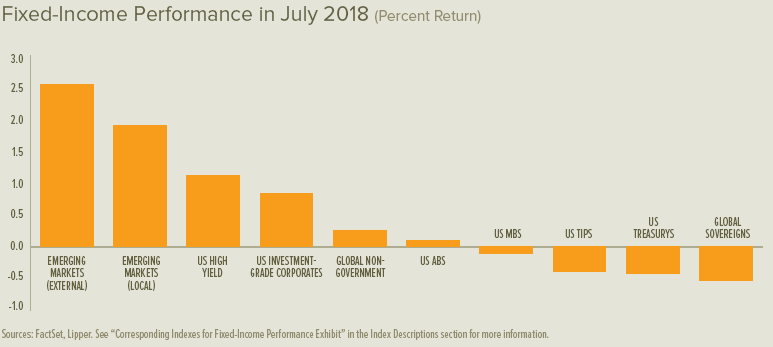
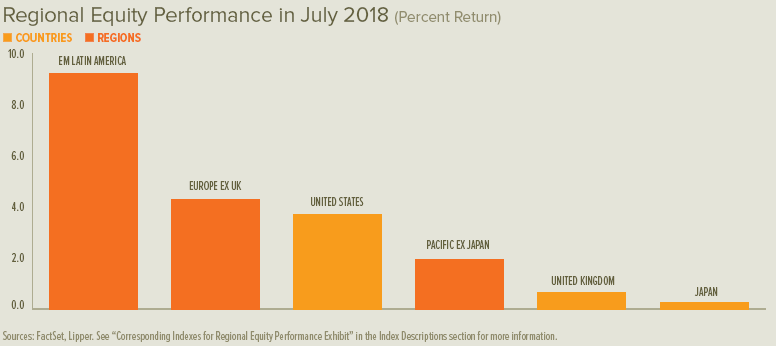
British and European shares climbed slowly throughout July, while US equities advanced for most of the month before retreating in the last week. Japanese shares increased early in the month, holding onto gains thereafter. Equities in Hong Kong, mainland China, Brazil and Mexico also generally advanced during July. Stock-market volatility was fairly subdued the world over, settling from an early-month peak. Shorter-term UK gilt yields increased and longer-term yields were mixed, while yields on euro-area and US government bonds increased similarly across all maturities.
UK sales volumes pointed to firm retail demand in July, according to a distributor survey, but were down from elevated June findings. Industrial trends were similar, with generally favourable survey results for July that were nevertheless just shy of the prior month. Consumer prices were unchanged in aggregate during June, causing the year-over-year increase to hold at 2.4%; producer prices increased by 10.2% (for inputs) and 3.1% (for outputs) from a year earlier.
Eurozone manufacturing activity appeared set for solid continued expansion in July, according to an early survey, while services growth slid to still-respectable levels. Unemployment dropped to 9.1%, the lowest level in the eurozone since February 2009. Gross domestic product (GDP) slipped to 0.3% for the second quarter and 2.1% for the year-over-year period. Despite somewhat disappointing GDP growth, the eurozone economy remains relatively healthy.
Preliminary surveys pointed to accelerating US manufacturing growth and a strong continued expansion in services activity during July. Home sales declined in June, marking the third-straight month of lower existing home sales and the lowest rate of new-home sales since February. The initial estimate of second-quarter GDP showed that US economic growth accelerated to an annualised 4.1% rate due to strong consumer spending and exports.
Our View
Investors were raging bulls at the beginning of 2018 as equity prices vaulted higher. But that optimism faded dramatically as the news flow turned less favourable. As far as we’re concerned, that’s okay—because the potential for a meaningful advance in equities is greater when investors are pessimistic and bad news is already largely discounted in the price of riskier assets.
If one believes, as we do, that the global economy is sound and that the political uncertainties currently roiling markets will be contained, then the proper course (in our view) should be to remain exposed to equities and other risk assets and ride out the short-term ups and downs.
The economic data coming out of Europe has been hugely disappointing this year. Instead of building upon the improved business activity of 2016 and 2017, there has been a widespread deceleration. At SEI, we have been reluctant to get too bearish on Europe’s fundamentals, but there’s no denying that financial-market participants are disbelievers. Analysts’ 2018 and 2019 earnings-growth estimates for the companies within the MSCI EMU (European Economic and Monetary Union) Index are quite low compared to those of other major regions and countries.
ECB President Mario Draghi and other bank governors decided to conclude net asset purchases by the end of this year because they view deflation risks as having moderated significantly. Since the ECB will no longer be a price-insensitive buyer of eurozone debt, we could see yield spreads rise as investors demand a risk premium for those countries with a heavy debt burden relative to the size of their economy. Italy’s new government wants to institute several expensive propositions that would blow a hole in the government’s budget, likely causing the country’s bonds to be further discounted by investors—with other periphery countries’ bond yields rising in sympathy (yields move inversely to prices).
Recent UK economic data reports, like those of other countries in Europe, suggest that Great Britain is wending its way through a soft patch. Underlying growth nevertheless appears solid, indicating the UK economy is in stable condition; although the trade sector looks to be a problem spot.
The biggest source of uncertainty facing the UK is its looming withdrawal from the EU. The Conservative Party’s internal fight over the country’s future relationship with the EU has stalled progress toward a clear post-Brexit status. Maybe it’s sheer coincidence, but sterling versus the US dollar is almost where it was the day after the Brexit vote on 23 June 2016. The recent trend has been to the downside, as currency-market participants worry about the rising odds of a hard Brexit and more-thorough disruption of UK trade with the EU. We would not be surprised to see further downside volatility in sterling as we draw closer to the EU exit date.
Fears of a trade war pitting the US against foes and allies alike notwithstanding, American investors, businesses and consumers have much to applaud. US corporate tax reform, tax cuts for households, and reduced or modified regulation of various industries have led to record-high consumer and business confidence.
But sabre-rattling between the US and China has deteriorated into actual skirmishing, and the latest back-and-forth suggests this spat will get worse before it gets better. To be blunt, the Trump administration’s strategy of waging a trade war with China could prove to be the equivalent of cutting off one’s nose to spite one’s face.
A trade war will likely lead to higher prices for consumers and hurt the bottom lines of companies that sell imported goods and those that depend on global supply chains in their production process—resulting in a net loss for society. A small group of producers will probably benefit substantially from the trade impediments, while most consuming industries and households suffer declines in purchasing power—declines that may be small at the level of the individual, but would add up to an enormous loss across the affected economies.
SEI will be watching closely how this drama plays out in the months ahead. With any luck, the Trump administration will shy away from further ratcheting tensions. But we must admit that doesn’t seem to be in the cards in the near-term.
A confluence of events has conspired to hurt the performance of emerging-market assets. An extensive trade war that disrupts multinationals’ supply chains would disrupt the flow of raw commodities and semi-finished materials from developing economies, which depend on these exports for economic growth. Rising US interest rates, resulting in another period of sustained US dollar strength, are a second threat. The soft patch in Europe and recent signs of deceleration in China’s economic growth is a third.
But while emerging-market stocks and bonds have come under pressure this year, we’ve yet to see any widespread deterioration in economic performance or financial conditions. On balance, we think most emerging markets have the ability to weather the storm—again, assuming the disruption to global trade does not devolve into something more encompassing.
Make no mistake about it: the headwinds blowing in the face of risk assets have picked up. Growth in business activity has slowed a bit, especially in Europe. Monetary policy in the US is getting tighter, and is set to become less expansionary in Europe as well. Inflation has ticked higher, driven by synchronised global growth and a tightening of labour markets and industrial capacity in the US, Germany, the UK, China, and elsewhere in Asia. A jump in oil prices is also pushing headline consumer-price index readings to their highest levels in several years; Organization of the Petroleum Exporting Countries and Russia have shown a fair degree of discipline in constraining the supply of crude oil at a time when demand is strong and inventory levels have fallen. Some developing countries have been forced to raise their policy rates dramatically to defend their currencies.
Most important, the stoking of trade-war tensions by the US threatens to undermine the very foundation of the system that has supported the global economy since the end of the Second World War. Although the actual trade actions to date have been modest, the impact on global supply chains bears close watching.
But the economic fundamentals that drive the stock market still appear solid, even in places like Europe and developing economies. Plus, interest rates remain at levels that are accommodative to global economic growth. The key risks—escalating trade tensions and the polarisation of electorates over issues like immigration and fiscal sovereignty—appear more political in nature. The positives include a still-solid global economy; strong momentum in corporate-profits growth; and equity valuations that still appear reasonable against the backdrop of still-low, albeit rising, interest rates.
Signs of financial stress remain isolated to the weaker economies; although Italy is an important case, owing to its size and position as a major eurozone country.
A broadening of the trade war with China or a US departure from the North American Free Trade Agreement would likely have a severely negative impact on the profitability of US manufacturers, prompting us to reassess our still-positive view. Impediments to trade also could lead to a higher inflation rate as US companies use the tariffs umbrella to raise their selling prices. The US Federal Reserve may feel compelled to lean against this threat to price stability, thereby aggravating any economic shock arising from the disruption of global supply chains—which is how a bear market could develop.
This is not our base-case scenario. We still think this old bull has some life left in it, but the risks to the equity market now seem more balanced than skewed to the bullish side.
Glossary of Financial Terms
Bear market: A bear market refers to a market environment in which prices are generally falling (or are expected to do so) and investor confidence is low.
Bull market: A bull market refers to a market environment in which prices are generally rising (or are expected to do so) and investor confidence is high.
Federal funds rate: The Federal funds rate is the interest rate at which a depository institution lends immediately available funds (balances at the Federal Reserve) to another depository institution overnight in the US.
Fundamentals: Fundamentals refers to data that can be used to assess a country or company’s financial health such as amount of debt, level of profitability, cash flow, inventory size, etc.
Yield curve: The yield curve represents differences in yields across a range of maturities of bonds of the same issuer or credit rating (likelihood of default). A steeper yield curve represents a greater difference between the yields. A flatter curve indicates the yields are closer together.
Yield spreads: Yield spreads represents the difference in yields offered between different types of bonds. If they tighten, this means that the difference has decreased. If they widen, this means the difference has increased.
Index Descriptions
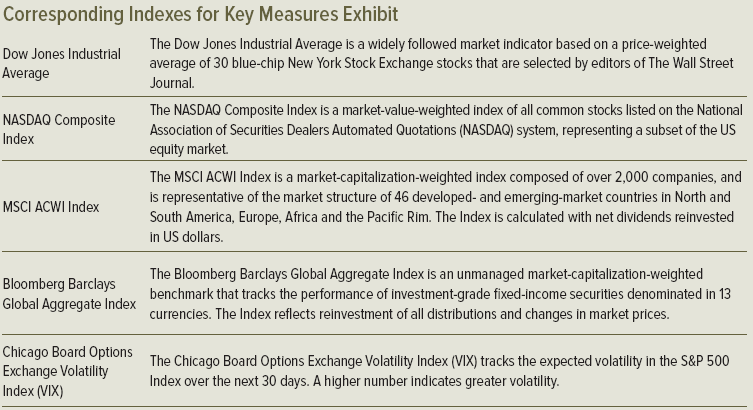
The MSCI EMU (European Economic and Monetary Union) Index: The MSCI EMU Index captures large- and mid-cap representation across the developed-markets countries in the European Economic and Monetary Union.
Important Information
Data refers to past performance. Past performance is not a reliable indicator of future results.
Investments in SEI Funds are generally medium- to long-term investments. The value of an investment and any income from it can go down as well as up. Investors may get back less than the original amount invested. Returns may increase or decrease as a result of currency fluctuations. Additionally, this investment may not be suitable for everyone. If you should have any doubt whether it is suitable for you, you should obtain expert advice.
No offer of any security is made hereby. Recipients of this information who intend to apply for shares in any SEI Fund are reminded that any such application may be made solely on the basis of the information contained in the Prospectus. This material represents an assessment of the market environment at a specific point in time and is not intended to be a forecast of future events, or a guarantee of future results. This information should not be relied upon by the reader as research or investment advice regarding the funds or any stock in particular, nor should it be construed as a recommendation to purchase or sell a security, including futures contracts.
In addition to the normal risks associated with equity investing, international investments may involve risk of capital loss from unfavourable fluctuation in currency values, from differences in generally accepted accounting principles or from economic or political instability in other nations. Bonds and bond funds are subject to interest rate risk and will decline in value as interest rates rise. High yield bonds involve greater risks of default or downgrade and are more volatile than investment grade securities, due to the speculative nature of their investments. Narrowly focused investments and smaller companies typically exhibit higher volatility. SEI Funds may use derivative instruments such as futures, forwards, options, swaps, contracts for differences, credit derivatives, caps, floors and currency forward contracts. These instruments may be used for hedging purposes and/or investment purposes.
While considerable care has been taken to ensure the information contained within this document is accurate and up-to-date, no warranty is given as to the accuracy or completeness of any information and no liability is accepted for any errors or omissions in such information or any action taken on the basis of this information.
This information is issued by SEI Investments (Europe) Limited, 1st Floor, Alphabeta, 14-18 Finsbury Square, London EC2A 1BR which is authorised and regulated by the Financial Conduct Authority. Please refer to our latest Full Prospectus (which includes information in relation to the use of derivatives and the risks associated with the use of derivative instruments), Key Investor Information Documents and latest Annual or Semi-Annual Reports for more information on our funds. This information can be obtained by contacting your Financial Adviser or using the contact details shown above.
SEI sources data directly from FactSet, Lipper, and BlackRock, unless otherwise stated.


