Monthly market commentary: The emergence of global stock market divergence.
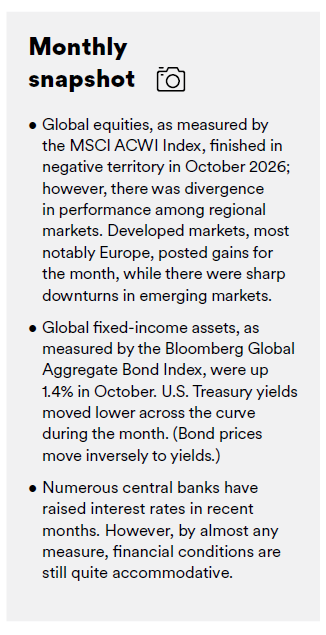
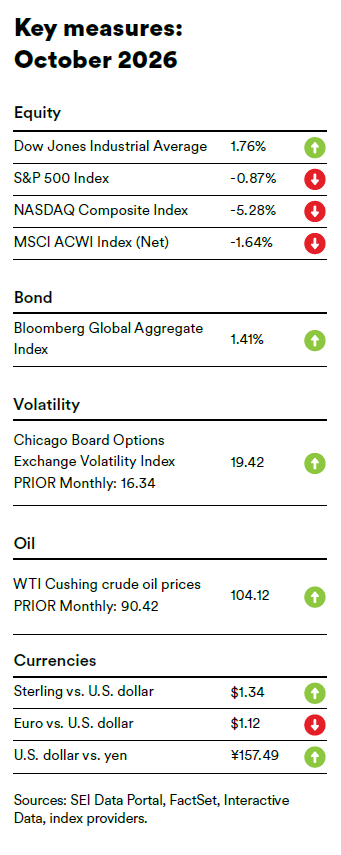
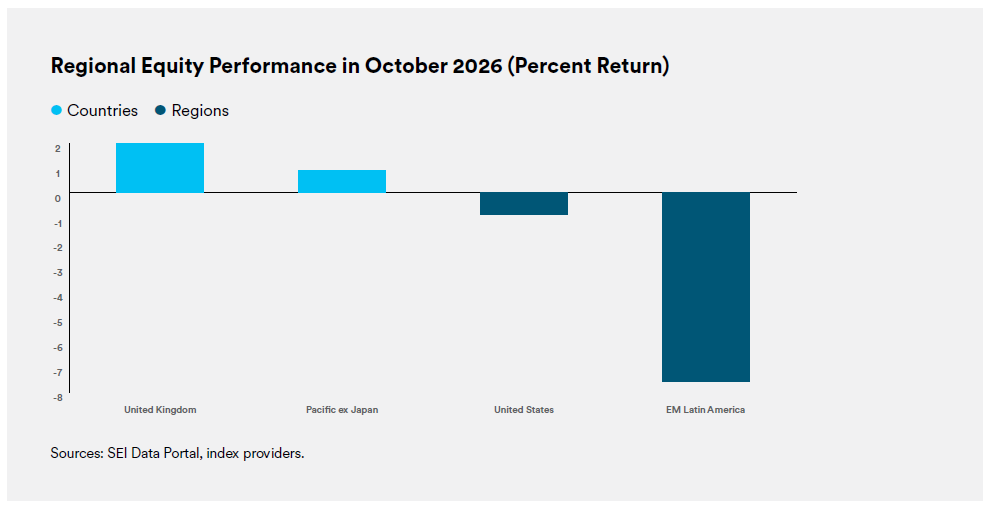
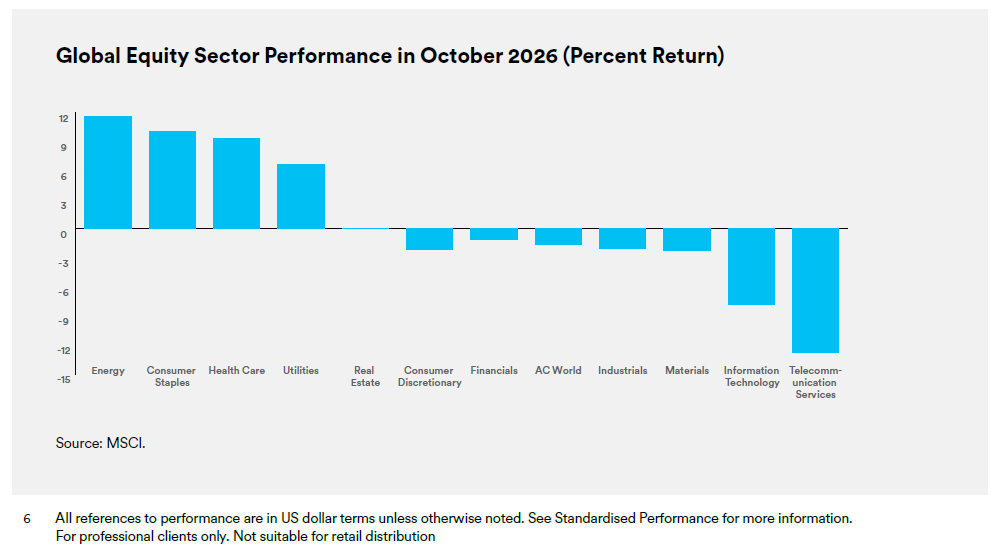
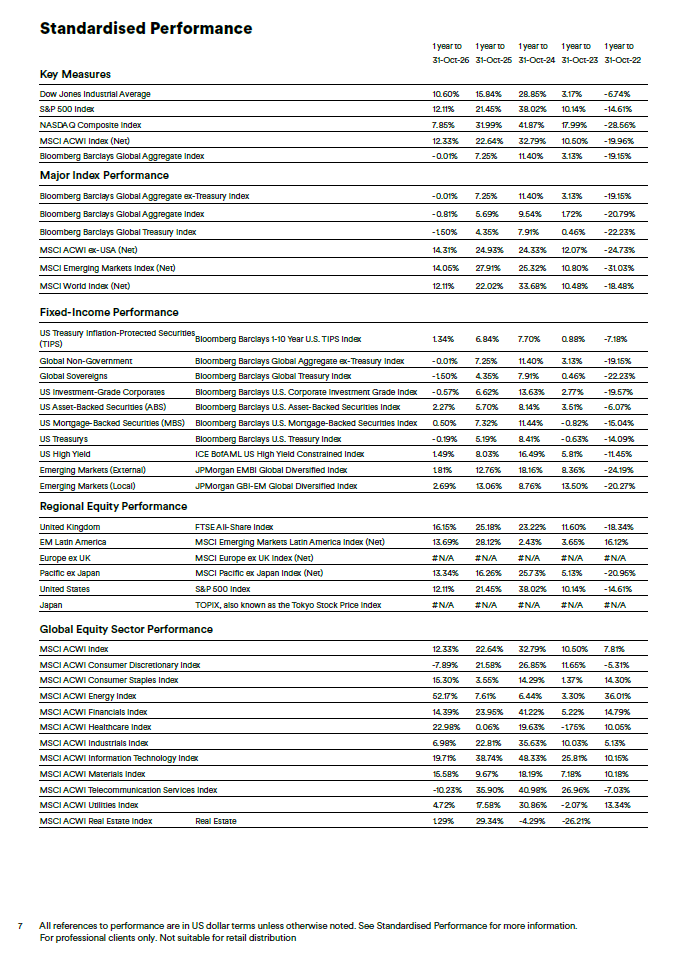
Global equities, as measured by the MSCI ACWI Index, finished in negative territory in October 2026; however, there was a dichotomy in performance among regional markets. Developed markets, most notably Europe, posted gains for the month, while there were sharp downturns in emerging markets. Value-oriented sectors of the market outperformed technology and growth stocks.
The Europe ex EMU (European Economic and Monetary Union (eurozone)) and Nordic countries were the top performers among developed markets in October, bolstered by robust performance in Norway and Denmark. Additionally, the Pacific ex Japan region benefited from a market upturn in Australia. In contrast, the Far East region was hampered by weakness in Singapore and Japan. The Latin America ex Brazil region was the leader among the emerging markets for the month due to strength in Mexico and Columbia, while Eastern Europe’s strong performance was attributable to market rallies in the Czech Republic and Hungary. The Far East region was the primary emerging-market laggard due to downturns in Korea and China. Stocks listed on the Hong Kong and China exchanges, as represented by the MSCI Hong Kong-Listed Southbound + China A Index, also lost ground during the month.
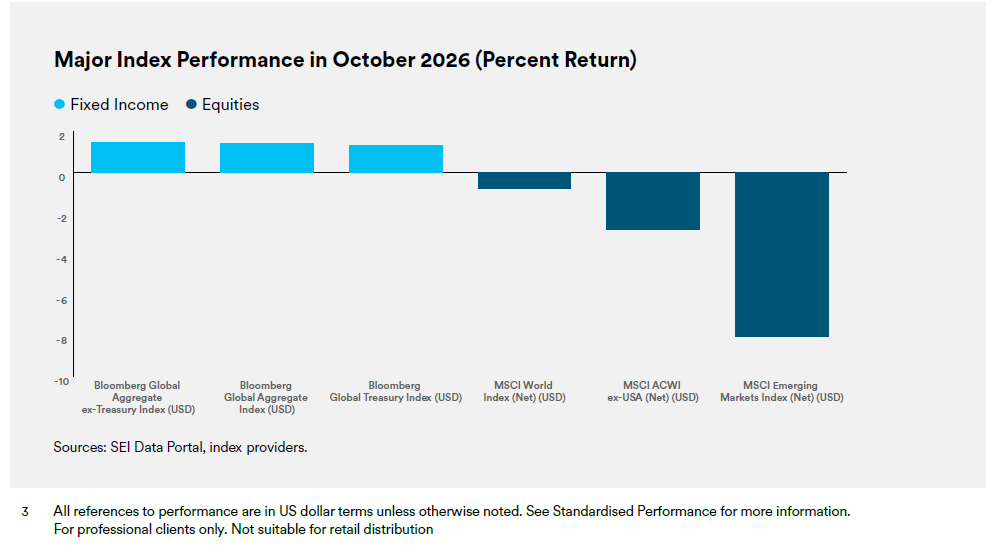
Global fixed-income assets, as measured by the Bloomberg Global Aggregate Bond Index, were up 1.4% in October. Yields declined in response to softer-than-expected U.S. personal income and spending data, as well as rising demand for high-quality bonds amid concerns about the sustainability of artificial intelligence (AI)-related spending. U.S. Treasury yields moved lower for all maturities of three months or greater in October. Yields on 2-, 3-, 5, and 10-year Treasury notes fell 032%, 0.35% , 0.38%, and 0.35%, ending the month at 4.56%, 4.65%, 4.71%, and 4.94%, respectively. The 10-year to 3-month yield curve narrowed by 31 basis points (0.31%) to +078% as of the end of October.
Global commodity prices, as represented by the Bloomberg Commodity Index, dipped 0.4% in October, as oil-price gains were offset by weakness in other commodity markets. The West Texas Intermediate (WTI) and Brent crude oil prices climbed 15.2% and 15.7%, respectively, during the month as escalating Middle East tensions, including attacks on commercial shipping and energy infrastructure, heightened concerns about potential disruptions to global oil supplies. Tight inventories and uncertainty surrounding Russian energy supplies provided additional support for crude prices. The gold price was down 6.9% over the month amid persistent inflation and elevated oil prices, which bolstered expectations that interest rates would remain higher for longer, reducing the appeal of the non-yielding metal. The New York Mercantile Exchange (NYMEX) natural gas price fell 4.2% in October as warmer-than-normal weather forecasts reduced expectations for heating demand heading into the winter season. Strong U.S. production also had a negative impact, outweighing support from strong demand for liquefied natural gas (LNG) exports. The 10.7% downturn in the wheat price during the month was attributable to an improving outlook for global supply and weak U.S. export demand, offsetting concerns about supply disruptions in the Black Sea. Expectations for increased Russian exports and favorable crop prospects in several major wheat-producing countries also weighed on the market.
The ongoing Middle East conflict dominated the geopolitical news again in October. Efforts to reopen the Strait of Hormuz gained momentum as Iran’s ability to disrupt regional oil flows weakened. Increased tanker traffic, the partial restoration of alternative export routes, and the U.S. blockade of Iranian oil exports reduced Tehran’s negotiating leverage, although attacks on commercial shipping and regional energy infrastructure continued to threaten stability.
At the same time, tensions remained elevated as Iran strengthened defenses around key military and nuclear sites and warned of a broader response to renewed U.S. military action. Attacks near Qatar and against targets in Saudi Arabia raised concerns that the conflict could spread beyond the Strait, complicating diplomatic efforts and increasing the risk of renewed U.S.-Iran hostilities.
Elsewhere, the Russia-Ukraine war intensified in October as Moscow launched large-scale missile and drone attacks against Ukrainian cities, energy infrastructure, and transportation networks, including strikes that killed at least 32 people on 7 October and 14 civilians at a railroad station in the city of Dnipro on 29 October. Ukraine subsequently conducted a major retaliatory drone assault on Russia. Nevertheless, diplomatic activity indicated some progress: Russia and Ukraine agreed to a temporary, U.S.-brokered ceasefire around the Russian-occupied city of Oleshky to permit humanitarian aid and civilian evacuations, while the two sides signaled that U.S.-mediated peace negotiations could resume in November. However, continued attacks outside the limited ceasefire zone, unresolved territorial demands, and strains between the U.S. and Ukraine highlighted the substantial obstacles to a broader settlement.
Economic data
U.S.
The Department of Labor reported that the consumer-price index (CPI) was up 0.6% in September, an increase from the 0.4% rise in August, in line with expectations. Fuel oil and gasoline prices climbed 15.3% and 9.1%, respectively, in September, while costs for food at home edged down 0.1%. The CPI advanced 3.7% year-over-year, up from the 3.4% annual increase in August and slightly above expectations. Prices for fuel oil and gasoline surged 74.2% and 34.2%, respectively, over the previous 12-month period. Core inflation, as measured by the CPI for all items less food and energy, rose 2.6% year-over-year in September, a modest upturn from the 2.4% annual increase in August.
According to the advance estimate from the U.S. Bureau of Economic Analysis, U.S. real gross domestic product (GDP) increased at a greater-than-expected annual rate of 3.4% in the third quarter, up from the 2.2% growth rate in the second quarter. Growth in third-quarter GDP reflected increases in nonresidential fixed investment (purchases of both nonresidential structures and equipment and software), consumer spending, and government spending. These gains were partly offset by a decrease in exports and an increase in imports, which are subtracted in the calculation of GDP. The acceleration in the growth rate from the second quarter reflected upturns in nonresidential fixed investment and government spending.
U.K.
The Office for National Statistics (ONS) reported that inflation in the U.K., as measured by the CPI, rose 0.4% in September, down marginally from the 0.5% increase in August. Costs for clothing and footwear, and education increased 2.2% and 1.4%, respectively, for the month, while prices for transportation, alcohol and tobacco, and food and non-alcoholic beverages fell by corresponding margins of 0.4%, 0.3%, and 0.2%. The CPI advanced at an annual rate of 3.5% in September, up from the 3.1% upturn in August. Transportation, communication, and housing and household services posted the largest price gains for the month, rising 6.6%, 5.8%, and 5.3%, respectively.
The ONS also announced that U.K. GDP grew 0.7% for the three-month period ending 31 August, 2026 (the most recent reporting period), modestly higher than the 0.5% increase during the previous three-month period 1 (May 1 to 31 July). Output in the services sector rose 0.9% for the period ending 31 August, while activity in the construction and production sectors declined 1.0% and 0.2%, respectively.
Eurozone
Eurostat pegged inflation for the eurozone at 3.8% for the 12-month period ending in September, up sharply from the 3.2% annual increase in August. Energy prices surged 18.9% year-over-year in September due to the ongoing blockade in the Strait of Hormuz, affecting a significant amount of global oil capacity, and costs for unprocessed food and tobacco rose by corresponding margins of 4.0% and 3.8% compared to the same period in 2025.
According to Eurostat, eurozone GDP grew 0.5% in the third quarter of 2026, a slight decrease from the 0.7% growth rate for the second quarter of the year. The upturn in GDP for the third quarter was attributable largely to the economy of Ireland, which expanded 5.5%, while Estonia and the Netherlands each posted 0.6% growth. Conversely, GDP for Lithuania and France decreased 1.0% and 0.1%, respectively, over the quarter.
SEI’s view
Out of precaution over inflation (given AI-buildout demands and higher energy and related prices arising from wars in the Middle East and Eastern Europe)—numerous central banks have raised interest rates in recent months. However, by almost any measure, financial conditions are still quite accommodative. The Bank of Canada raised its policy rate by 0.25% to 2.50% at its 28 October meeting. Although the Federal Reserve and the European Central Bank voted to maintain their respective benchmark rates at their October meetings, both policymakers left open the possibility of future rate hikes amid sticky inflation. If inflation is supported by fiscal demand, regional supply chains, demographics, and energy constraints, productivity can help margins and growth, but it does not automatically return inflation to central banks’ 2% target rate.
Regarding the labour market, a maxed-out participation rate (the proportion of the working-age population that is either employed or actively seeking employment) with a declining number of working-age people is likely to create serious labour-supply pressures in the years and decades ahead. Of course, it’s important to note that demographics, while slow-moving, aren’t set in stone. For example, while Japan and South Korea are seeing early signs of success incentivizing higher marriage and fertility rates, it’s taken some serious financial incentives. We expect the implementation of policy measures aimed at slowing or reversing this trend to be a recurring theme. These policies could put additional pressures on government budget deficits in a growing number of advanced economies—if not in this decade, then perhaps the next. But slowing, much less reversing, this trend will take political will, well-designed incentives, and time.
As long as economic activity remains robust (even if somewhat narrow), supply pressures (including within the labour market) pose important risks to the inflation outlook. The underlying dynamics can be complex, but the investment upshots are straightforward. We maintain our focus on taking advantage of diversification benefits but also remain attuned to the economic environment (including inflation!) and its likely winners and losers. We also believe that investors should be appropriately selective in an environment that looks notably different from the one that has prevailed for most of this century.
1 All equity market performance statements are based on the MSCI ACWI Index.
2 According to the U.S. Department of the Treasury. As of 30 October 2026.
3 According to the ONS. 21 October 2026.
4 According to the ONS. 15 October 2026.
5 According to Eurostat. 16 October 2026.
6 According to Eurostat. 30 October 2026.
7 See, for example, Heesu Lee, “South Korea’s baby bump extends into second year, offering hope,” The Japan Times, February 25, 2026, available at: https://www.japantimes.co.jp/news/2026/02/25/asia-pacific/society/south-korea-babies-second-year, accessed October 1, 2026, and Jenni Fink, “Map shows countries paying people to have babies as birth rate drops,” Newsweek, August 25, 2026, available at https://www.newsweek.com/map-shows-countries-paying-people-to-have-babies-as-birth-rate-drops-12363970,accessed October 1, 2026.
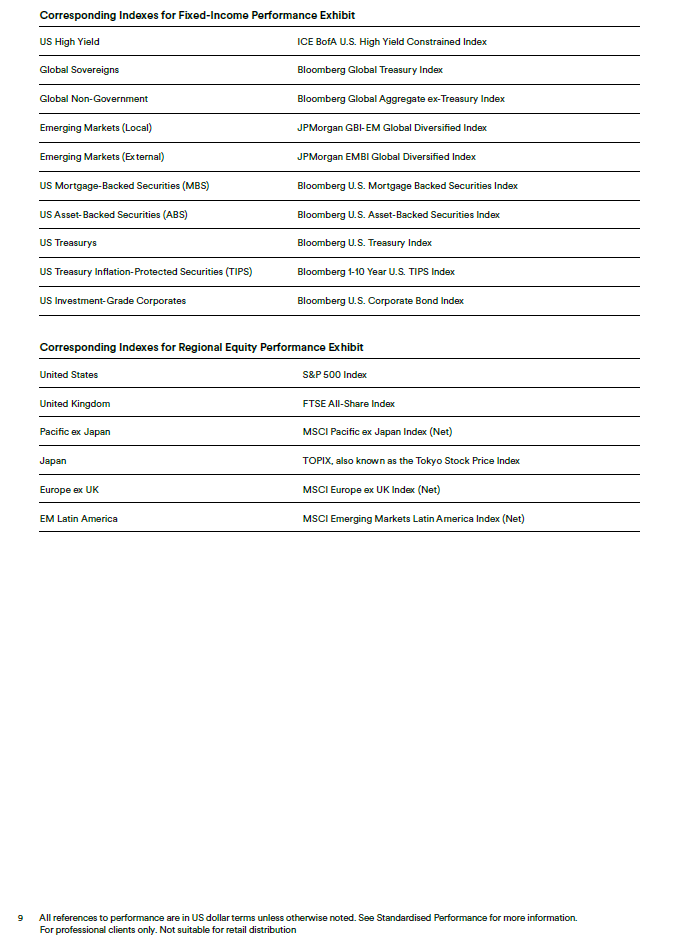
GLOSSARY AND INDEX DEFINITIONS
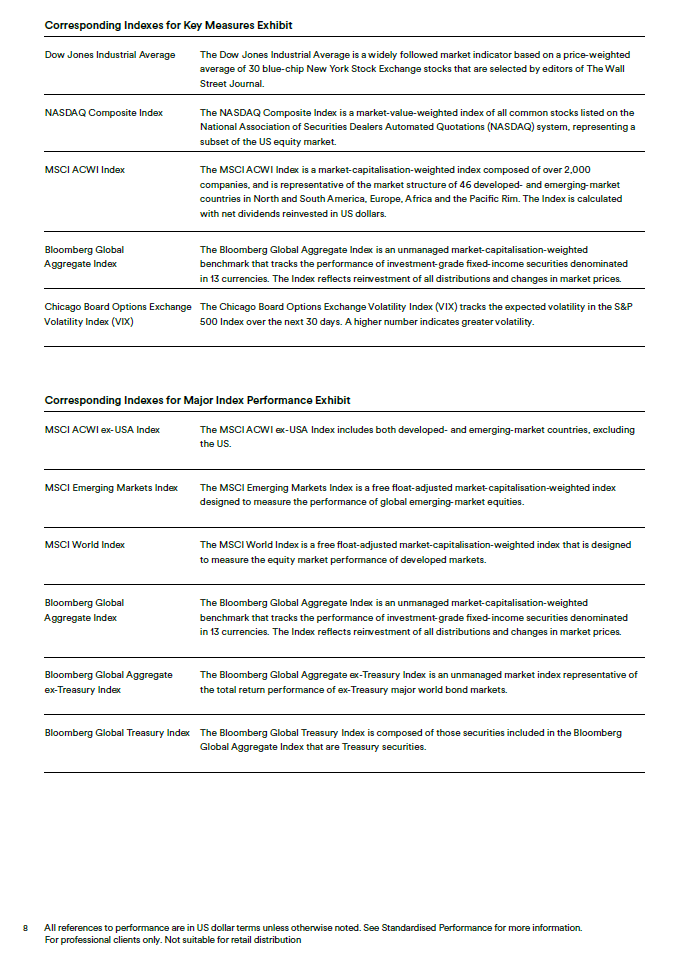
For financial term and index definitions, please see: seic.com/ent/imu-communications-financial-glossary
IMPORTANT INFORMATION
This material represents an assessment of the market environment at a specific point in time and is not intended to be a forecast of future events or a guarantee of future results. Positioning and holdings are subject to change. All information as of the date indicated.
This information should not be relied upon by the reader as research or investment advice, (unless you have otherwise separately entered into a written agreement with SEI for the provision of investment advice) nor should it be construed as a recommendation to purchase or sell a security. The reader should consult with their financial professional for more information. Statements that are not factual in nature, including opinions, projections and estimates, assume certain economic conditions and industry developments and constitute only current opinions that are subject to change without notice. Nothing herein is intended to be a forecast of future events, or a guarantee of future results.
Certain economic and market information contained herein has been obtained from published sources prepared by other parties, which in certain cases have not been updated through the date hereof. While such sources are believed to be reliable, neither SEI nor its affiliates assumes any responsibility for the accuracy or completeness of such information and such information has not been independently verified by SEI.
There are risks involved with investing, including loss of principal. The value of an investment and any income from it can go down as well as up. Investors may get back less than the original amount invested. Returns may increase or decrease as a result of currency fluctuations. Past performance is not a reliable indicator of future results. Investment may not be suitable for everyone.
This material is not directed to any persons where (by reason of that person's nationality, residence or otherwise) the publication or availability of this material is prohibited. Persons in respect of whom such prohibitions apply must not rely on this information in any respect whatsoever.
The information contained herein is for general and educational information purposes only and is not intended to constitute legal, tax, accounting, securities, research or investment advice regarding the strategies or any security in particular, nor an opinion regarding the appropriateness of any investment. This information should not be construed as a recommendation to purchase or sell a security, derivative or futures contract. You should not act or rely on the information contained herein without obtaining specific legal, tax, accounting and investment advice from an investment professional. While considerable care has been taken to ensure the information contained within this document is accurate and up-to-date, no warranty is given as to the accuracy or completeness of any information and no liability is accepted for any errors or omissions in such information or any action taken on the basis of this information.
Index returns are for illustrative purposes only, and do not represent actual account performance. Index returns do not reflect any management fees, transaction costs or expenses. Indexes are unmanaged and one cannot invest directly in an index. Not all strategies discussed may be available for your investment.
Information issued in the UK by SEI Investments (Europe) Ltd, 1st Floor, Alphabeta, 14-18 Finsbury Square, London EC2A 1BR which is authorised and regulated by the Financial Conduct Authority.
The contents of this document have not been reviewed by any regulatory authority in Hong Kong. You are advised to exercise caution in relation to the offer. If you are in any doubt about any of the contents of this document, you should obtain independent professional advice.
This information is made available in Latin America and the Middle East FOR PROFESSIONAL (non-retail) USE ONLY by SIEL.
Any questions you may have in relation to its contents should solely be directed to your Distributor. If you do not know who your Distributor is, then you cannot rely on any part of this document in any respect whatsoever.
For institutional and professional investor use only. Not for public distribution. This material is provided for general information and educational purposes only and does not constitute financial advice as contemplated in the Financial Advisory and Intermediary Services Act, 2002, nor a recommendation, offer or solicitation to buy or sell any financial product. It has not been prepared with regard to the investment objectives, financial situation or particular needs of any individual investor. Past performance is not a guarantee of future results. Investing involves risk, including the possible loss of principal. Issued in South Africa by SEI Investments (Europe) Ltd, an authorised financial services provider (FSP No. 9796). Certain underlying investment commentary may be prepared by SEI Investments Management Corporation or other SEI affiliates. Investors should obtain appropriate professional advice before making an investment decision.
This information is provided for general informational purposes only and is intended solely for institutional investors and other persons who may lawfully receive it under applicable Singapore laws and regulations. It is not directed at retail investors. Nothing contained herein constitutes an offer, solicitation, recommendation or invitation to subscribe for, purchase, sell or hold any investment, financial product or service. The availability of any investment strategy, fund or service in Singapore is subject to applicable Singapore laws and regulations.
SIEL is not licensed under Israel’s Regulation of Investment Advising, Investment Marketing and Portfolio Management Law, 5755-1995 (the “Advice Law”) and does not carry insurance pursuant to the Advice Law. This document and any of the SEI Funds mentioned herein have not been approved by the Israeli Securities Authority (the “ISA”).
For professional clients only. Not suitable for retail distribution.