Monthly Market Commentary: The economics of optimism.
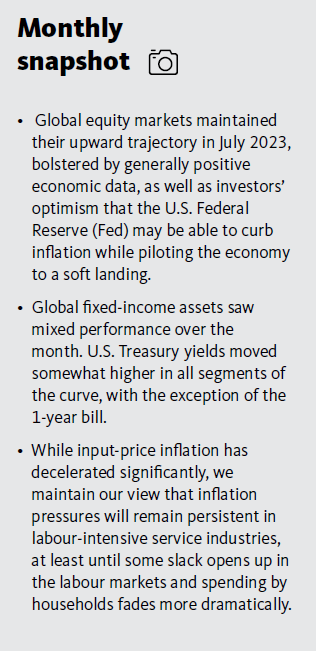
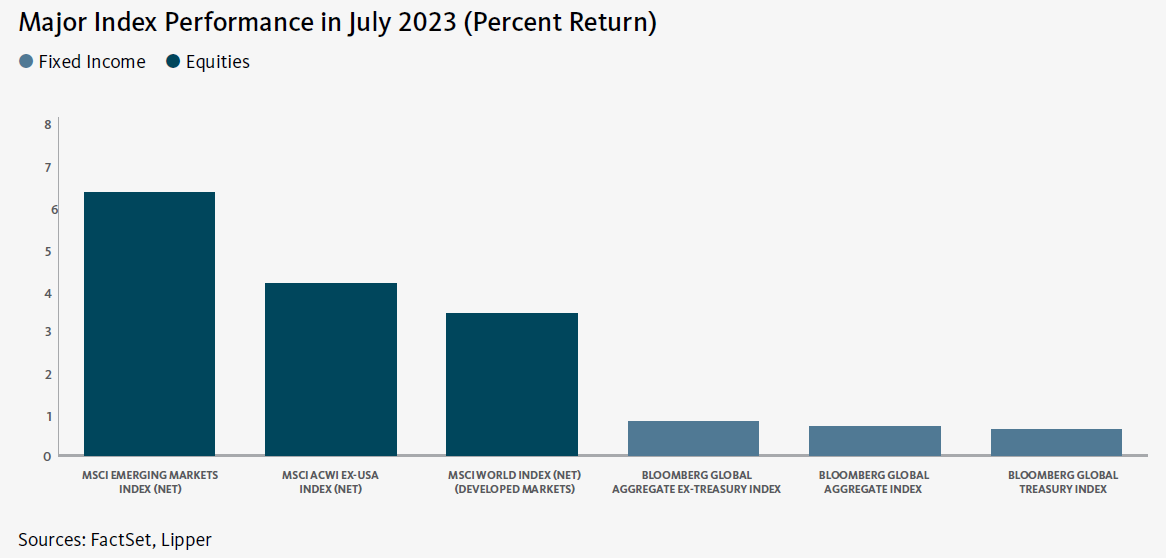
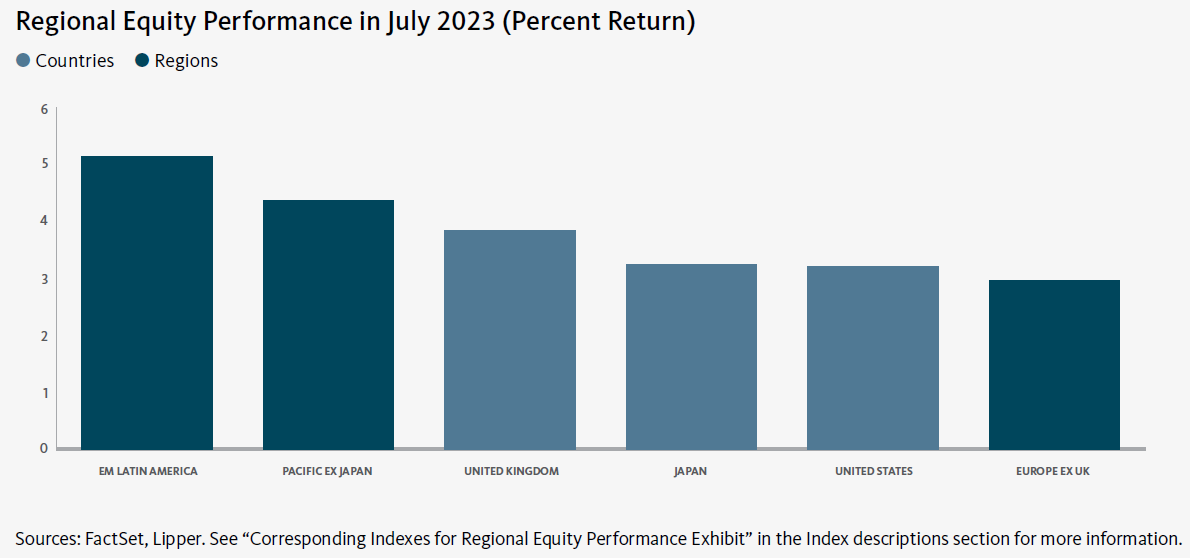
Global equity markets maintained their upward trajectory in July 2023, bolstered by generally positive economic data, as well as investors’ optimism that the Fed may be able to curb inflation while piloting the economy to a soft landing. Emerging markets outperformed developed markets during the month.
The Pacific ex Japan region was the top performer among developed markets in July, bolstered mainly by strength in Singapore. The Nordic countries lagged the overall market due to weakness in Finland. Africa led the emerging markets during the month, benefiting from strong performance in South Africa and Senegal. The Gulf Cooperation Council (GCC) countries–Bahrain, Kuwait, Oman, Qatar, Saudi Arabia, and United Arab Emirates–were the primary laggards among the emerging markets in July, hampered largely by underperformance in Oman.1
As widely expected, the Fed increased the federal-funds rate by 25 basis points (0.25%) to a range of 5.25%-5.50% at its meeting in late July after pausing in its rate-hiking cycle in June. In a statement announcing the increase, the Federal Open Market Committee (FOMC) reiterated its commitment to reduce inflation to its 2% target rate and commented that it would “adjust the stance of monetary policy as appropriate if risks emerge that could impede the attainment of the Committee’s goals.” The FOMC also noted that the members “will take into account a wide range of information,
including readings on labour market conditions, inflation pressures and inflation expectations, and financial and international developments.” At a news conference following the release of the rate-hike announcement, Fed Chair Jerome Powell said, “We can afford to be a little patient, as well as resolute, as we let this unfold. We think we’re going to need to hold, certainly, policy at restrictive levels for some time, and we’d be prepared to raise [interest rates] further if we think that’s appropriate.”
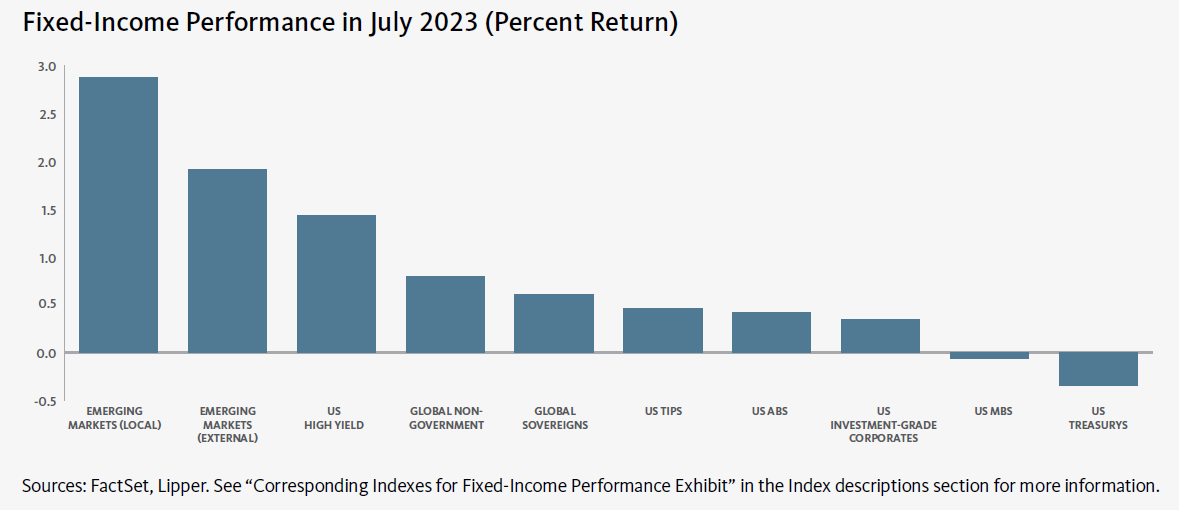
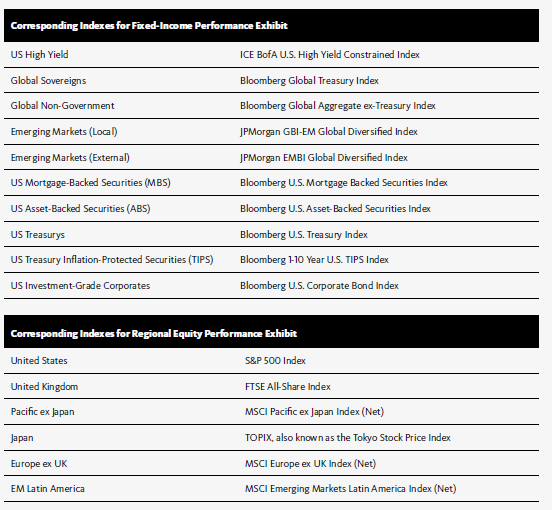
Global fixed-income assets saw mixed performance in July. High-yield and corporate bonds registered positive returns and were the top performers within the U.S. market for the period. 2 Mortgage-backed securities (MBS) and U.S. Treasurys saw modest declines.3 U.S. Treasury yields moved somewhat higher in all segments of the curve, most notably in the long end, with the exception of the 1-year bill, which dipped 0.03%. The yields on 2-, and 3-, 5-, and 10-year notes rose 0.01%, 0.02%, 0.05%, and 0.16%, respectively, in July. The spread between 10- and 2-year notes narrowed from -1.06% to -0.91% during the month, and the yield curve remained inverted.
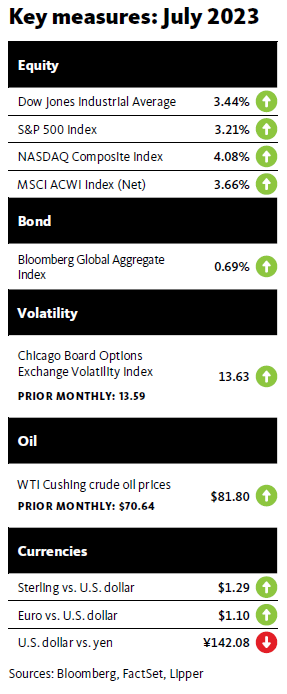
Global commodity prices generally moved higher in July. The West Texas Intermediate (WTI) crude-oil spot price and the Brent crude oil price gained 15.8% and 13.3%, respectively, in U.S. dollar terms, amid expectations of dwindling supplies due to production output cuts from the Organization of the Petroleum Exporting Countries (OPEC). The gold spot price was up 4.1% for the month due to weakness in the U.S. dollar and investors’ speculation that the Fed may pause its rate-hiking cycle at its meeting in September. Following a sizeable upturn in June, the New York Mercantile Exchange
(NYMEX) natural gas price declined 5.1% in July after the International Energy Agency (IEA) estimated that demand for natural gas in Europe will fall 7% for the 2023 calendar year. The IEA attributed its forecast to lower consumption in the power sector and rapidly expanding renewable energy-generation.4
Wheat prices climbed sharply in mid-July after Russia withdrew from an agreement to export Ukrainian grain through the Black Sea. The plan had authorised Ukraine to export roughly 33 million metric tons (36 million tons) of food by sea since August 2022. More than half of the exports were being delivered to emerging markets. The U.S. and its allies condemned Russia’s pullout from the agreement. U.S. Secretary of State Anthony Blinken stated, “The result of Russia’s action today weaponizing food, using it as a tool, as a weapon, in its war against Ukraine, will be to make food harder to come by in places that desperately need it.”5 The wheat price subsequently fell later in the month amid some profit-taking by investors and as more grain flowed out of the country via land routes and the Danube River.6 The wheat price ended the month with a 2.3% gain.
In contrast to inflationary worries in most global economies, there are concerns that China may be experiencing a bout of deflation. According to the National Bureau of Statistics of China, the nation’s consumer-price index (CPI) dipped 0.2% in June, and was flat compared to the same period in 2022. Food and consumer goods prices were down 0.5% and 0.3%, respectively, for the month. The 2.0% year-over-year increase in costs for food, tobacco and liquor was offset by a 6.5% decline in transportation and telecommunications prices. Additionally, China’s producer-price index (PPI), which tracks the average change over time in selling prices received by domestic producers of manufactured goods, declined 5.4% year-over-year in June. Prices for the mining, raw materials, and processing industries fell by 16.2%, 9.5%, and 4.7%, respectively, during the previous 12-month period.
Economic data
U.S.
According to the initial estimate from the Department of Commerce, U.S. gross domestic product (GDP) grew at a greater-than-expected annualised rate of 2.4% in the second quarter of 2023, up from the 2.0% rise in the first three months of the year. The largest increases for the second quarter were in consumer spending, nonresidential fixed investment (purchases of both nonresidential structures and equipment and software), and state and local government spending. These gains offset reductions in exports and residential fixed investment (purchases of private residential structures and residential equipment that property owners use for rentals). The government attributed the accelerated GDP growth rate to upturns in private inventory investment (a measure of the changes in values of inventories from one time period to the next) and nonresidential fixed investment.
The Department of Labor reported that U.S. payrolls expanded by 209,000 in June, and the unemployment rate dipped 0.1 percentage point to 3.6%. Although the job growth for the month fell short of the market’s expectations, the unemployment rate remained near its historical low of 3.4% reached in April of this year. The government, health care, and social assistance sectors saw the largest employment gains in June. Conversely, payrolls in the retail trade, and transportation and warehousing sectors declined modestly during the month. Average hourly earnings were up 0.4% in June and 4.4% year-over-year. The 12-month increase was marginally lower than the 4.5% annual rise in May.
Inflation in the U.S. has continued to moderate. The Department of Labor reported that the U.S. consumer-price index (CPI) increased 0.2% in June, a slight uptick from the 0.1% rise in May. The CPI posted a year-over-year gain of 3.0%—the smallest annual increase since March 2021, and sharply lower than the 4.0% annual rise during the previous month. Nonetheless, the inflation rate still exceeds the Fed’s 2% target. The slowing pace of inflation over the previous 12-month period was due to sharp declines in prices for fuel oil and gasoline, while food costs rose 0.2% in May and 6.7% year-over-year. Meanwhile, core inflation, as measured by the CPI for all items less food and energy, increased 0.2% in June, down from the 0.4% rise in May. The index was up 4.8% over the previous 12 months—significantly lower than the 5.3% year-over-year increase in May.
The Conference Board’s Consumer Confidence Index® rose 6.9 points to 117.0 in July-its highest level in two years, according to the Conference Board-suggesting that consumers remain optimistic about the U.S. economy. The Expectations Index, an indicator of consumers’ short-term outlook for income, business, and labour market conditions, climbed 8.3 points to 88.3 during the month. A reading above 80 indicates not that consumers generally believe that there will not be a recession in the U.S. over the next 12 months. The Present Situation Index, which reflects U.S. consumers’ views of current conditions in the business and labour markets, was up 4.7 points to 160.0 in July. The Conference Board noted that “confidence appears to have broken out of the sideways trend that prevailed for much of the last year. Greater confidence was evident across all age groups, and among both consumers earning incomes less than $50,000 and those making more than $100,000.”
U.K.
According to the Office for National Statistics (ONS), consumer prices in the U.K. rose 0.2% month-over-month in June, down from the 0.7% increase in May. Inflation increased 7.3% over the previous 12-month period, down 0.6% from the 7.9% annual upturn in May. Food and non-alcoholic beverages, and restaurants and hotels, were the most notable contributors to the annual rise in prices. Core inflation, which excludes volatile food prices, rose at an annual rate of 6.4% in June, marginally lower than the 6.5% year-over-year increase in for the previous month.
The ONS also reported that U.K. GDP dipped 0.1% in May, down from a 0.2% increase in April, and was flat over the previous three-month period. Production and construction fell 0.6% and 0.2%, respectively, in May, versus corresponding 0.2% and 0.9% declines in April.
The S&P Global/CIPS Flash UK Manufacturing Output Index decreased 1.6 to a seven-month low of 46.5 in July due to lower demand, along with customer destocking (a planned reduction in stock or inventory). A reading below 50 indicates contraction in the manufacturing sector.
The S&P Global/CIPS Flash UK Services PMI Business Activity Index declined 2.2 to a five-month low of 51.5 in June, but indicated expansion for the fifth consecutive month. The slowdown in the rate of growth resulted mainly from weaker residential property market conditions, as well as a decrease in consumer spending.
Eurozone
Eurostat estimated that the inflation rate in the eurozone fell 0.2% to 5.3% for the 12-month period ending in July. Energy prices decreased 5.6% yearover- year in June, following a 1.8% decline in May. Prices for food, alcohol and tobacco rose 10.8%, but the pace of acceleration slowed from the 11.6% annual rate in June. Core inflation, which excludes volatile energy and food prices, rose 5.5% for the month, unchanged from June.7
Eurozone manufacturing remained in contraction territory in July, with the HCOB Flash Eurozone Manufacturing PMI Output Index falling 1.3 to 42.9— its lowest level in more than three years. The downturn was attributable primarily to a decline in new orders.
Services activity in the eurozone expanded in June, but the HCOB Flash Eurozone Services PMI Business Activity Index dipped 0.9 to a six-month low of 51.1.
According to Eurostat’s initial estimate, eurozone GDP was up 0.3% in the second quarter of 2023, improving from the flat growth rate in the first quarter, and increased 0.6% year-over-year. The economies of Ireland and Lithuania were the strongest performers for the second quarter, expanding 3.3% and 2.8%, respectively, while Sweden’s GDP contracted 1.5% during the period.
Central banks
The Fed increased the federal-funds rate by 0.25% to a range of 5.25% to 5.50% following its meeting in late July. There was speculation that the Fed may need to implement additional rate hikes in order to cool inflation given the ongoing strength in the U.S. economy. As of the end of July, CME’s FedWatch Tool–which provides a gauge of the markets’ expectations of potential changes to the federal-funds target rate while assessing potential Fed monetary policy actions at Federal Open Market Committee (FOMC) meetings–implied an 82% chance that the FOMC will leave the federal-funds rate unchanged at its meeting on September 19-20. The FedWatch Tool projected an 18% probability that the central bank will approve a 0.25% rate hike.
In the Bank of England’s (BOE) Financial Stability Report (FSR), which was released in July, the Financial Policy Committee (FPC) noted that U.K. banks are well-capitalised and maintain strong asset quality. However, the FPC also commented that some segments within the banking sector are more exposed to credit losses as borrowing costs rise, most notably commercial real estate lenders. The FPC stated that global commercial real estate markets “face a number of short and longer-term headwinds that are pushing down on prices and making refinancing challenging.”
The European Central Bank (ECB) increased its benchmark interest rate by 0.25% to 4.25% following its meeting on July 27. In a statement announcing the rate hike, the ECB’s Governing Council noted, “The developments since the last meeting support the expectation that inflation will drop further over the remainder of the year but will stay above target for an extended period. While some measures show signs of easing, underlying inflation remains high overall. The past rate increases continue to be transmitted forcefully: financing conditions have tightened again and are increasingly dampening demand, which is an important factor in bringing inflation back to target [2%].”
The Bank of Japan (BOJ) left its benchmark interest rate unchanged at -0.1% at its meeting on July 28. However, the central bank altered its yield curve control policy. While the BOJ will continue to allow the 10-year Japanese government bond (JGB) yield to fluctuate in a range of around +0.5% to -0.5% from its 0% target, the central bank indicated that this is now a suggested range. The BOJ set a rigid upper yield limit of 1.0% for the 10-year JGB. The 10-year yield rose sharply following the BOJ’s announcement, and ended July with a 0.20% increase to 0.60%—the highest level since April 2014.8
SEI’s view
Economists have been spending much of their time this year arguing when or if economic growth, inflation, corporate profits, interest rates, and equities will peak. Optimists and pessimists alike have been confounded by the ebb and flow of the data and the gyrations of the financial markets. Waiting for a decisive break in the U.S. economy, for example, has been akin to “waiting for Godot.”9
In general, input-price inflation has decelerated significantly. Canada’s industrial producer price index registered an outright decline in its price level, with a year-over-year change of -5.5% through June.10 The eurozone’s producer-price index (PPI) has witnessed the sharpest deceleration, falling from a peak year-over-year rate of 43% through August 2022 to a May 2023 reading of just 1.9%. By contrast, the improvement in producer prices has been less dramatic in Japan (still rising at a 4.1% year-over-year pace as of June), although the country has logged a steep deceleration from earlier this year. We believe that these year-over-year PPI inflation readings should continue to show improvement in the months immediately ahead owing to favorable base effects.
The good news at the corporate level is feeding only slowly down to the consumer. This is especially true for core inflation, which excludes food and energy prices. Inflation cooled somewhat in the U.K. in July, but slightly accelerated in Japan. Improvement in the U.S. and the euro area has been modest, with annual core inflation running at 4.8% and 3.7%, respectively, in June. Only Canada has recorded significant progress in its core inflation rate, declining from 6.0% in June 2022 to 2.8% as of June 2023.11
On a longer-term basis, we believe that demographic shifts are likely to keep labour markets tighter than has been the case at any point since the baby boomers—who were born between 1946 and 1964—first made their presence felt in the workforce in the 1970s. The new focus on supply-chain resiliency, reduced dependence on China as a manufacturing hub, the transition away from relatively cheap fossil-fuel energy to greener but more expensive sources of power, and the likelihood of significantly higher corporate taxes and financing costs in the years ahead, all suggest to us that inflation will tend to settle at 3% or more in advanced industrial economies instead of the previous norm of 2% or less.
Persistent inflation and ongoing labour-market tightness have forced most major developed-country central banks to keep raising their benchmark interest rates. The Fed, the Bank of Canada, and the ECB already have benchmark rates that match or exceed the peak recorded in 2008.12 We think it’s likely that the BOE will soon join this group.
SEI does not dispute the fact that inflation will continue to decelerate, especially given the current weakness in energy and goods prices. It is only a question of timing and end point. We maintain our view that inflation pressures will remain persistent in labour intensive service industries, at least until some slack opens up in the labour markets and spending by households fades more dramatically.
The rally in U.S. equities broadened in July, but the valuation in the market remains problematic. The price-to-earnings ratio of the broad-market S&P 500 Index has been on the rise this year, recently reaching 19.6 times analysts’ estimated earnings for the next 12 months.13 This expansion in the multiple on forward earnings has occurred despite the additional monetary tightening by the Fed and other central banks. Furthermore, this upturn in expected forward earnings over the next 12 months is not likely to last if a recession materialises later this year or in 2024. The overall market also appears to be overvalued relative to today’s bond yields. If earnings experience a substantial contraction, history suggests that stock valuations also will fall.
Important Information
The information contained herein is for general and educational information purposes only and is not intended to constitute legal, tax, accounting, securities, research or investment advice regarding the Strategies or any security in particular, nor an opinion regarding the appropriateness of any investment. This information should not be construed as a recommendation to purchase or sell a security, derivative or futures contract. You should not act or rely on the information contained herein without obtaining specific legal, tax, accounting and investment advice from an investment professional. This material represents an assessment of the market environment at a specific point in time and is not intended to be a forecast of future events, or a guarantee of future results. There is no assurance as of the date of this material that the securities mentioned remain in or out of the SEI Strategies. Positioning and holdings are subject to change. All information as of 31 July 2023.
Information contained herein that is based on external sources or other sources is believed to be reliable, but is not guaranteed by SEI, and the information may be incomplete or may change without notice. This document may not be reproduced, distributed to another party or used for any other purpose.
There are risks involved with investing, including loss of principal. Diversification may not protect against market risk. There may be other holdings which are not discussed that may have additional specific risks. Narrowly focused investments and smaller companies typically exhibit higher volatility. International investments may involve risk of capital loss from unfavourable fluctuation in currency values, from differences in generally accepted accounting principles or from economic or political instability in other nations. Emerging markets involve heightened risks related to the same factors, in addition to those associated with their relatively small size and lesser liquidity. Bonds will decrease in value as interest rates rise. High-yield bonds involve greater risks of default or downgrade and are more volatile than investment grade securities, due to the speculative nature of their investments. SEI products may use derivative instruments such as futures, forwards, options, swaps, contracts for differences, credit derivatives, caps, floorsnand currency forward contracts. These instruments may be used for hedging purposes and/or investment purposes.
While considerable care has been taken to ensure the information contained within this document is accurate and up-to-date, no warranty is given as to the accuracy or completeness of any information and no liability is accepted for any errors or omissions in such information or any action taken on the basis of this information.
The value of an investment and any income from it can go down as well as up. Investors may get back less than the original amount invested. Returns may increase or decrease as a result of currency fluctuations. Past performance is nota reliable indicator of future results. Investment may not be suitable for everyone. If you should have any doubt whether it is suitable for you, you should obtain expert advice.
Index returns are for illustrative purposes only, and do not represent actual account performance. Index returns do not reflect any management fees, transaction costs or expenses. Indexes are unmanaged and one cannot invest directly in an index. Not all strategies discussed may be available for your investment.
This material is not directed to any persons where (by reason of that person’s nationality, residence or otherwise) the publication or availability of this material is prohibited. Persons in respect of whom such prohibitions apply must not rely on this information in any respect whatsoever.
The views and opinions within this document are of SEI only and are subject to change. They should not be construed as investment advice.
The views contained herein are not to be taken as advice or a recommendation to buy or sell any investment in any jurisdiction. Our outlook contains forward-looking statements that are judgments based upon our current assumptions, beliefs and expectations. If any of the factors underlying our current assumptions, beliefs or expectations change, our statements as to potential future events or outcomes may be incorrect. We undertake no obligation to update our forward looking statements.
This information is issued by SEI Investments (Europe) Ltd (“SIEL”) 1st Floor, Alphabeta, 14-18 Finsbury Square, London EC2A 1BR, United Kingdom.
The SEI Global Assets Fund Plc, SEI Global Investments Fund Plc, and SEI Global Master Fund Plc (the “SEI UCITS Funds”) are structured as open-ended collective investment schemes and are authorised in Ireland by the Central Bank as a UCITS pursuant to the UCITS Regulations. The SEI UCITS Funds are managed by SEI Investments, Global Ltd (“SIGL”). SIGL has appointed SEI Investments (Europe) Ltd (“SIEL”) to provide general distribution services in relation to the SEI UCITS Funds either directly or through the appointment of other sub-distributors. The SEI UCITS Funds may not be marketed to the general public except in jurisdictions where the funds have been registered by the relevant regulator. The matrix of the SEI UCITS fund registrations can be found here:
seic.com/GlobalFundRegistrations.
No offer of any security is made hereby. Recipients of this information who intend to apply for shares in any SEI UCITS Fund are reminded that any such application may be made solely on the basis of the information contained in the Prospectus. Please refer to our latest Prospectus (which includes information in relation to the use of derivatives and the risks associated with the use of derivative instruments), Key Investor Information Document, Summary of UCITS Shareholder rights (which includes a summary of the rights that shareholders of our funds have) and the latest Annual or
Semi-Annual Reports for more information on our funds, which can be located at Fund Documents.
SIEL has appointed SEI Investments (Asia) Limited (SEIAL) of Suite 904, The Hong Kong Club Building, 3 Jackson Road, Central, Hong Kong as the sub-distributor of the SEI UCITS funds.
Singapore
The offer or invitation to subscribe for or purchase shares of the Sub-Funds (the “Shares), which is the subject of this Information Memorandum, is an exempt offer made only: (i) to “institutional investors” pursuant to Section 304 of the Securities and Futures Act, Chapter 289 of Singapore (the “Act”), (ii) to “relevant persons” pursuant to Section 305(1) of the Act, (iii) to persons who meet the requirements of an offer made pursuant to Section 305(2) of the Act, or (iv) pursuant to, and in accordance with the conditions of, other applicable exemption provisions of the Act.
No exempt offer of the Shares for subscription or purchase (or invitation to subscribe for or purchase the Shares) may be made, and no document or other material (including this Information Memorandum) relating to the exempt offer of Shares may be circulated or distributed, whether directly or indirectly, to any person in Singapore except in accordance with the restrictions and conditions under the Act. By subscribing for Shares pursuant to the exempt offer under this Information Memorandum, you are required to comply with restrictions and conditions under the Act in relation to your
offer, holding and subsequent transfer of Shares.
This information is being made available in Hong Kong by SEIAL. The contents of this document have not been reviewed by any regulatory authority in Hong Kong. You are advised to exercise caution in relation to the offer. If you are in any doubt about any of the contents of this document, you should obtain independent professional advice.
The SEI UCITS Funds have not been authorised by the SFC in Hong Kong and will be an unregulated collective investment scheme for the purpose of the Securities and Futures Ordinance of Hong Kong (the “SFO”). Shares of the SEI UCITS Funds may not be offered or sold by means of any document in Hong Kong other than (a) to professional investors as defined in the SFO and its subsidiary legislation or (b) in other circumstances which do not result in the document being a “prospectus” as defined in the Companies Ordinance (“CO”) or which do not constitute an offer to the public within the meaning of the CO. This document does not constitute an offer or invitation to the public in Hong Kong to acquire shares in the SEI UCITS Funds. These materials have not been delivered for registration to the Registrar of Companies in Hong Kong.
It is the responsibility of every recipient to understand and observe applicable regulations and requirements in their jurisdiction. This information is only directed at persons residing in jurisdictions where the SEI UCITS Funds are authorised for distribution or where no such authorisation is required.
The Shares may not be offered, sold or delivered directly or indirectly in the US or to or for the account or benefit of any US Person except pursuant to an exemption from, or in a transaction not subject to, the registration requirements of the Securities Act of 1933 and any applicable state laws.
This information is made available in Latin America FOR PROFESSIONAL (non-retail) USE ONLY by SIEL. Any questions you may have in relation to its contents should solely be directed to your Distributor. If you do not know who your Distributor is, then you cannot rely on any part of this document in any respect whatsoever.
SEI has not considered the suitability or appropriateness of any of the SEI UCITS Funds against your individual needs and risk tolerance. SEI shall not be liable for, and accepts no liability for, the use or misuse of this document by the Distributor. For all Distributors of the SEI UCITS Funds please refer to your sub-distribution agreement with SIEL before forwarding this information to your clients. It is the responsibility of every recipient to understand and observe applicable regulations and requirements in their jurisdiction. The Distributor is, amongst other things, responsible for ensuring that the Shares are only offered, and any literature relating to the SEI UCITS Funds (including this document) are only distributed, in jurisdictions where such offer and/or distribution would be lawful.
Issued in South Africa by SEI Investments (South Africa) (Pty) Ltd. FSP No. 13186 which is a financial services provider authorised and regulated by the Financial Sector Conduct Authority (FSCA). Registered office: 3 Melrose Boulevard, 1st Floor, Melrose Arch 2196, Johannesburg, South Africa.
A number of sub-funds of the SEI Global Master Fund plc and the SEI Global Investment Fund plc (the “SEI UCITS Funds”) have been approved for distribution in South Africa under s.65 of the Collective Investment Schemes Control Act 2002 as foreign collective investment schemes in securities. If you are unsure at any time as to whether or not a portfolio of SEI is approved by the Financial Sector Conduct Authority (“FSCA”) for distribution in South Africa, please consult the FSCA’s website (www.fsca.co.za).
Collective Investment Schemes (CIS) are generally medium to long-term investments and investors may not get back the amount invested. The value of participatory interests or the investment may go down as well as up. SEI does not provide any guarantee either with respect to the capital or the return of an SEI UCITS Fund. The SEI UCITS Funds are traded at ruling prices and can engage in borrowing and scrip lending. A schedule of fees and charges and maximum commissions is available upon request from SEI. The SEI UCITS Funds invest in foreign securities. Please note that such investments may be accompanied by additional risks such as: potential constraints on liquidity and the repatriation of funds; macroeconomic, political/ emerging markets, foreign currency risks, tax and settlement risks; and limits on the availability of market information.
This commentary is intended for information purposes only and the information in it does not constitute financial advice as contemplated in terms of the Financial Advisory and Intermediary Services Act.
Please refer to our latest Prospectus (which includes information in relation to the use of derivatives and the risks associated with the use of derivative instruments), Key Investor Information Document and the latest Annual or Semi-Annual Reports for more information on our funds, which can be located at Fund Documents.


