Monthly Market Commentary: Earnings and inflation take the spotlight
Global equity markets saw mixed performance in April, amid an uneven start to the first-quarter corporate earnings season and investors’ optimism that inflation in the U.S. may be moderating. Developed markets garnered positive returns and outperformed emerging markets, which ended the month in negative territory. Europe was the top-performing region among developed markets in April due primarily to strength in Switzerland and Austria. The Far East region was the worst performer within the emerging markets in April due mainly to weakness in Taiwan and China. Eastern Europe recorded a double-digit gain and was the strongest-performing region, with notable contributions from Poland and Hungary.1

During the month, investors were focused on the quarterly results for U.S.- based multinational and regional banks to gauge the impact of the turbulence in the sector in March. While several multinational banks reported betterthan- expected revenue and earnings, numerous regional banks’ results were hampered by outflows of funds from depositors amid uncertainty about the stability of smaller financial institutions. U.S. automotive stocks also took a hit after a large electric-vehicle (EV) manufacturer reported a substantial year-over-year drop in earnings due mainly to a decline in its operating margin (a measure of profitability) resulting from the company’s notable price reductions. Toward the end of the month, however, markets were buoyed by better-than-expected corporate results from several large U.S.-based technology companies.
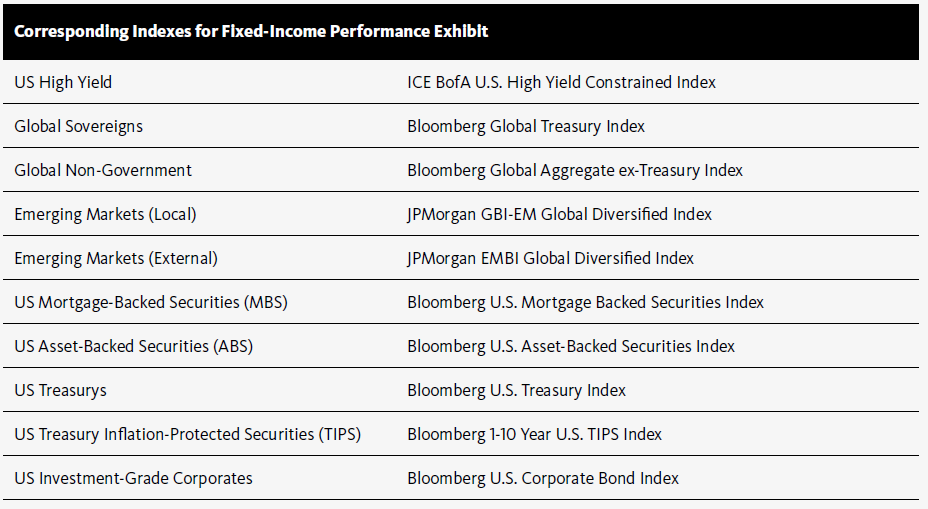
Global fixed-income assets posted modest gains in April. In the U.S. market, high-yield bonds were the top performers for the period, followed by corporate bonds and U.S. Treasurys.2 Mortgage-backed securities (MBS) were the primary market laggards in the U.S. fixed-income market.3 U.S. Treasury yields moved modestly lower for all maturities of more than one year (yields and prices have an inverse relationship). The yields on 2-, 3-, 5-, and 10-year Treasury notes dipped 0.02%, 0.06%, 0.09%, and 0.04%, respectively, in April. The spread between ten- and two-year notes moved from -0.58% to -0.60% during the period, further inverting the yield curve.
Global commodities markets saw varied performance over the month. The West Texas Intermediate (WTI) crude-oil spot price rose 1.5% in U.S. dollar terms, while the Brent crude oil price was up 0.6%, benefiting from increased demand and lower production in the U.S. The New York Mercantile Exchange (NYMEX), a commodities trading exchange, natural gas price climbed 16.3% in April, spurred by higher demand due to unusually cool spring weather in much of the U.S. The gold spot price posted a modest gain of 0.6% as the U.S. dollar declined modestly during the month. Wheat prices fell 8.5% in April amid an increase in supply coupled with weaker demand.4

As of the end of April, the administration of President Joe Biden had not reached an agreement with the Republican Party majority in the U.S. House of Representatives to raise the government’s debt ceiling. In a party-line vote in late April, the House passed legislation for lifting the debt ceiling of US$31.4 trillion through March 31, 2024, but requiring government spending cuts of US$4.8 trillion. Among other provisions, the bill includes more stringent limits on government spending; cancellation of Biden’s student loan forgiveness program; reductions in the Internal Revenue Service (IRS) budget; and tightening of work requirements for recipients of government-funded public assistance programs.5 In a speech to the Sacramento Metropolitan Chamber of Commerce, U.S. Treasury Secretary Janet Yellen warned that, if the U.S. Congress does not agree to raise the debt ceiling, the government will default on its financial obligations, leading to “an economic and financial catastrophe.” Yellen also stated that over the longer term, a default would increase the cost of borrowing “into perpetuity…Congress must vote to raise or suspend the debt limit. It should do so without conditions. And it should not wait until the last minute. I believe it is a basic responsibility of our nation’s leaders to get this done.”
There was mixed news regarding the ongoing labour troubles in the U.K. in April. The GMB union, which represents National Health Service (NHS) workers, announced that its members voted to accept the U.K. government’s offer to resolve a labour dispute following five months of contentious negotiations and strikes. The agreement includes two one-time payments for 2022-23, with a combined value of up to £3,789, and a 5% wage increase for 2023-24. However, members of Unite, another large union representing NHS workers, rejected the same offer.6 Additionally, four teachers’ unions announced plans to ask their members to authorise job actions sometime in the autumn of this year. The Office for National Statistics (ONS) reported that the U.K. government borrowed £139.2 billion in the 2022-23 financial year—£17.2 billion below than the Office for Budget Responsibility’s previous estimate. The lower-than-anticipated debt level led to speculation that the government might implement tax cuts later this year.7
Regarding the ongoing Russia-Ukraine conflict, China’s President Xi Jinping called President Volodymyr Zelenskyy of Ukraine soon after China’s ambassador to France, Lu Shaye, had questioned the legal status of former U.S.S.R. countries and Ukraine’s sovereignty over Crimea. Though China’s government denied that the call was related to Lu’s comments, a European Union official said that “[China needs] to do some damage control after the Paris ambassador’s comments.”8 According to China’s foreign ministry, Xi urged Zelenskyy to negotiate with Russia to reach a “political settlement” of the conflict. While Zelenskyy’s administration issued a statement that did not address Xi’s push for negotiations with Russia, it “expressed hope for China’s active participation in efforts to restore peace.”9
Economic data
U.S.
- According to the Department of Commerce, the personal-consumption expenditures (PCE) price index rose 0.1% in March and 4.2% over the previous 12-month period—down from the 0.3% and 5.1% monthly and annual increases, respectively, in February. Food prices dipped 0.2% during the month and were up 8.0% year-over-year—sharply lower than the 0.2% and 9.7% increases for the corresponding time periods in February. Energy goods and services costs fell 3.7% in March and tumbled 9.8% over the previous 12 months. The PCE price index is the Federal Reserve’s (Fed) preferred gauge of inflation, as it tracks the change in prices paid by or on behalf of consumers for a more comprehensive set of goods and services than that of the consumer-price index (CPI).
- The U.S. Department of Labor also reported that payrolls increased by 236,000 in March, down sharply from 311,000 the previous month. The unemployment rate dipped 0.1% to 3.5%. The leisure and hospitality, government, and professional and business services sectors saw the largest employment gains for the month. Average hourly earnings were up 0.3% in March and 4.2% year-over-year. The 12-month increase was lower than the 4.6% rise in February, suggesting that employers may be having less difficulty finding and retaining workers.

- U.S. home prices saw modest improvement in February (the most recent reporting period). The S&P CoreLogic Case-Shiller U.S. National Home Price NSA Index, which measures the value of residential real estate in 20 major U.S. metropolitan areas, was up 0.2% for the month, breaking a string of seven consecutive monthly declines. The index posted an annual gain of 2.0%, down from the 3.7% increase in January, and 4.9% below its peak in June 2022. So, is the housing market primed for a rally? It depends on the old real estate adage of location, location, location. Two cities in Florida–Miami and Tampa–were the strongest-performing markets over the12-month period, posting gains 10.1% and 7.7%, respectively. Conversely, average home prices in two metropolitan areas on the West Coast, San Francisco and Seattle, fell by corresponding margins of 10.0% and 9.3% year-over-year in February.10
- The Department of Commerce reported that U.S. gross domestic product (GDP) moderated in the first quarter of 2023 to an annualised rate of 1.1% from 2.6% in the fourth quarter of 2022. The largest increases for the quarter were in consumer spending, exports, and federal government spending. These gains offset reductions in private inventory investment (a measure of the changes in values of inventories from one time period to the next) and residential fixed investment (purchases of private residential structures and residential equipment that property owners use for rentals). The government attributed the slower GDP growth rate relative to the fourth quarter of 2022 to a downturn in private inventory investment and a decline in nonresidential fixed investment (purchases of both nonresidential structures and equipment and software).


U.K.
- According to the Office for National Statistics (ONS), consumer prices in the U.K. rose 0.8% month-over-month in March, down from the 1.1% increase in February. The year-over-year inflation rate rose 10.1% over the previous 12-month period, but was somewhat lower than the 10.4% annual rise during the previous month. Housing and household services (electricity, gas, and other fuels), along with food and non-alcoholic beverages, recorded double-digit gains and were the primary contributors to the year-over-year increase in prices. Core inflation, which excludes volatile food and energy prices, rose at an annual rate of 6.2% in March, unchanged from the increase in February.
- The ONS also reported that U.K. GDP was flat in February (the most recent reporting period) following a 0.3% increase in January, and ticked up 0.1% over the three-month period ending in February. The services sector contracted 0.1% for the month, down sharply from the 0.7% increase in January, due mainly to education and public administration and defense.
Conversely, the construction sector grew by 2.4% in February, after declining 1.7% during the previous month, attributable primarily to strength in repair and maintenance, and new work.
- The S&P Global/CIPS Flash UK Manufacturing Output Index declined 0.5 to a three-month low of 48.5 in April due to customer destocking (a planned reduction in stock or inventory), high energy costs, and lower demand for big=ticket consumer goods. A reading below 50 indicates contraction in the manufacturing sector.
- The S&P Global/CIPS Flash UK Services PMI Business Activity Index was up 2.0 to 54.9 in April, indicating expansion for the second consecutive month. There was particular strength in the services sector, which benefited as growth in new orders reached a 13-month high amid increased spending on travel, leisure, and entertainment.
Eurozone
- Inflation in the eurozone slowed by 1.6% to 6.9% in the 12-month period ending in March. Energy prices decreased 0.9% year-over-year, while food, alcohol and tobacco costs climbed 15.5% for the same period.11
- Eurozone manufacturing increased in March, with the S&P Global Eurozone Manufacturing Output Index rising 0.3 points to a 10-month high of 50.4.
- Services activity in the eurozone also reached a 10-month high in March, with the S&P Global Eurozone Services PMI Activity Index climbing 2.3 to 55.0.
- According to Eurostat, eurozone GDP eked out a 0.1% gain in the first quarter of 2023, following flat growth in the fourth quarter of 2022, and increased 1.3% over the previous 12 months. Portugal’s economy was the strongest performer, expanding by 1.6% in the first quarter, while Ireland’s GDP decreased 2.7% during the period.

Central banks
- The minutes of the Federal Open Market Committee’s (FOMC) meeting of March 21-22 revealed that the members considered keeping the federal funds rate on hold due to the crisis in the banking sector. However, the FOMC subsequently raised its benchmark interest rate by 0.25% to a range of 4.75%-5.00% after determining that “the actions taken so far by the Federal Reserve in coordination with other government agencies, as well as actions taken by foreign authorities to address banking and financial stresses outside the U.S., had helped calm conditions in the banking sector.”
- In a speech to the Salt Lake Chamber in Utah in April, Federal Reserve Bank of San Francisco President Mary Daly said that the Fed’s rate hikes “have been warranted and consistent with our commitment to restore price stability. While the full impact of this policy tightening is still making its way through the system, the strength of the economy and the elevated readings on inflation suggest that there is more work to do.”12
- The Bank of England’s (BOE) next monetary policy meeting is scheduled for May 11. The central bank raised its benchmark rate by 0.25% to 4.25% on March 23. According to the Financial Times, the BOE is considering significant changes to its deposit guarantee program following the failure of Silicon Valley Bank in the U.S. in March. The Financial Times’ sources noted that the central bank is concerned that the Financial Services Compensation Scheme’s current limit of £85,000 insures only about two-thirds of all deposits and, consequently, there would be delays of at least a week for depositors to be able to access their funds.13
- The European Central Bank (ECB) increased its benchmark interest rate by 0.50% to 3.50% on March 16. According to a poll of economists conducted by Reuters, consensus expectations are for two more 0.25% increases in the policy rate in May and June, as inflation in the eurozone, though slowing, remains well above the central bank’s 2% target rate.14
- As expected, the Bank of Japan (BOJ) left its benchmark interest rate nchanged at -0.1% following its meeting on April 27-28—the first monetary policy meeting under new BOJ Governor Kazuo Ueda. In a statement issued after the meeting, the BOJ noted that “Since the late 1990s, when Japan’s economy fell into deflation, achieving price stability has been a challenge for a long period of 25 years. During this period, the Bank has implemented various monetary easing measures…[which] have interacted with and influenced wide areas of Japan’s economic activity, prices, and financial sector. In light of this, the Bank has decided to conduct a broad-perspective review of monetary policy, with a planned time frame of around one to one and a half years.”15
SEI’s view
The tumult in the banking system isn’t over yet. Although it appears that the crisis stage has eased, smaller banks are facing ongoing pressure to raise deposit rates to more competitive levels, while borrowing from the Fed and U.S. government agencies to improve their liquidity. A recession becomes like lier due to the important role that community and regional banks play in the U.S. financial system. According to the Fed, smaller banks (below the 25 largest banking institutions ranked by domestic assets), account for roughly two-thirds of commercial bank loans. They also comprise a very large proportion of credit extended to small businesses.
Investors have become “Pavlovian” in regard to central bank stimulus—equity markets fall, central banks cut rates. We question whether this reaction function will remain in place in a regime of stubborn inflation rates. That is, we see headwinds for the equity markets and do not expect central banks to come to the rescue as they have in the past.
We think that the impact of higher rates and tighter monetary policy will expand beyond the highly sensitive sectors (such as housing) into the broader economy.
Labour input costs are one of the most prominent drivers of inflation and, with worker participation levels softening over time (particularly for the working-age male cohort) and the swift aging of populations in many major developed and emerging economies, we may see continued upward pressure on wages that help keep inflation higher for longer. The most recent reported unemployment rates are at or below long-term equilibrium levels for many countries. This implies that labour markets globally are extremely tight and wage growth is likely to remain higher-than-desired, putting continued upward pressure on inflation.
SEI has consistently predicted that inflation would be higher for longer since the spring of 2021. Our out-of-consensus call was based in part on the tight labour-market conditions that prevailed in the U.S., Canada, the U.K., and Europe.
“Labour pains” may persist until an economic recession fully takes root. Nonetheless, even the bitter pill of a recession won’t alleviate all pressure from the labour market, as population aging can’t be reversed by economic distress. While we believe that a recession is likely, we expect it will be relatively shallow and brief. Unfortunately, at least some labour pains may outlive a recession.
We remain cautious on equity markets from a top-down perspective. Within the equity asset class, we continue to focus on our core approach: favouring high-quality companies with positive earnings momentum at reasonable valuations.
Looking forward, we see opportunities and risks in both the resilient (equities, credit) and the divergent (value, rates) segments of the global financial markets. Specifically, we are fading the resilient and leaning into the divergent.

Glossary of financial terms
Yield is the income returned on an investment, such as the interest received from holding a security. The yield is usually expressed as an annual percentage rate based on the investment’s cost, current market value, or face value.
A recession is a significant and prolonged downturn in economic activity.
Monetary policy refers to decisions by central banks to influence the amount of money and credit in the economy by managing the level of benchmark interest rates and the purchase or sale of securities. Central banks typically make policy decisions based on their mandates to target specific levels or ranges for inflation and employment.
Mortgage-backed securities (MBS) are pools of mortgage loans packaged together and sold to the public. They are usually structured in tranches (a slice or portion of a structured security) that vary by risk and expected return.
Yield curve represents differences in yields across a range of maturities of bonds of the same issuer or credit rating (are (which is used to assess the risk of default of companies or countries). A steeper yield curve represents a greater difference between the yields. A flatter curve indicates the short- and long-term yields are closer together.
An inverted yield curve occurs when short-term yields exceed long-term yields. While an inverted yield curve historically has predicted economic recessions, it is an indicator—not a forecast.
Gross domestic product (GDP) is the total monetary or market value of all the goods and services produced in a country during a certain period.
Inflation is the rate of increase in prices over a given period of time.
The federal-funds rate is the interest rate charged to lending institutions on unsecured overnight loans. It is set by the U.S. Federal Reserve’s Federal Open Market Committee. The rate is increased when the Federal Reserve wants to discourage borrowing and slow the economy and decreased when the Federal Reserve wants to spur economic growth.
Treasury Inflation-Protected Securities (TIPS) are U.S. Treasury bonds that are indexed to an inflationary gauge to protect investors from a decline in the purchasing power of their money.
Asset-backed securities (ABS) are created from pools of income-generating assets such as credit cards, and auto, mortgage and student loans.
Index descriptions
All indexes are quoted in gross performance unless otherwise indicated.
The MSCI ACWI Index is a market capitalisation-weighted index that tracks the performance of over 2,000 companies, and is representative of the market structure of 48 developed and emerging-market countries in North and South America, Europe, Africa, and the Pacific Rim. The index is calculated with net dividends reinvested in U.S. dollars.
The ICE BofA U.S. High Yield Constrained Index is a market capitalisation-weighted index which tracks the performance of U.S. dollar-denominated below-investment-grade (rated BB+ or lower by S&P Global Ratings and Fitch Ratings or Ba1 or lower by Moody’s Investors Service) corporate debt publicly issued in the U.S. domestic market.
The ICE BofA U.S. Corporate Index includes publicly issued, fixed-rate, nonconvertible investment-grade (rated BBB- or higher by S&P Global Ratings and Fitch Ratings or Baa3 or higher by Moody’s Investors Service) dollar-denominated, U.S. Securities and Exchange (SEC)-registered corporate debt having at least one year to maturity.
The ICE BofA U.S. Treasury Index tracks the performance of fixed-rate, nominal debt issued by the U.S. Treasury.
The S&P U.S. Mortgage-Backed Securities Index tracks the performance of U.S. dollar-denominated, fixed-rate and adjustable-rate/hybrid mortgage pass-through securities issued by Ginnie Mae (GNMA), Fannie Mae (FNMA) and Freddie Mac (FHLMC).
Consumer-price indexes measure changes in the price level of a weighted-average market basket of consumer goods and services purchased by households. A consumer price index is a statistical estimate constructed using the prices of a sample of representative items whose prices are collected periodically.
The S&P CoreLogic Case-Shiller U.S. National Home Price NSA Index measures the value of residential real estate in 20 major U.S. metropolitan areas.
A purchasing managers’ index (PMI) tracks the prevailing direction of economic trends in the manufacturing and service sectors.
The S&P Global/CIPS Flash UK Manufacturing Output Index measures the activity level of purchasing managers in the manufacturing sector of the U.K. A reading above 50 indicates expansion in the sector; below 50 indicates contraction.
The S&P Global/CIPS Flash UK Services PMI Business Activity Index measures the activity level of purchasing managers in the services sector. A reading above 50 indicates expansion in the sector; a reading below 50 indicates contraction.
The S&P Global Eurozone Manufacturing Output Index measures the activity level of purchasing managers in the manufacturing sector of the eurozone. A reading above 50 indicates expansion in the sector; below 50 indicates contraction.
The S&P Global Eurozone Services PMI Activity Index measures the activity level of purchasing managers in the services sector of the eurozone. A reading above 50 indicates expansion in the sector; below 50 indicates contraction.


Important Information
The information contained herein is for general and educational information purposes only and is not intended to constitute legal, tax, accounting, securities, research or investment advice regarding the Strategies or any security in particular, nor an opinion regarding the appropriateness of any investment. This information should not be construed as a recommendation to purchase or sell a security, derivative or futures contract. You should not act or rely on the information contained herein without obtaining specific legal, tax, accounting and investment advice from an investment professional. This material represents an assessment of the market environment at a specific point in time and is not intended to be a forecast of future events, or a guarantee of future results. There is no assurance as of the date of this material that the securities mentioned remain in or out of the SEI Strategies. Positioning and holdings are subject to change. All information as of 30 April 2023.
Information contained herein that is based on external sources or other sources is believed to be reliable, but is not guaranteed by SEI, and the information may be incomplete or may change without notice. This document may not be reproduced, distributed to another party or used for any other purpose.
There are risks involved with investing, including loss of principal. Diversification may not protect against market risk. There may be other holdings which are not discussed that may have additional specific risks. Narrowly focused investments and smaller companies typically exhibit higher volatility. International investments may involve risk of capital loss from unfavourable fluctuation in currency values, from differences in generally accepted accounting principles or from economic or political instability in other nations. Emerging markets involve heightened risks related to the same factors, in
addition to those associated with their relatively small size and lesser liquidity. Bonds will decrease in value as interest rates rise. High yield bonds involve greater risks of default or downgrade and are more volatile than investment grade securities, due to the speculative nature of their investments. SEI products may use derivative instruments such as futures, forwards, options, swaps, contracts for differences, credit derivatives, caps, floors and currency forward contracts. These instruments may be used for hedging purposes and/or investment purposes.
While considerable care has been taken to ensure the information contained within this document is accurate and up-to-date, no warranty is given as to the accuracy or completeness of any information and no liability is accepted for any errors or omissions in such information or any action taken on the basis of this information.
The value of an investment and any income from it can go down as well as up. Investors may get back less than the original amount invested. Returns may increase or decrease as a result of currency fluctuations. Past performance is not a reliable indicator of future results. Investment may not be suitable for everyone. If you should have any doubt whether it is suitable for you, you should obtain expert advice.
Index returns are for illustrative purposes only, and do not represent actual account performance. Index returns do not reflect any management fees, transaction costs or expenses. Indexes are unmanaged and one cannot invest directly in an index.
Not all strategies discussed may be available for your investment.
This material is not directed to any persons where (by reason of that person’s nationality, residence or otherwise) the publication or availability of this material is prohibited. Persons in respect of whom such prohibitions apply must not rely on this information in any respect whatsoever.
The views and opinions within this document are of SEI only and are subject to change. They should not be construed as investment advice.
The views contained herein are not to be taken as advice or a recommendation to buy or sell any investment in any jurisdiction. Our outlook contains forward-looking statements that are judgments based upon our current assumptions, beliefs and expectations. If any of the factor underlying our current assumptions, beliefs or expectations change, our statements as to potential future events or
outcomes may be incorrect. We undertake no obligation to update our forward-looking statements.
The SEI Global Assets Fund Plc, SEI Global Investments Fund Plc, and SEI Global Master Fund Plc (the “SEI UCITS Funds”) are structured as open-ended collective investment schemes and are authorised in Ireland by the Central Bank as a UCITS pursuant to the UCITS Regulations. The SEI UCITS Funds are managed by SEI Investments, Global Ltd (“SIGL”). SIGL has appointed SEI Investments (Europe) Ltd (“SIEL”) to provide general distribution services in relation to the SEI UCITS Funds either directly or through the appointment of other sub-distributors. The SEI UCITS Funds may not be marketed to the general public except in jurisdictions where the funds have been registered by the relevant regulator. The matrix of the SEI UCITS fund registrations can be found here
https://www.seic.com/en-gb/fund-document.
No offer of any security is made hereby. Recipients of this information who intend to apply for shares in any SEI UCITS Fund are reminded that any such application may be made solely on the basis of the information contained in the Prospectus. Please refer to our latest Prospectus (which includes information in relation to the use of derivatives and the risks associated with the use of derivative instruments),Key Investor Information Document, Summary of UCITS Shareholder rights (which includes a summary of the rights that shareholders of our funds have) and the latest Annual
or Semi-Annual Reports for more information on our funds, which can be located at Fund Documents.
SIEL has appointed SEI Investments (Asia) Limited (SEIAL) of Suite 904, The Hong Kong Club Building, 3 Jackson Road, Central, Hong Kong as the sub-distributor of the SEI UCITS funds.
Singapore
The offer or invitation to subscribe for or purchase shares of the Sub-Funds (the “Shares), which is the subject of this Information Memorandum, is an exempt offer made only: (i) to “institutional investors” pursuant to Section 304 of the Securities and Futures Act, Chapter 289 of Singapore (the “Act”), (ii) to “relevant persons” pursuant to Section 305(1) of the Act, (iii) to persons who meet the requirements of an offer made pursuant to Section 305(2) of the Act, or (iv) pursuant to, and in accordance with the conditions of, other applicable exemption provisions of the Act.
No exempt offer of the Shares for subscription or purchase (or invitation to subscribe for or purchase the Shares) may be made, and no document or other material (including this Information Memorandum) relating to the exempt offer of Shares may be circulated or distributed, whether directly or indirectly, to any person in Singapore except in accordance with the restrictions and conditions under the Act. By subscribing for Shares pursuant to the exempt offer under this Information Memorandum, you are required to comply with restrictions and conditions under the Act in relation to your
offer, holding and subsequent transfer of Shares.
This information is being made available in Hong Kong by SEIAL. The contents of this document have not been reviewed by any regulatory authority in Hong Kong. You are advised to exercise caution in relation to the offer. If you are in any doubt about any of the contents of this document, you should obtain independent professional advice.
The SEI UCITS Funds have not been authorised by the SFC in Hong Kong and will be an unregulated collective investment scheme for the purpose of the Securities and Futures Ordinance of Hong Kong (the “SFO”). Shares of the SEI UCITS Funds may not be offered or sold by means of any document in Hong Kong other than (a) to professional investors as defined in the SFO and its subsidiary legislation or (b) in other circumstances which do not result in the document being a “prospectus” as defined in the Companies Ordinance (“CO”) or which do not constitute an offer to the public within the meaning of the CO. This document does not constitute an offer or invitation to the public in Hong Kong to acquire shares in the SEI UCITS Funds. These materials have not been delivered for registration to the Registrar of Companies in Hong Kong.
It is the responsibility of every recipient to understand and observe applicable regulations and requirements in their jurisdiction. This information is only directed at persons residing in jurisdictions where the SEI UCITS Funds are authorised for distribution or where no such authorisation is required.
The Shares may not be offered, sold or delivered directly or indirectly in the US or to or for the account or benefit of any US Person except pursuant to an exemption from, or in a transaction not subject to, the registration requirements of the Securities Act of 1933 and any applicable state laws.
This information is made available in Latin America FOR PROFESSIONAL (non-retail) USE ONLY by SIEL.
Any questions you may have in relation to its contents should solely be directed to your Distributor. If you do not know who your Distributor is, then you cannot rely on any part of this document in any respect whatsoever.
SEI has not considered the suitability or appropriateness of any of the SEI UCITS Funds against your individual needs and risk tolerance. SEI shall not be liable for, and accepts no liability for, the use or misuse of this document by the Distributor. For all Distributors of the SEI UCITS Funds please refer to your sub-distribution agreement with SIEL before forwarding this information to your clients. It is the responsibility of every recipient to understand and observe applicable regulations and requirements in their jurisdiction. The Distributor is, amongst other things, responsible for ensuring that the Shares are only offered, and any literature relating to the SEI UCITS Funds (including this document) are only distributed, in jurisdictions where such offer and/or distribution would be lawful.
Issued in South Africa by SEI Investments (South Africa) (Pty) Ltd. FSP No. 13186 which is a financial services provider authorised and regulated by the Financial Sector Conduct Authority (FSCA). Registered office: 3 Melrose Boulevard, 1st Floor, Melrose Arch 2196, Johannesburg, South Africa.
A number of sub-funds of the SEI Global Master Fund plc and the SEI Global Investment Fund plc (the “SEI UCITS Funds”) have been approved for distribution in South Africa under s.65 of the Collective Investment Schemes Control Act 2002 as foreign collective investment schemes in securities. If you are unsure at any time as to whether or not a portfolio of SEI is approved by the Financial Sector Conduct Authority (“FSCA”) for distribution in South Africa, please consult the FSCA’s website (www.fsca.co.za).
Collective Investment Schemes (CIS) are generally medium to long term investments and investors may not get back the amount invested. The value of participatory interests or the investment may go down as well as up. SEI does not provide any guarantee either with respect to the capital or the return of an SEI UCITS Fund. The SEI UCITS Funds are traded at ruling prices and can engage in borrowing and scrip lending. A schedule of fees and charges and maximum commissions is available upon request from SEI. The SEI UCITS Funds invest in foreign securities. Please note that such
investments may be accompanied by additional risks such as: potential constraints on liquidity and the repatriation of funds; macroeconomic, political/emerging markets, foreign currency risks, tax and settlement risks; and limits on the availability of market information.
This commentary is intended for information purposes only and the information in it does not constitute financial advice as contemplated in terms of the Financial Advisory and Intermediary Services Act.
Please refer to our latest Prospectus (which includes information in relation to the use of derivatives and the risks associated with the use of derivative instruments), Key Investor Information Document and the latest Annual or Semi-Annual Reports for more information on our funds, which can be located at Fund Documents.


