Monthly Market Commentary: Cooling economic activity ignites market rebound.
The selloff that shaped the first half of 2022 came to a halt as equities and fixed-interest asset classes rallied in July. Shares and bonds moved sideways during the first half of the month after climbing off a bottom in mid-June, and then recovered at an accelerating pace as the end of July approached.1
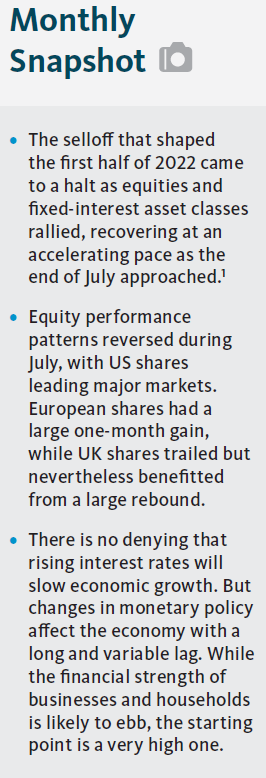
Data showing softening economic activity counterintuitively provided investors with a confidence boost, as slower growth and milder inflation would likely mean that central banks won’t need to increase rates as much as feared, thereby keeping a lid on borrowing costs.
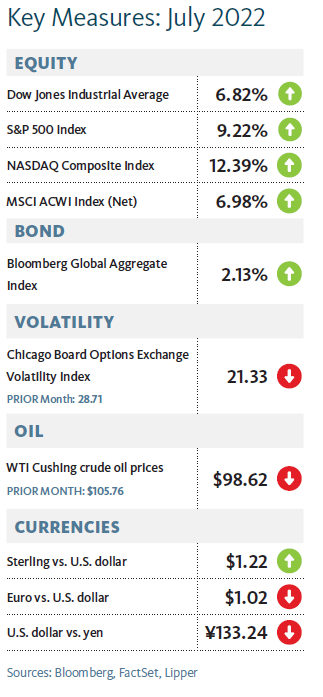
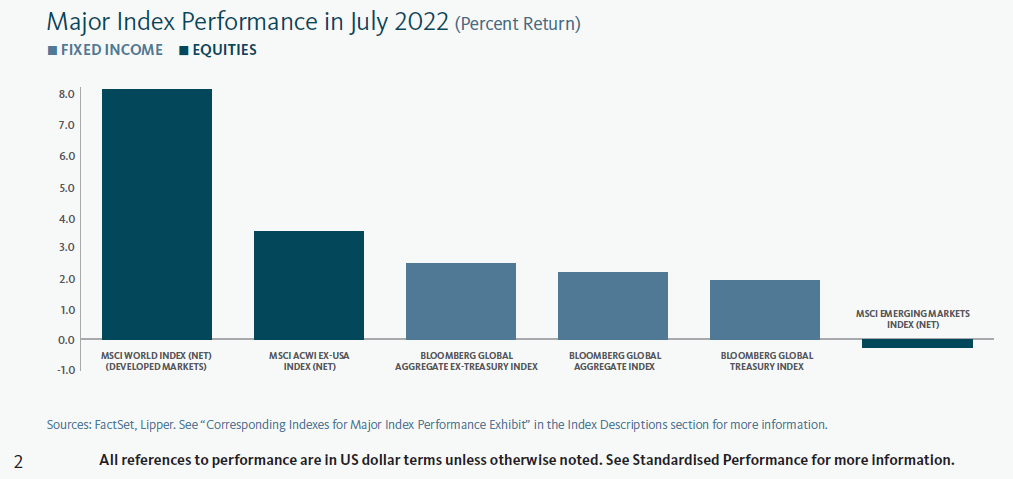
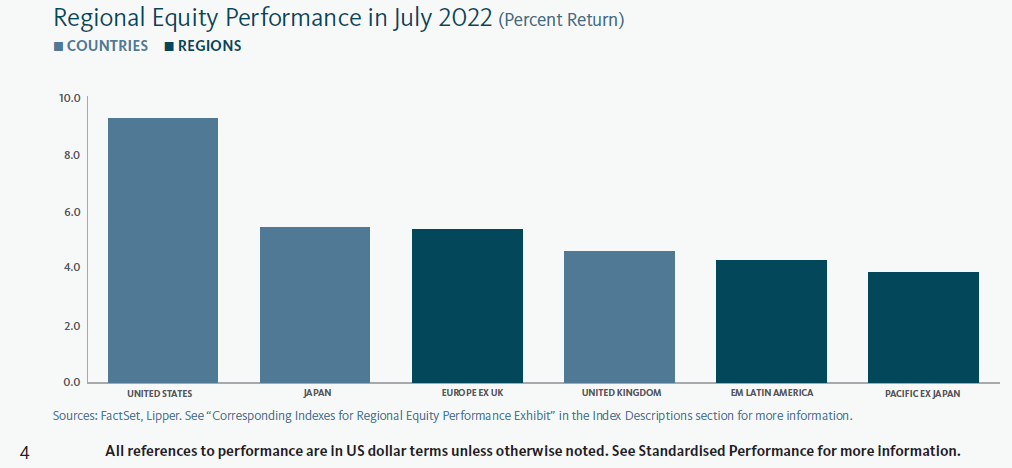
Equity performance patterns reversed, with US shares leading major markets after delivering one of the second quarter’s worst performances. Japan also had a large one-month gain, as did Europe; UK shares trailed these markets, but nevertheless benefitted from a large rebound in July. Emerging-market equities, meanwhile, generated a small loss as China’s second-quarter rebound faltered.
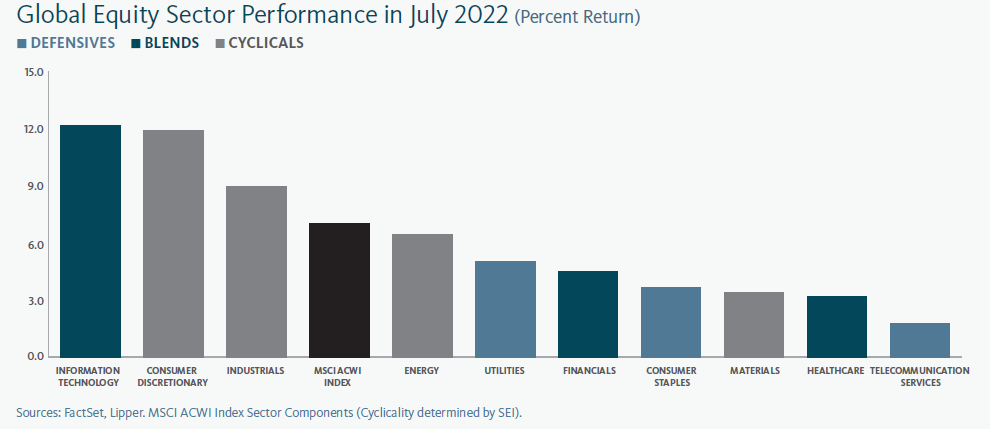
Growth-oriented shares outpaced their value-oriented counterparts during the month, although the difference was considerably greater within large-cap equities than in small caps.
UK and eurozone government bond rates fell across most maturities in July, with the steepest declines in the medium-to-long-term segment of the yield curve. Short-term US Treasury rates increased, while medium-to-long term rates fell, resulting in a flatter curve that also grew more inverted (that is, when shorter-term rates are higher than longer-term rates).
The US dollar ended the month slightly higher than where it began (measured by the US Dollar Index), after its 13-month climb began to reverse in mid-July.
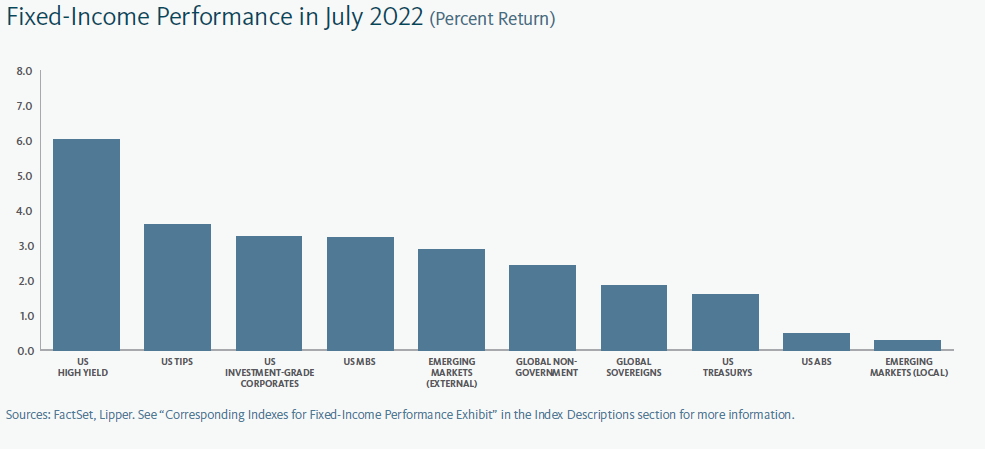
High-yield bonds were the best-performing fixed-interest asset class in July in keeping with the resurgent appetite for risk. Most other segments of the bond market were also positive given the general decline in rates (yields and prices have an inverse relationship).2
Commodity-price movements were mixed in July. The Bloomberg Commodity Index advanced by 4.08%, but Brent and West-Texas Intermediate crude oil prices slid 6.75% and 4.64%, respectively, and wheat prices fell by 8.63%. Natural gas prices, meanwhile, increased by 52.69% for the full month.3
Europe’s pipeline-supplied natural gas came under renewed threat at the end of July as Russia cut deliveries to 20% of capacity for the Nord Stream 1 pipeline. The threat of undersupply inhibits Europe’s ability to stockpile gas for the high-consumption winter months. EU nations have voluntarily agreed to reduce gas usage by 15% until March 2023 as a partial remedy.4
Ukraine’s Minister of Infrastructure declared that the “…first grain ship since Russian aggression has left port” on 1 August after the countries struck a UNTurkey brokered agreement in late July.5 The ship carried corn destined for Lebanon; approximately 22 million tons of grain that have been awaiting shipment for months may now be transported along agreed-upon safe corridors. Sanctions on Russian grain and fertilizer exports have also been loosened as part of the deal.
UK Prime Minister Boris Johnson announced in early July his intention to resign once the Conservative Party elects a new leader. The succession race has boiled down to Liz Truss, the current Foreign Secretary, and Rishi Sunak, the recent Chancellor of the Exchequer. Truss appeared to have the edge at the end of July.
Mario Draghi resigned as Italy’s Prime Minister in late July as a confidence vote revealed that he no longer had the backing of the coalition underpinning his national unity government. Elections are scheduled for late September.
The US Congress passed legislation in late July to appropriate $50 billion toward domestic development of semiconductor chip manufacturing and advanced technological research. Semiconductor scarcity has cascaded into an array of supply shortages; the industry’s concentration—with an overwhelming majority of production originating in Taiwan—is viewed as a national security risk given China’s claim to the territory. President Joe Biden signed the legislation into law on 2 August.
Chinese and US military posturing escalated in the vicinity of Taiwan toward the end of July as Nancy Pelosi, the Speaker of the House of Representatives (one of the two deliberative bodies that comprise the US Congress), prepared to visit the territory in addition to Japan, South Korea, Malaysia, and Singapore. Pelosi has been critical of China’s authoritarian rule and human-rights record for several decades.
Economic Data
UK
- Consumer prices in the UK jumped by 0.8% in June and 9.4% over the prior year—up from 0.7% and 9.1%, respectively, in May—and setting a new 40-year high for the year-over-year inflation rate.6
- UK manufacturing activity settled further into low-growth territory during July for the third consecutive month of slowing expansion.7
- Growth in the UK services sector held at modest-but-healthy levels in July that were roughly in line with May and June’s expansion.
- The UK’s claimant count (which calculates the number of people claiming Jobseeker’s Allowance) declined in June for the sixteenth consecutive month—by about 20,000, with total claimants representing 3.9% of the population in June compared to 4.0% in May.
- The UK economy expanded by 0.4% in the three months to May 2022 and by 3.5% over the prior 12 months. These growth rates were slower than the first quarter rate of 0.8% (and 8.7% for the year through March).
Eurozone
- Consumer prices increased by 0.1% in the eurozone during July, and 8.9% over the prior year, versus 0.8% and 8.6% in June. July’s year-over-year inflation figure was the highest since Eurostat began tracking data in 1997.8
- The eurozone unemployment rate held at 6.6% in June—the lowest level since Eurostat began recording employment data in 1998.9
- Eurozone manufacturing began to contract during July, albeit modestly, continuing an uninterrupted decline in activity from January’s peak.10
- The expansion in eurozone services activity continued to grind lower from a springtime peak, nearing a standstill in July.11
- The eurozone economy grew by 0.7% during the second quarter and 4.0% year over year, compared to 0.5% and 5.4%, respectively, in the first quarter.
US
- The US Personal Consumption Expenditures Price Index (the US Federal Reserve’s preferred inflation measure) jumped to 6.8% year over year through June, from 6.3% in May, setting a new record dating to early 1982.12
- Manufacturing growth in the US slowed modestly in July, essentially preserving a mild expansion after declining sharply in June.13
- US services activity tumbled into contraction during July after attaining low growth in May and June.14
- US job openings fell in June, from 11.3 million in May, to 10.7 million. The number of unemployed Americans measured 5.91 million, meaning that there were about 1.8 jobs available for every jobseeker.
- The overall US economy contracted during the second quarter by an annualised 0.9% after declining by 1.6% during the first quarter.
Central banks
- The Bank of England’s (BoE) Monetary Policy Committee (MPC) did not hold a meeting in July after increasing the bank rate to 1.25% in June and redeeming about £3.2 billion in balance sheet assets during July. At its early August meeting, the MPC hiked its benchmark rate by 0.50%, to 1.75%, the largest individual rate increase in 27 years.15
- The European Central Bank (ECB) increased its three benchmark rates by 0.50% at its July meeting for the first time in 11 years, surprising investors who were expecting hikes of 0.25%.16 At the same meeting, the ECB approved the establishment of a Transmission Protection Instrument (TPI) to ensure the smooth transmission of monetary policy normalisation across eurozone countries. According to the ECB, the TPI “can be activated to counter unwarranted, disorderly market dynamics” by making “secondary market purchases of securities issued in jurisdictions experiencing a deterioration in financing conditions.”
- The US Federal Reserve’s (Fed) Federal Open Market Committee (FOMC) increased the federal-funds rate by 0.75% toward the end of July—the second hike of its size in this tightening cycle—bringing the benchmark rate to a range between 2.25% and 2.50%. The central bank has also begun to reduce its balance sheet, allowing Treasurys and mortgages to run off (that is, mature without being replaced) at maximum respective paces of $30 billion and $17.5 billion per month in July and August (and rising in September to $60 billion and $35 billion per month, respectively).
- The Bank of Japan (BOJ) remained committed to loose policy at its July meeting. Its short-term interest rate remained at -0.1%, and the 10-year Japanese government-bond (JGB) yield target held near 0%. The central bank continued to offer purchases of 10-year JGBs at 0.25% in order to keep its yield within the BOJ’s acceptable range.
SEI’s view
It’s been our mantra for the past year that US inflation would be higher for longer than most economists and investors appeared to expect. We believe this remains the case, although the gap between our expectations and those priced in US markets has narrowed considerably and the pace of inflation’s increase is almost certainly close to a peak. Investors and the Fed still seem to be betting that inflation pressures will ebb significantly starting in the second half of this year and fall to 3% by the end of 2023.
Fed Chairman Jerome Powell continued to expresses hope that the Fed can achieve a “softish” landing, where inflation gradually decelerates back to the central bank’s 2% target without a recession. Unfortunately, there has been only one successful instance since the end of World War II (1951-to-1952) when inflation was running above 5%.17
Federal funds-rate futures indicate that investors are anticipating a series of increases between now and year-end that would bring the funds rate to 3.4%.Markets are presumably pricing in a recession by the second half of 2023, considering the funds rate is projected to decline at that point.
We believe this to be a reasonable forecast, but the outcome will depend on how quickly the economy actually weakens and inflation ebbs. The evidence as of today suggests that the US economy may continue to show a resilience that surprises both the Fed and investors.
There are signs of economic trouble ahead. The surge in US mortgage rates is delivering a big blow to the housing market. Beyond real estate, economists have begun citing the big increase in retail inventories as an indication of recession. We are doubtful that the inventory problems of department stores and general merchandisers are serious enough to throw the economy into recession in the near term.
There is no denying that rising interest rates will slow economic growth. But changes in monetary policy affect the economy with a long and variable lag. While the financial strength of US businesses and households is likely to ebb, the starting point is a very high one. The labour market, for instance, remains exceptionally tight. Until a better balance between the demand and supply of labour is achieved, one should expect further large wage gains at the lower end of the wage-income spectrum, where the job market is tightest.
American job switchers have enjoyed a sharper-than-average wage gain over the past 12 months. It should not be surprising that the US quit rate is significantly higher than in 2019 or at the previous economic peak in 2007.
Other major developed economies aren’t too far behind. The UK has an unemployment rate below 4%. Canada and Europe usually have unemployment rates that are considerably higher than the US and the UK. That remains the case, but both report jobless totals that are below previous cyclical lows.
All this suggests that workers are in a strong position to seek bigger wage gains in an effort to keep up with inflation. The possibility of a global wage-price spiral still cannot be dismissed out of hand. This could force central banks to raise interest rates more than they would prefer.
In Europe, the need to hike interest rates has once again raised the spectre of another periphery debt crisis. The stress has not reached the crisis levels of the 2010-to-2012 period. Given all the other problems facing Europe, the ECB has vowed to support the weaker members of the eurozone with continued bond purchases.
As was the case last time, the economic priorities of the strongest countries are diverging from their weaker neighbours. The German-led group needs a more aggressive policy-tightening along the lines of what the Fed is expected to do. Meanwhile, the weaker countries—Italy and Greece especially—now bear an even heavier debt burden relative to the size of their economies than was the case a decade ago. The interest expense on that debt could get out of hand fairly quickly if the cost of capital continues its sharp upward trajectory.
China’s economy appears to be in recovery mode. COVID-19 lockdowns in Beijing, Shanghai, and other parts of the country have eased. The zero-COVID policy pursued by the Chinese government has hurt the economy to an extent seldom seen in the past three decades. Home sales have also plummeted, falling 34% over the 12 months ended May. Chinese authorities are now trying to revive the property market by lowering mortgage rates, cutting mortgage down payment requirements, and encouraging banks to start lending again.
Economy-wide lending has picked up, finally turning positive for the first time in a year. If that trend continues in the months ahead, other measures of current economic health should begin to recover too. Whether that will be enough to stave off a global recession is doubtful, however, in view of the rising interestrate trend in the advanced economies. It might even prove counterproductive if a revival in Chinese demand for energy and other raw materials exacerbates the commodity-price boom at a time when global supplies are still constrained.
The poor performance of financial markets this year suggests that investors have already discounted a lot of bad news. The price decline in the S&P 500 Index recorded in the year to date contrasts sharply with the ongoing increases in forward-earnings estimates. The result has been one of the sharpest reductions in stock multiples outside of a recession in the past 25 years.18
The froth certainly appears to have been taken out of the markets by this year’s pullback. That’s the good news. The bad news is that an economic recession and a corresponding decline in earnings might not yet be fully reflected in stock prices. Multiples tend to slide as projected earnings estimates fall. Even if priceto-earnings ratios remain at current levels, there could be a decline in projected earnings—and a comparable drop in stock prices—as analysts incorporate a recession’s impact into their models. While the consensus view is that stock prices face rough seas ahead, it is possible that earnings multiples do not need to contract much further than they have already—with the caveat that bond yields stabilise near current levels and do not climb significantly higher.
Glossary of Financial Terms
Bull market: A bull market refers to a market environment in which prices are generally rising (or are expected to rise) and investorcconfidence is high.
European Commission: The European Commission is the executive branch of the European Union. It operates as a cabinet government, with 27 members of the Commission headed by a President.
Fiscal policy: Fiscal policy relates to decisions about government revenues and outlays, like taxation and economic stimulus.
Futures: Futures are derivative financial instruments that serve as contracts between buyers and sellers of securities, commodities or other assets at a future date for a given price.
Group of 7 (G7): The G7 is an inter-governmental forum for the leaders of major advanced democratic nations that includes Canada, France, Germany, Italy, Japan, the UK and the US.
Hawk: Hawk refers to a central-bank policy advisor who has a negative view of inflation and its economic impact, and thus tends to favour higher interest rates.
Maturity: A bond’s maturity, or term, is a timeframe during which the bondholder will receive interest payments. At the end of this period, the bondholder is repaid its face value. The maturity is typically determined when a bond is issued.
Monetary policy: Monetary policy relates to decisions by central banks to influence the amount of money and credit in the economy by managing the level of benchmark interest rates and the purchase or sale of securities. Central banks typically make policy decisions based on their mandates to target specific levels or ranges for inflation and employment.
Mortgage-Backed Securities: Mortgage-backed securities (MBS) are pools of mortgage loans packaged together and sold to the public. They are usually structured in tranches that vary by risk and expected return.
Price-to-earnings (PE) ratio: The PE ratio is equal to the market capitalisation of a share or index divided by trailing (over the prior 12 months) or forward (forecasted over the next 12 months) earnings. The higher the PE ratio, the more the market is willing to pay for each dollar of annual earnings.
Quantitative easing: Quantitative easing refers to expansionary efforts by central banks to help increase the supply of money in the economy.
Summary of Economic Projections: The Fed’s Summary of Economic Projections (SEP) is based on economic projections collected from each member of the Fed Board of Governors and each Fed Bank president on a quarterly basis.
Yield: Yield is a general term for the expected return, in percentage or basis points (one basis point is 0.01%), of a fixed-income investment.
Yield curve: The yield curve represents differences in yields across a range of maturities of bonds of the same issuer or credit rating (likelihood of default). A steeper yield curve represents a greater difference between the yields. A flatter curve indicates the yields are closer together.
Index Descriptions
The Bloomberg Commodity Index is composed of futures contracts and reflects the returns on a fully collateralised investment in the Index. This combines the returns of the Index with the returns on cash collateral invested in 13-week (3-month) US Treasury bills.
The Bloomberg Global Aggregate Index is an unmanaged market-capitalisation-weighted benchmark that tracks the performance of investment-grade fixed-income securities denominated in 13 currencies. The Index reflects reinvestment of all distributions and changes in market prices.
The MSCI ACWI Index is a market-capitalisation-weighted index composed of over 2,000 companies, and is representative of the market structure of 46 developed- and emerging-market countries in North and South America, Europe, Africa and the Pacific Rim. The Index is calculated with net dividends reinvested in US dollars.
The S&P 500 Index is a market-capitalisation-weighted index that consists of 500 publicly-traded large US companies that are considered representative of the broad US stock market.
The US Dollar Index (DXY Index) measures the value of the US dollar relative to a basket of other currencies, including the currencies of some of the US’s major trading partners: the euro, Swiss franc, Japanese yen, Canadian dollar, British pound, and Swedish krona.
The US Personal Consumption Expenditures (PCE) Price Index is the primary inflation index used by the Federal Reserve when making monetary-policy decisions.
Important Information
Data refers to past performance. Past performance is not a reliable indicator of future results.
Investments in SEI Funds are generally medium- to long-term investments. The value of an investment and any income from it can go down as well as up. Investors may get back less than the original amount invested. Returns may increase or decrease as a result of currency fluctuations. Additionally, this investment may not be suitable for everyone. If you should have any doubt whether it is suitable for you, you should obtain expert advice.
No offer of any security is made hereby. Recipients of this information who intend to apply for shares in any SEI Fund are reminded that any such application may be made solely on the basis of the information contained in the Prospectus. This material represents an assessment of the market environment at a specific point in time and is not intended to be a forecast of future events, or a guarantee of future results. This information should not be relied upon by the reader as research or investment advice regarding the funds or any stock in particular, nor should it be construed as a recommendation to purchase or sell a security, including futures contracts.
In addition to the normal risks associated with equity investing, international investments may involve risk of capital loss from unfavourable fluctuation in currency values, from differences in generally accepted accounting principles or from economic or political instability in other nations. Bonds and bond funds are subject to interest rate risk and will decline in value as interest rates rise. High yield bonds involve greater risks of default or downgrade and are more volatile than investment grade securities, due to the speculative nature of their investments.
Narrowly focused investments and smaller companies typically exhibit higher volatility. SEI Funds may use derivative instruments such as futures, forwards, options, swaps, contracts for differences, credit derivatives, caps, floors and currency forward contracts. These instruments may be used for hedging purposes and/or investment purposes.
While considerable care has been taken to ensure the information contained within this document is accurate and up-to-date, no warranty is given as to the accuracy or completeness of any information and no liability is accepted for any errors or omissions in such information or any action taken on the basis of this information.
This information is issued by SEI Investments (Europe) Limited, 1st Floor, Alphabeta, 14-18 Finsbury Square, London EC2A 1BR which is authorised and regulated by the Financial Conduct Authority.
SEI sources data directly from FactSet, Lipper, and BlackRock, unless otherwise stated.
The opinions and views in this commentary are of SEI only and should not be construed as investment advice.
Please refer to our latest Prospectus (which includes information in relation to the use of derivatives and the risks associated with the use of derivative instruments), Key Investor Information Document, Summary of UCITS Shareholder rights (which includes a summary of the rights that shareholders of our funds have) and the latest Annual or Semi-Annual Reports for more information on our funds, which can be located at Fund Documents. And you should read the terms and conditions contained in the Prospectus (including the risk factors) before making any investment decision.


