Monthly Market Commentary: April Adversity Among Allies
Economic Backdrop
Geopolitical story lines came into full bloom during April, creating instances of simultaneous cooperation and tension among allies. The US, British and French militaries launched synchronised airstrikes on Syrian military installations in retaliation for President Bashar al-Assad’s government using chemical weapons on civilians in rebel-held areas of the country. The EU and US also coordinated sanctions against Russian institutions and related parties in response to the poisoning of a former Russian spy in the UK.
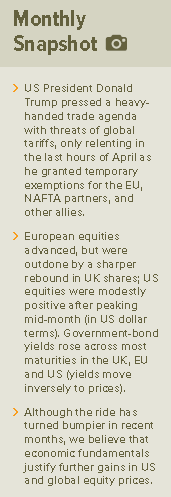
At the same time, US President Donald Trump pressed a heavy-handed trade agenda with threats of global tariffs, only relenting in the last hours of April—granting temporary exemptions for the EU, NAFTA partners, and other allies (although quotas remained). Trump’s softened stance was likely influenced by separate trips made by French President Emanuel Macron and German Premier Angela Merkel to visit him in the US capitol. As for China (the US president’s primary target of trade score-settling), stakes were elevated in early April after Trump countered the country’s announcement of retaliatory trade measures with threats of a new, larger round of tariffs. The US administration said in late April that a cabinet-level trade delegation would meet with top Chinese government officials in Beijing at the beginning of May to seek concessions.
Rogue-state nuclear programmes earned a significant share of the spotlight in April: North Korean Supreme Leader Kim Jong-Un announced a willingness to mothball his country’s efforts and, in an unprecedented display of unity, crossed the border as he clasped hands with South Korean President Moon Jae-in. Elsewhere, Israeli Prime Minister Benjamin Netanyahu televised evidence of the Iranian Republic’s plans to reignite its nuclear ambitions—raising questions about Iran’s adherence to the terms of its multi-party disarmament agreement. Although the International Atomic Energy Agency refuted the claims, President Trump signalled he would back out of the accord in May.
Closer to home, Brexit negotiators continued struggling to find a way around the Irish border. UK representatives appeared willing to consider two options: 1) achieve UK-EU regulatory alignment—which would eliminate the need for a dedicated solution, but disenchant Brexiteers seeking UK institutional independence; or 2) combine “smart technology” customs and “trusted traders” programmes designed to expedite passage through a land border. EU emissaries seemed keen on a backstop plan that would bring Northern Ireland into alignment with the Republic and, by extension, the EU, but would erect a barrier between Northern Ireland and the rest of the UK. The Democratic Unionist Party (the Northern Irish party that serves as partner to Prime Minister Theresa May’s Conservative minority government in parliament) was so put off by the EU backstop proposal that it professed a willingness to dissolve the parliamentary agreement over the matter.
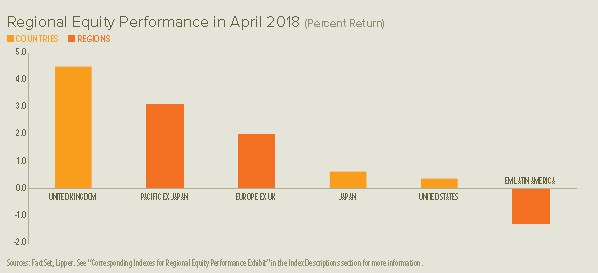
European equities advanced in April, but were outdone by a sharper rebound in UK shares. US equities were modestly positive after peaking mid-month, although small companies fared better than their larger counterparts. In Asia, Japanese equities climbed throughout the month, while Hong Kong equities advanced and mainland Chinese shares retreated. Latin American shares were lower as emerging markets trailed developed markets for the month. Government-bond yields rose across all maturities in the UK, EU and US, with the exception of a decline in short-term UK rates.
UK manufacturing growth fell by more than expected in April, delivering its weakest showing since 2016. Labour-market numbers were mixed: the claimant-count unemployment rate held firm at 2.4% in March despite an uptick in claimants; the December-to-February unemployment rate declined to 4.2%; and average year-over-year earnings growth in February remained 2.8%. Preliminary economic growth data showed an anaemic 0.1% expansion in the first quarter and 1.2% in the 12-month period ending March.
The eurozone’s manufacturing expansion continued to soften from its December high-water mark, settling in April at still-strong levels. Economic sentiment recovered slightly in April after sliding during the first three months of the year, with industrial and consumer surveys recording improvements. The unemployment rate held at 8.5% in March despite a decline of more than 80,000 in the number of Europeans out of work, including a 0.2% drop in youth joblessness. An early estimate of overall economic growth measured 0.4% in the first quarter and 2.5% year over year, both slower relative to the prior quarter.
US manufacturing was strained in April, as robust demand was challenged by longer delivery timelines and higher production costs. Consumer confidence remained near historically high levels in April—following rising price pressures and employment costs during the first quarter and expanding core consumer prices during March. Preliminary first-quarter economic growth was reported at a 2.3% annualised rate—in line with the typically mild pace of the three-month period ending March, yet slower than the rate of expansion recorded in the fourth quarter.
Our View
We suspect the bull market in US equities is somewhere near the beginning of the end, while it may be somewhat closer to the end of the beginning in other countries. To be clear, we are not saying that the bull market in US stocks is concluding. Rather, we are noting that the fundamental, technical and psychological factors driving equity-market performance appear consistent with the latter stages of an up cycle. This particular phase can last a few years if all goes well, but the ride will likely be bumpier than in recent years. We still do not see many serious signs of overvaluation or economic imbalances in the US that would suggest imminent danger of a severe correction, much less a devastating bear market on par with the 2008-to-2009 experience.
Although equity markets underwent their first real correction in some 20 months during the first quarter, the pullback does not look like the start of a more serious decline. At SEI, we see two fundamental drivers behind the correction in equities and the return to more-volatile price action. The first is the upward shift in investors’ interest-rate expectations as the global economy kicks into a higher gear. The second is concern that the Trump administration’s recent actions on the trade front will lead to a broader trade war that could hurt global growth and push inflation higher sooner.
There certainly are cyclical pressures pushing yields up from their historic lows. The long bull market in equities and other risk-oriented assets has been sustained by the extraordinarily expansive monetary policies of the world’s most important central banks. And the subsequent decline in yields across the maturity spectrum reached levels never seen before. In our view, this 37-year tailwind is turning into a headwind.
But the US Treasury yield curve remains upward sloping and, in our opinion, can narrow further without causing too many problems. Interest-rate spreads for investment-grade, high-yield and emerging-market debt also remain near cycle lows. High-yield bonds, in particular, should be considered the canary in the coal mine. Spreads tend to widen well before the stock market tops out. Even during the recent turbulence in the stock market, the option-adjusted spread on high-yield bonds held surprisingly steady.
As we have pointed out on several occasions in the past, the US equity market has historically managed to withstand the depressive impact of rising interest rates until the 10-year US Treasury reaches a level of 4% to 5%. Owing to the structural decline in bond yields and the elevated equity valuations that have resulted, we now think it prudent to assume that the stock market will begin to struggle if the 10-year Treasury rate approaches 4% (the lower end of the traditional “danger zone”).
While we maintain a positive view of equities and other risk assets, we must admit that our optimism is being tested as the Trump administration uses protectionism as a bargaining tool against friend and foe alike. Impediments to trade—tariffs, quotas and non-tariff barriers—raise prices and reduce demand, leading to a dead-weight loss for society. More jobs are lost by consuming industries than are gained by the beneficiaries of protectionism. A trade war of consequence could add to the inflation pressures that have already emerged as a result of the pick-up in economic activity and the tightening employment situation.
We are in watchful-waiting mode when it comes to trade, but think it’s premature to expect a catastrophe. Our preference is to see what trade sanctions are actually levied, and how target countries respond, instead of assuming the worst from the get-go. Until there is more clarity on the extent of the US protectionist measures being put into place, we think it’s best to focus on the strong fundamental backdrop. Profit growth remains vibrant, inflation is still well-contained and the US Federal Reserve’s decision-makers would prefer to normalise monetary policy in a steady, predictable fashion. For now, we believe it’s proper for us to maintain a “risk-on” investment orientation.
We may have finally begun to see a shift away from the poor relative performance of eurozone equities that has persisted since the middle of last year. The eurozone economy has been gaining traction since early 2016; we judged the potential for future growth to be much greater in the eurozone than in the US given their respective points in the economic cycle. We also looked for a jump in earnings, as European companies have a high degree of operational leverage, while valuation considerations also provided support to our bullish rationale.
On a fundamental basis, we think investors remain sceptical about the staying power of the European expansion. The European Central Bank is moving away from the asset purchases that have supported the eurozone’s economic recovery and credit markets. And by mid-year 2019, if not sooner, we should see the first steps toward normalising policy rates—although negative yields are an absurdly low starting point. While the outlook for the eurozone is mixed, it seems bright and sunny compared to that of the UK. As we have mentioned in previous reports, Brexit has become the overwhelming obsession of investors and policymakers.
US congressional elections will take place in November, potentially jeopardising current Republican control of the House of Representatives. Legislating in the US has been tough enough under a “unified” government; it will become next to impossible under split governance, should power become more evenly distributed across the two major parties. We would also expect a Democratic House to ramp up the pace of investigations into the president, his staff and his cabinet.
The past nine years have been full of challenges and uncertainties. The years ahead don’t seem to promise anything different in that regard. Yet, the bull market has managed through it all. Let’s give it the benefit of the doubt for a while longer. Although the ride has turned bumpier, we believe that economic fundamentals justify further gains in US and global equity prices. The synchronized global expansion is still alive and well. Earnings continue to climb briskly around the world. US companies’ cash flows and earnings, meanwhile, are benefiting mightily from tax reform passed late last year by the US government. There really are few signs that a recession will rear its ugly head any time in the next 12 to 18 months.
Glossary of Financial Terms
Bear market: A bear market refers to a market environment In which prices are generally falling (or are expected to do so) and investor confidence is low.
Bull market: A bull market refers to a market environment in which prices are generally rising (or are expected to do so) and investor confidence is high.
Fundamentals: Fundamentals refers to data that can be used to assess a country or company’s financial health such as amount of debt, level of profitability, cash flow, inventory size, etc.
Option-adjusted yield spreads: A calculation used to help determine price differences between similar products that allow different embedded options.
Yield curve: The yield curve represents differences in yields across a range of maturities of bonds of the same issuer or credit rating (likelihood of default). A steeper yield curve represents a greater difference between the yields. A flatter curve indicates the yields are closer together.
Yield spreads: Yield spreads represents the difference in yields offered between different types of bonds. If they tighten, this means that the difference has decreased. If they widen, this means the difference has increased.
Important Information
Data refers to past performance. Past performance is not a reliable indicator of future results.
Investments in SEI Funds are generally medium- to long-term investments. The value of an investment and any income from it can go down as well as up. Investors may get back less than the original amount invested. Returns may increase or decrease as a result of currency fluctuations. Additionally, this investment may not be suitable for everyone. If you should have any doubt whether it is suitable for you, you should obtain expert advice.
No offer of any security is made hereby. Recipients of this information who intend to apply for shares in any SEI Fund are reminded that any such application may be made solely on the basis of the information contained in the Prospectus. This material represents an assessment of the market environment at a specific point in time and is not intended to be a forecast of future events, or a guarantee of future results. This information should not be relied upon by the reader as research or investment advice regarding the funds or any stock in particular, nor should it be construed as a recommendation to purchase or sell a security, including futures contracts.
In addition to the normal risks associated with equity investing, international investments may involve risk of capital loss from unfavourable fluctuation in currency values, from differences in generally accepted accounting principles or from economic or political instability in other nations. Bonds and bond funds are subject to interest rate risk and will decline in value as interest rates rise. High yield bonds involve greater risks of default or downgrade and are more volatile than investment grade securities, due to the speculative nature of their investments. Narrowly focused investments and smaller companies typically exhibit higher volatility. SEI Funds may use derivative instruments such as futures, forwards, options, swaps, contracts for differences, credit derivatives, caps, floors and currency forward contracts. These instruments may be used for hedging purposes and/or investment purposes.
While considerable care has been taken to ensure the information contained within this document is accurate and up-to-date, no warranty is given as to the accuracy or completeness of any information and no liability is accepted for any errors or omissions in such information or any action taken on the basis of this information.
This information is issued by SEI Investments (Europe) Limited, 1st Floor, Alphabeta, 14-18 Finsbury Square, London EC2A 1BR which is authorised and regulated by the Financial Conduct Authority. Please refer to our latest Full Prospectus (which includes information in relation to the use of derivatives and the risks associated with the use of derivative instruments), Key Investor Information Documents and latest Annual or Semi-Annual Reports for more information on our funds. This information can be obtained by contacting your Financial Adviser or using the contact details shown above.
SEI sources data directly from FactSet, Lipper, and BlackRock, unless otherwise stated.


